| Param | Original file | Final file |
|---|---|---|
| Filename | modeM0/AS1A02_108T01_9000001024_07449cztM0_level2.evt | modeM0/AS1A02_108T01_9000001024_07449cztM0_level2_quad_clean.evt |
| Size (bytes) | 1,057,838,400 | 161,645,760 |
| Size | 1008.8 MB | 154.2 MB |
| Events in quadrant A | 6,807,754 | 982,826 |
| Events in quadrant B | 6,795,964 | 997,348 |
| Events in quadrant C | 9,538,831 | 963,274 |
| Events in quadrant D | 7,903,188 | 939,924 |
| Mode SS | |||
|---|---|---|---|
| Quadrant | BADHDUFLAG | Total packets | Discarded packets |
| A | 0 | 298 | 0 |
| B | 0 | 298 | 0 |
| C | 0 | 298 | 0 |
| D | 0 | 298 | 0 |
| Mode M9 | |||
|---|---|---|---|
| Quadrant | BADHDUFLAG | Total packets | Discarded packets |
| A | 0 | 15 | 0 |
| B | 0 | 15 | 0 |
| C | 0 | 15 | 0 |
| D | 0 | 15 | 0 |
| Mode M0 | |||
|---|---|---|---|
| Quadrant | BADHDUFLAG | Total packets | Discarded packets |
| A | 0 | 30324 | 3 |
| B | 0 | 29924 | 2 |
| C | 0 | 38067 | 2 |
| D | 0 | 33189 | 2 |
| Quadrant | Total seconds | Saturated seconds | Saturation percentage |
|---|---|---|---|
| A | 14657 | 122 | 0.832367% |
| B | 14657 | 139 | 0.948352% |
| C | 14657 | 159 | 1.084806% |
| D | 14657 | 250 | 1.705670% |
Noise dominated data is calculated using 1-second bins in cleaned event files. If a bin has >2000 counts, and if more than 50% of those come from <1% of pixels, then it is considered to be noise-dominated and hence unusable.
| Quadrant | # 1 sec bins | Bins with >0 counts | Bins with >2000 counts | High rate bins dominated by noise | Noise dominated (total time) | Noise dominated (detector-on time) | Marked lightcurve |
|---|---|---|---|---|---|---|---|
| A | 16132 | 14658 | 0 | 0 | 0.00% | 0.00% |  |
| B | 16132 | 14659 | 5 | 5 | 0.03% | 0.03% |  |
| C | 16132 | 14658 | 3 | 3 | 0.02% | 0.02% |  |
| D | 16132 | 14658 | 107 | 107 | 0.66% | 0.73% |  |
Top three noisy pixels from each quadrant. If the there are fewer than three noisy pixels in the level2.evt file, extra rows are filled as -1
| Pixel properties | Quadrant properties | ||||||
|---|---|---|---|---|---|---|---|
| Quadrant | DetID | PixID | Counts | Sigma | Mean | Median | Sigma |
| A | 15 | 234 | 284750 | 826.58 | 1684 | 1644 | 342.5 |
| A | 3 | 1 | 18649 | 49.65 | 1684 | 1644 | 342.5 |
| A | 0 | 226 | 15917 | 41.67 | 1684 | 1644 | 342.5 |
| B | 0 | 214 | 156243 | 478.63 | 1701 | 1656 | 323.0 |
| B | 12 | 111 | 33534 | 98.7 | 1701 | 1656 | 323.0 |
| B | 11 | 111 | 26994 | 78.45 | 1701 | 1656 | 323.0 |
| C | 9 | 68 | 3111593 | 8175.94 | 1640 | 1644 | 380.4 |
| C | 13 | 61 | 12554 | 28.68 | 1640 | 1644 | 380.4 |
| C | 8 | 128 | 10744 | 23.92 | 1640 | 1644 | 380.4 |
| D | 13 | 105 | 490946 | 1219.5 | 1639 | 1587 | 401.3 |
| D | 2 | 14 | 365016 | 905.68 | 1639 | 1587 | 401.3 |
| D | 1 | 20 | 332139 | 823.75 | 1639 | 1587 | 401.3 |
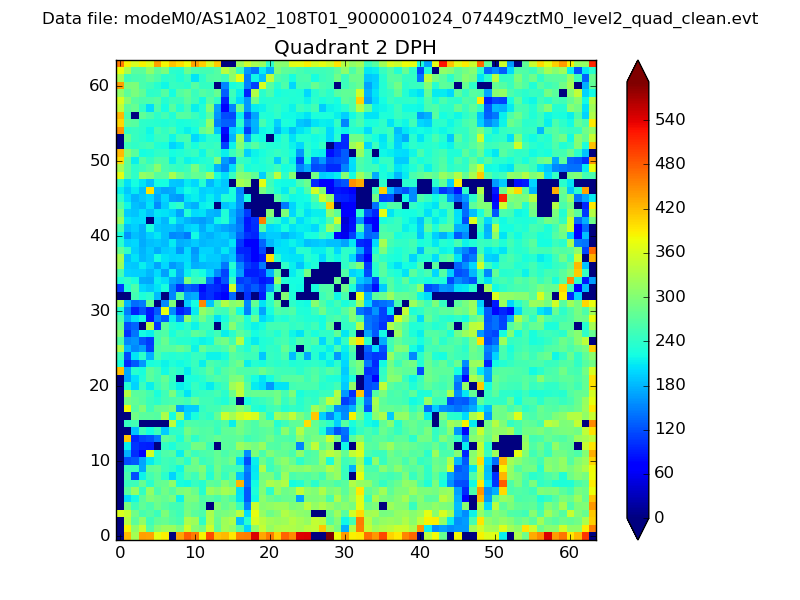
Histogram calculated using DETX and DETY for each event in the final _common_clean file
| Quadrant A | 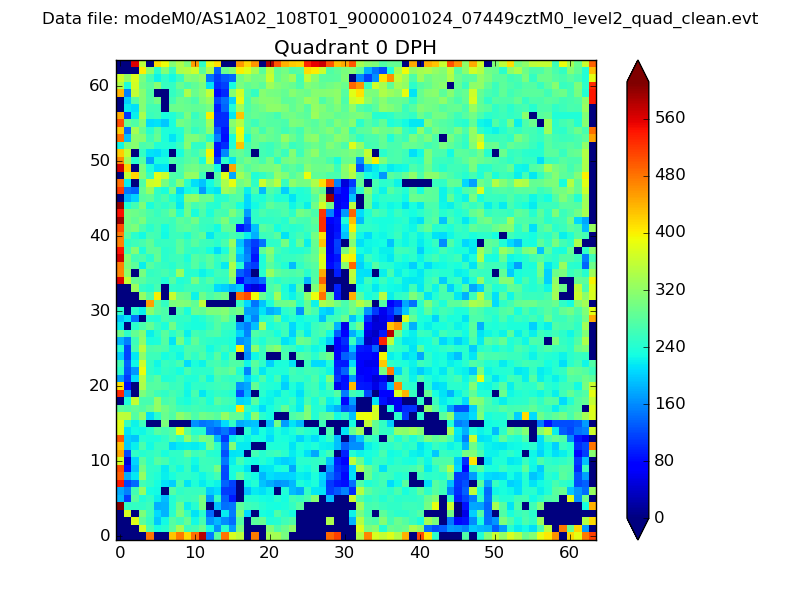 |
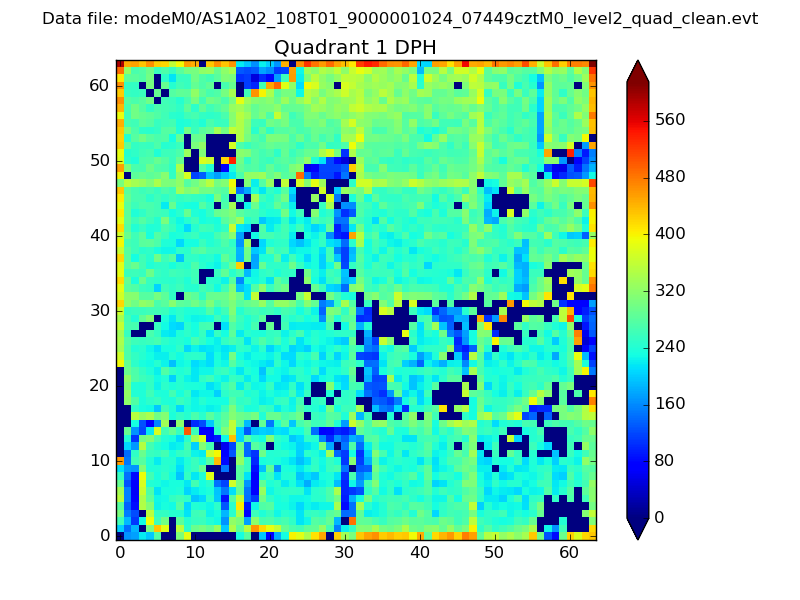 |
Quadrant B |
|---|---|---|---|
| Quadrant D | 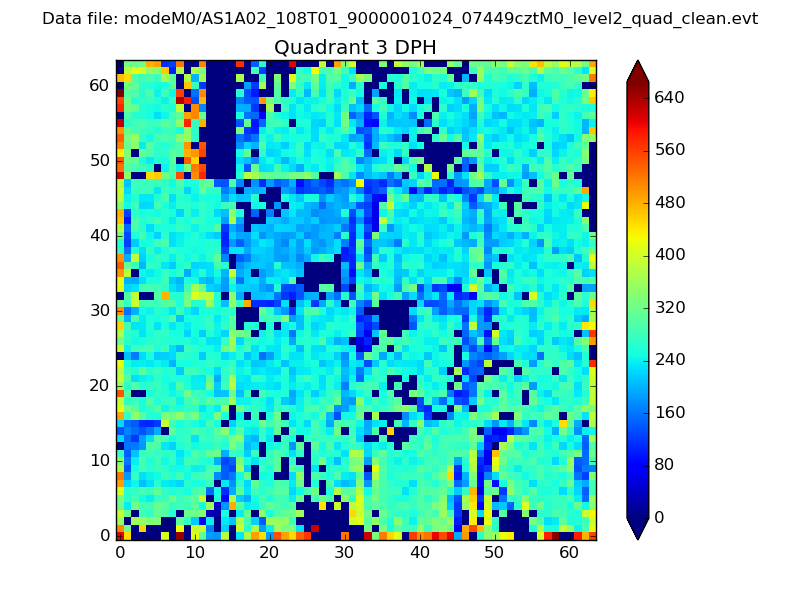 |
 |
Quadrant C |
| Plot type | Count rate plots | Images |
|---|---|---|
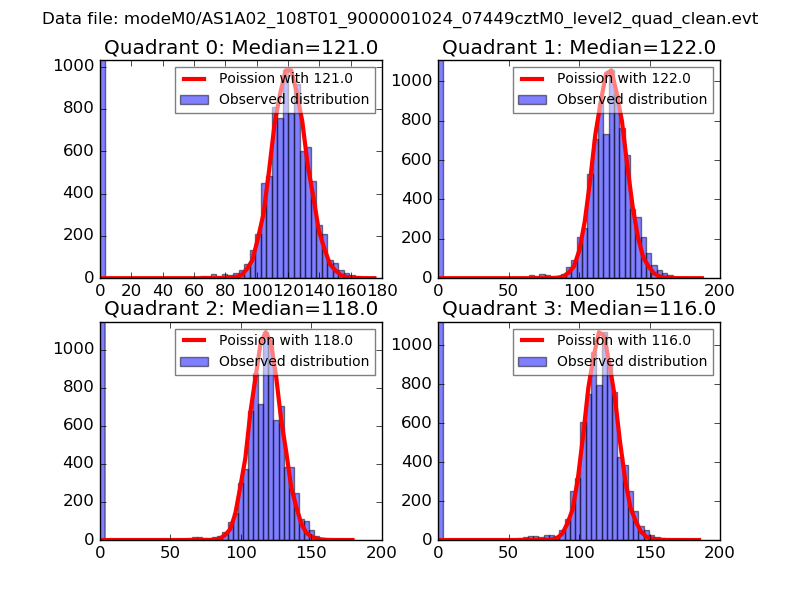
| Comparison with Poisson distribution Blue bars denote a histogram of data divided into 1 sec bins. Red curve is a Poisson curve with rate = median count rate of data. |
 |
 |
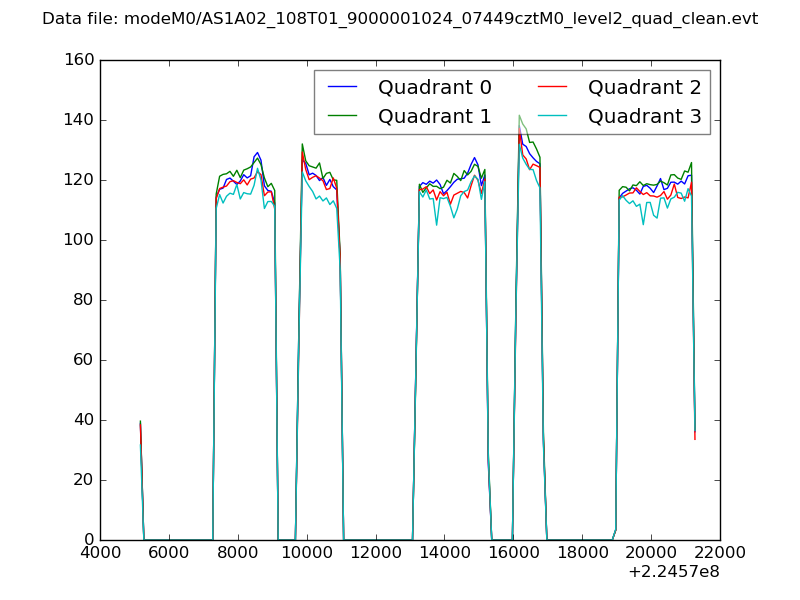
| Quadrant-wise count rates Data is divided into 100 sec bins |
 |
|
| Module-wise count rates for Quadrant A Data is divided into 100 sec bins |
 |
 |
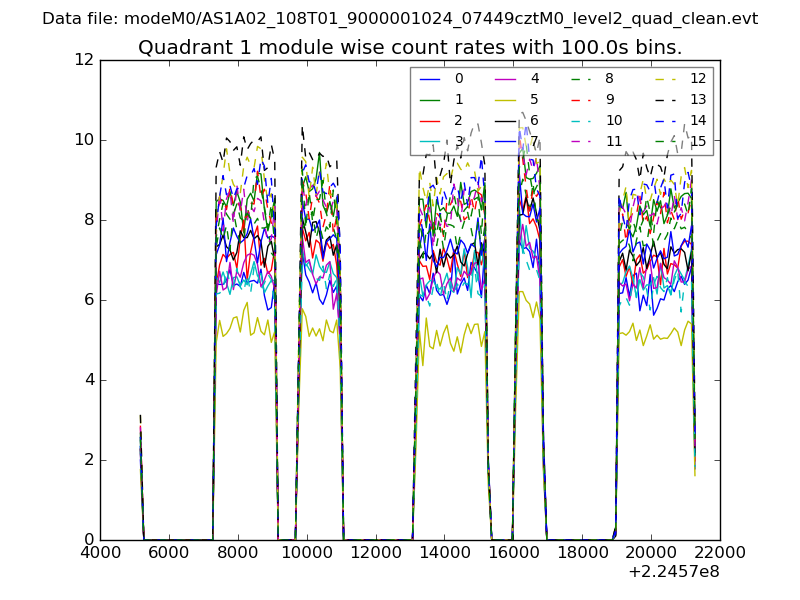
| Module-wise count rates for Quadrant B Data is divided into 100 sec bins |
 |
 |
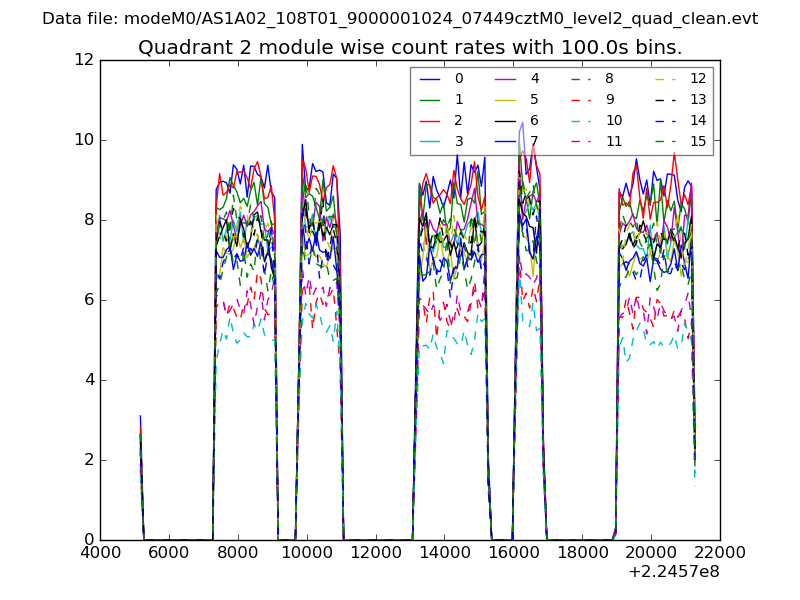
| Module-wise count rates for Quadrant C Data is divided into 100 sec bins |
 |
 |
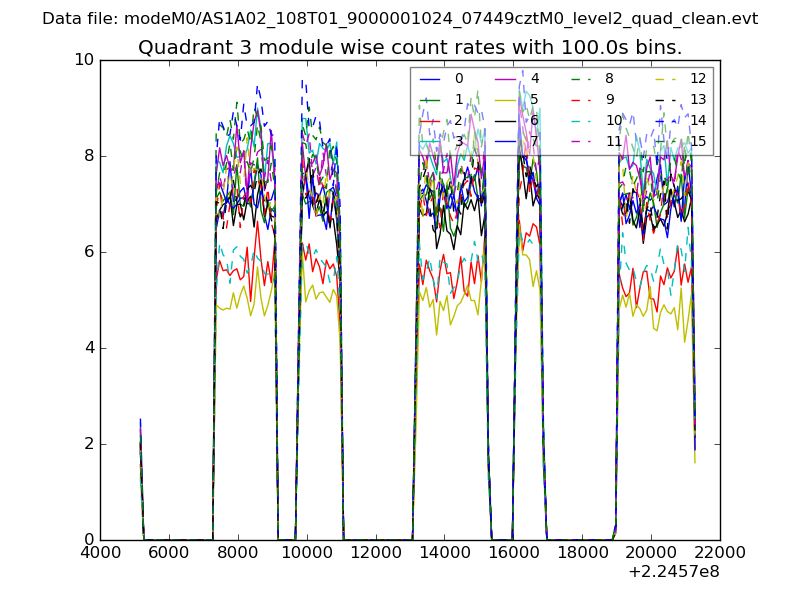
| Module-wise count rates for Quadrant D Data is divided into 100 sec bins |
 |
 |
| Parameter | Plot |
|---|---|
| CZT HV Monitor | 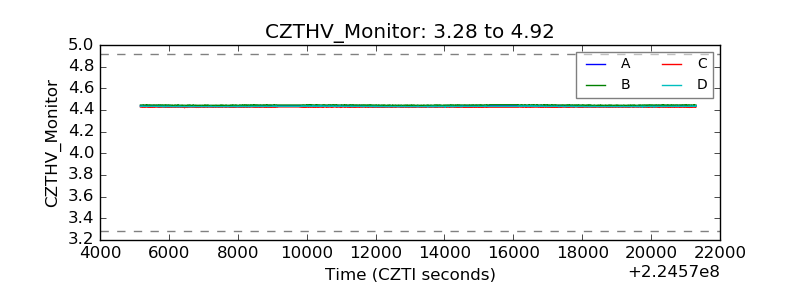 |
| D_VDD | 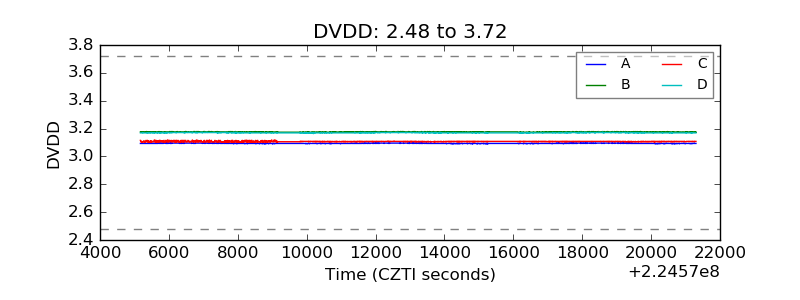 |
| Temperature 1 | 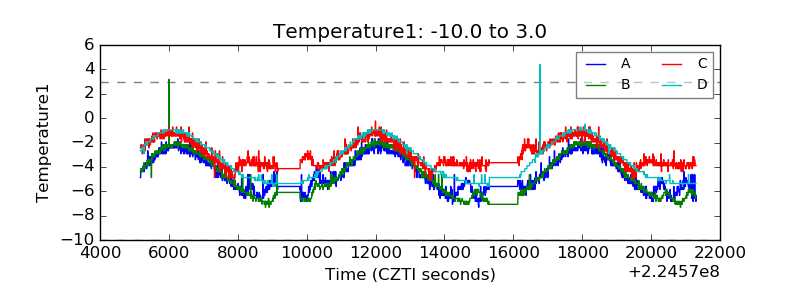 |
| Veto HV Monitor | 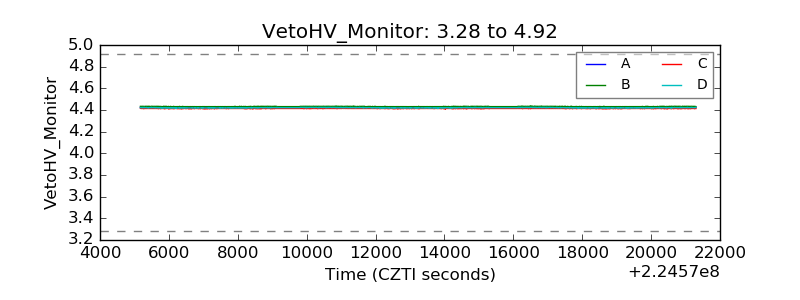 |
| Veto LLD | 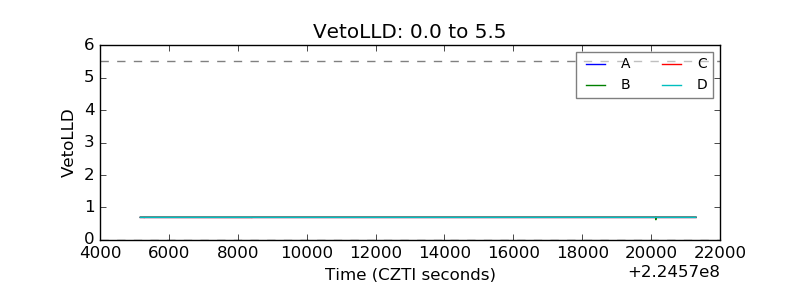 |
| Alpha Counter | 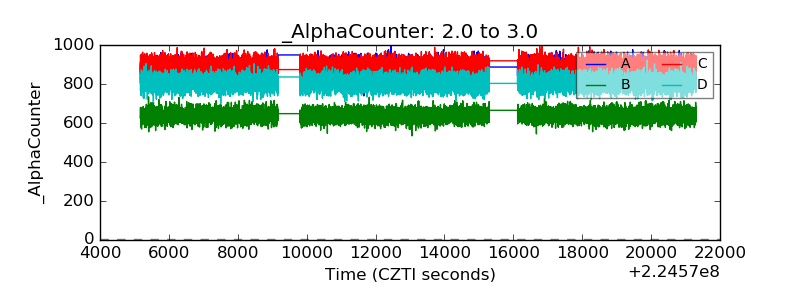 |
| _CPM_Rate | 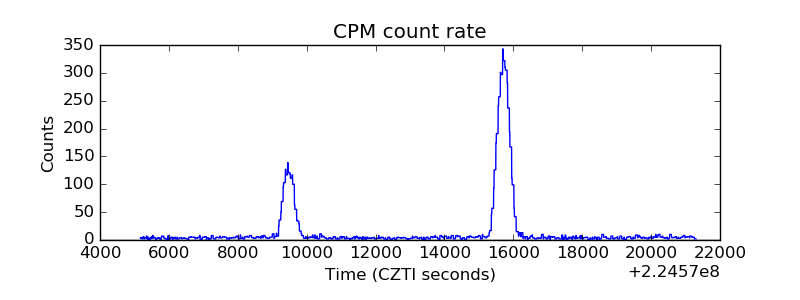 |
| CZT Counter | 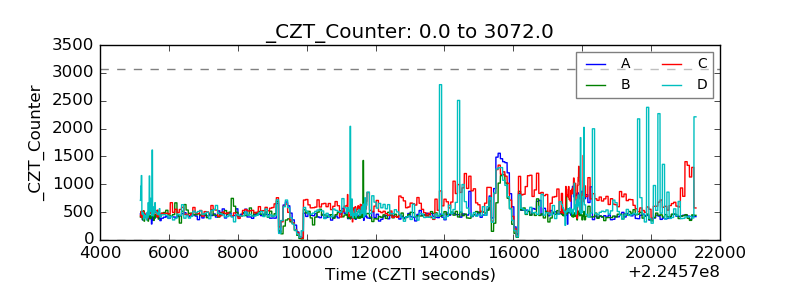 |
| +2.5 Volts monitor |  |
| +5 Volts monitor |  |
| _ROLL_ROT | 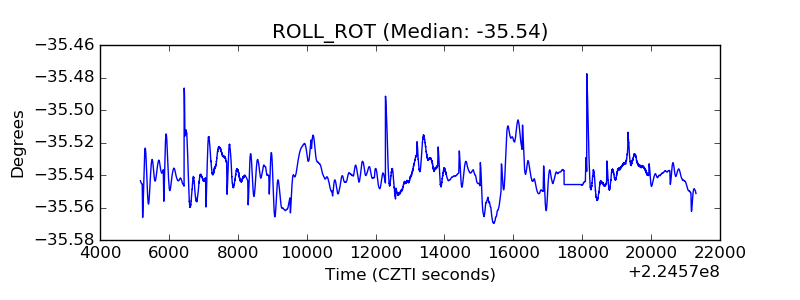 |
| _Roll_DEC | 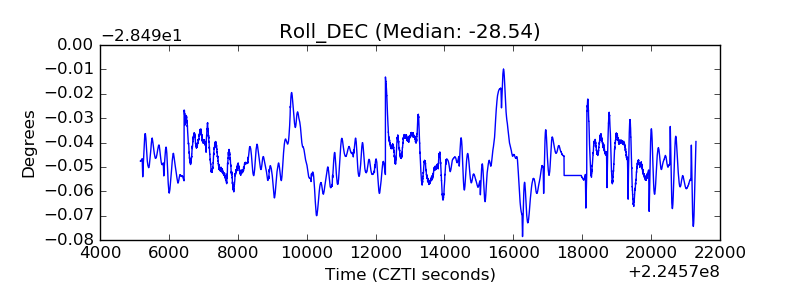 |
| _Roll_RA | 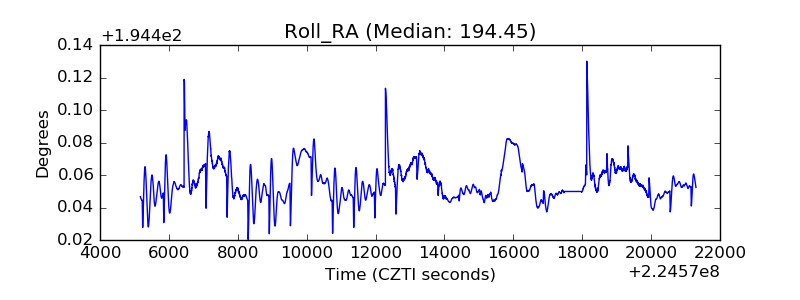 |
| Veto Counter |  |