| Param | Original file | Final file |
|---|---|---|
| Filename | modeM0/AS1A02_108T01_9000001024_07452cztM0_level2.evt | modeM0/AS1A02_108T01_9000001024_07452cztM0_level2_quad_clean.evt |
| Size (bytes) | 523,667,520 | 64,036,800 |
| Size | 499.4 MB | 61.1 MB |
| Events in quadrant A | 3,282,411 | 375,668 |
| Events in quadrant B | 3,420,701 | 379,110 |
| Events in quadrant C | 4,228,152 | 366,448 |
| Events in quadrant D | 4,478,653 | 355,394 |
| Mode SS | |||
|---|---|---|---|
| Quadrant | BADHDUFLAG | Total packets | Discarded packets |
| A | 0 | 134 | 0 |
| B | 0 | 134 | 0 |
| C | 0 | 134 | 0 |
| D | 0 | 134 | 0 |
| Mode M9 | |||
|---|---|---|---|
| Quadrant | BADHDUFLAG | Total packets | Discarded packets |
| A | 0 | 20 | 0 |
| B | 0 | 20 | 0 |
| C | 0 | 20 | 0 |
| D | 0 | 21 | 0 |
| Mode M0 | |||
|---|---|---|---|
| Quadrant | BADHDUFLAG | Total packets | Discarded packets |
| A | 0 | 14128 | 3 |
| B | 0 | 14477 | 2 |
| C | 0 | 16808 | 2 |
| D | 0 | 17982 | 2 |
| Quadrant | Total seconds | Saturated seconds | Saturation percentage |
|---|---|---|---|
| A | 6630 | 98 | 1.478130% |
| B | 6630 | 100 | 1.508296% |
| C | 6630 | 127 | 1.915535% |
| D | 6630 | 237 | 3.574661% |
Noise dominated data is calculated using 1-second bins in cleaned event files. If a bin has >2000 counts, and if more than 50% of those come from <1% of pixels, then it is considered to be noise-dominated and hence unusable.
| Quadrant | # 1 sec bins | Bins with >0 counts | Bins with >2000 counts | High rate bins dominated by noise | Noise dominated (total time) | Noise dominated (detector-on time) | Marked lightcurve |
|---|---|---|---|---|---|---|---|
| A | 7820 | 6630 | 0 | 0 | 0.00% | 0.00% | 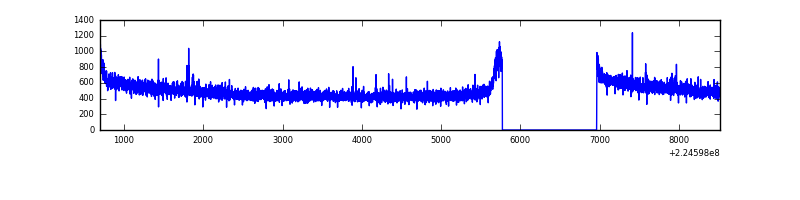 |
| B | 7820 | 6630 | 3 | 3 | 0.04% | 0.05% | 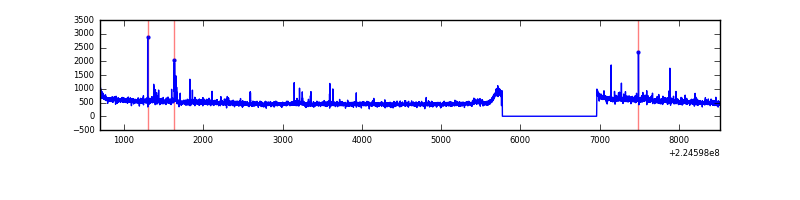 |
| C | 7820 | 6630 | 63 | 63 | 0.81% | 0.95% | 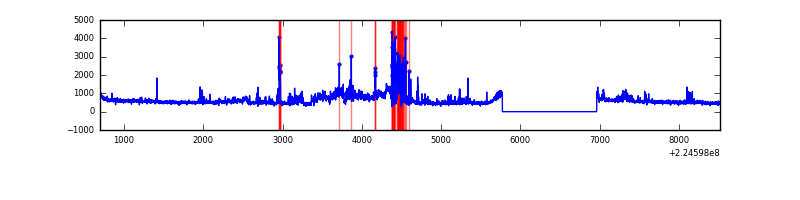 |
| D | 7820 | 6630 | 108 | 108 | 1.38% | 1.63% | 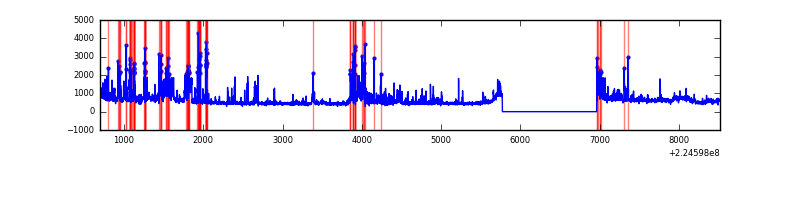 |
Top three noisy pixels from each quadrant. If the there are fewer than three noisy pixels in the level2.evt file, extra rows are filled as -1
| Pixel properties | Quadrant properties | ||||||
|---|---|---|---|---|---|---|---|
| Quadrant | DetID | PixID | Counts | Sigma | Mean | Median | Sigma |
| A | 13 | 14 | 8499 | 45.06 | 848 | 832 | 170.2 |
| A | 0 | 226 | 8241 | 43.54 | 848 | 832 | 170.2 |
| A | 12 | 194 | 7432 | 38.79 | 848 | 832 | 170.2 |
| B | 0 | 214 | 103410 | 637.97 | 851 | 831 | 160.8 |
| B | 12 | 111 | 16188 | 95.51 | 851 | 831 | 160.8 |
| B | 11 | 111 | 12918 | 75.17 | 851 | 831 | 160.8 |
| C | 9 | 68 | 941522 | 4981.38 | 815 | 818 | 188.8 |
| C | 1 | 16 | 103861 | 545.65 | 815 | 818 | 188.8 |
| C | 13 | 61 | 6391 | 29.51 | 815 | 818 | 188.8 |
| D | 13 | 105 | 671116 | 3421.78 | 811 | 789 | 195.9 |
| D | 1 | 20 | 298762 | 1521.04 | 811 | 789 | 195.9 |
| D | 12 | 221 | 136164 | 691.04 | 811 | 789 | 195.9 |
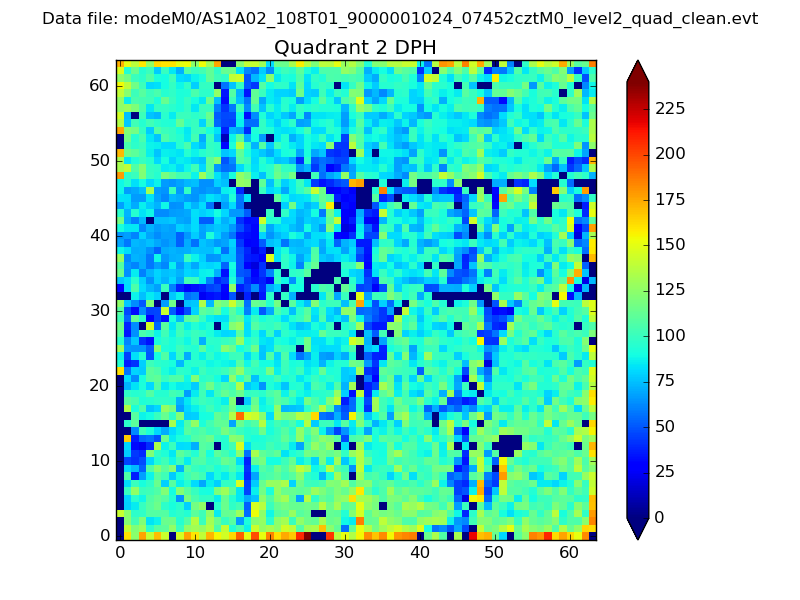
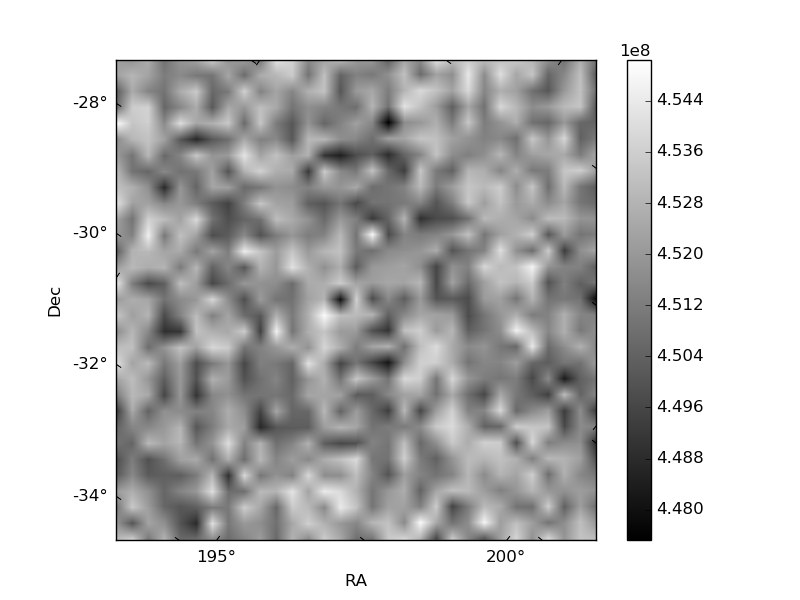
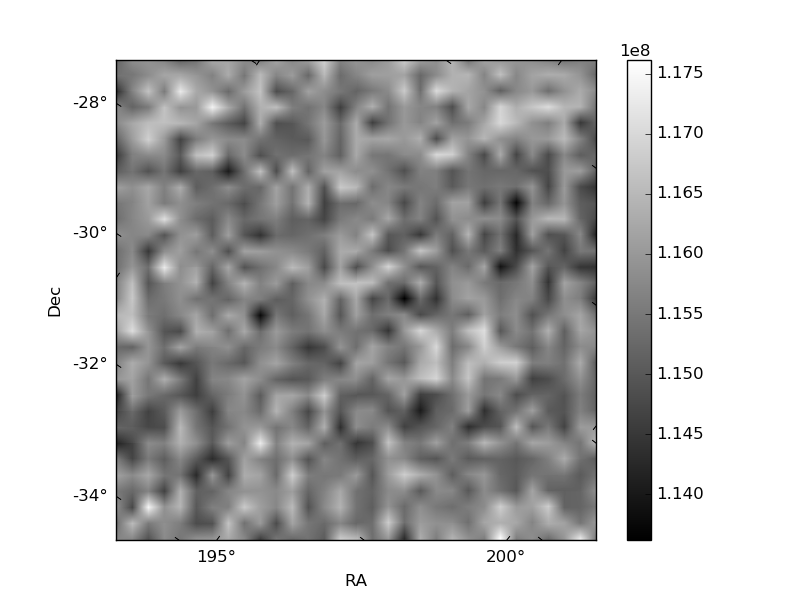
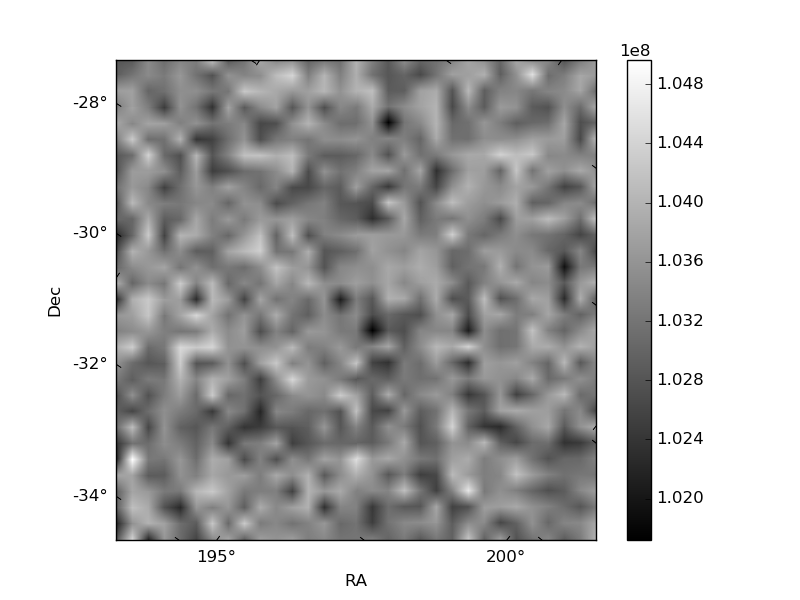
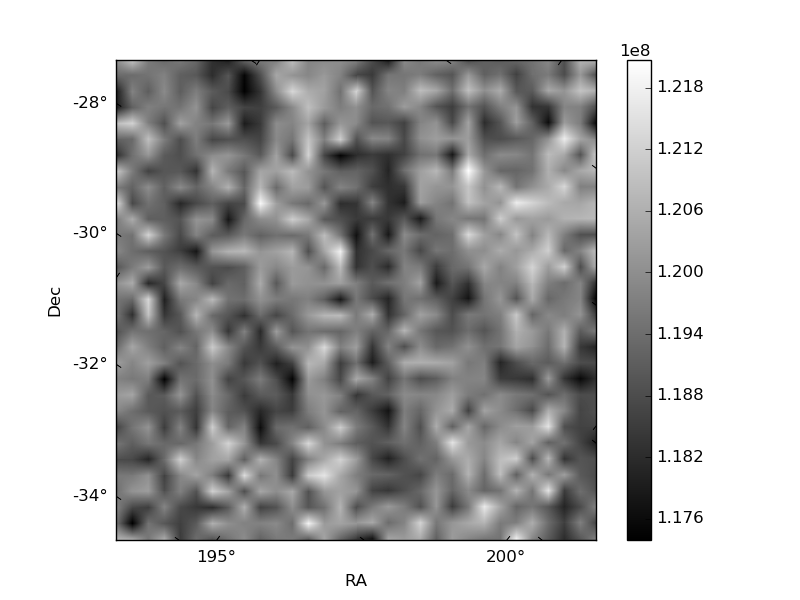
Histogram calculated using DETX and DETY for each event in the final _common_clean file
| Quadrant A | 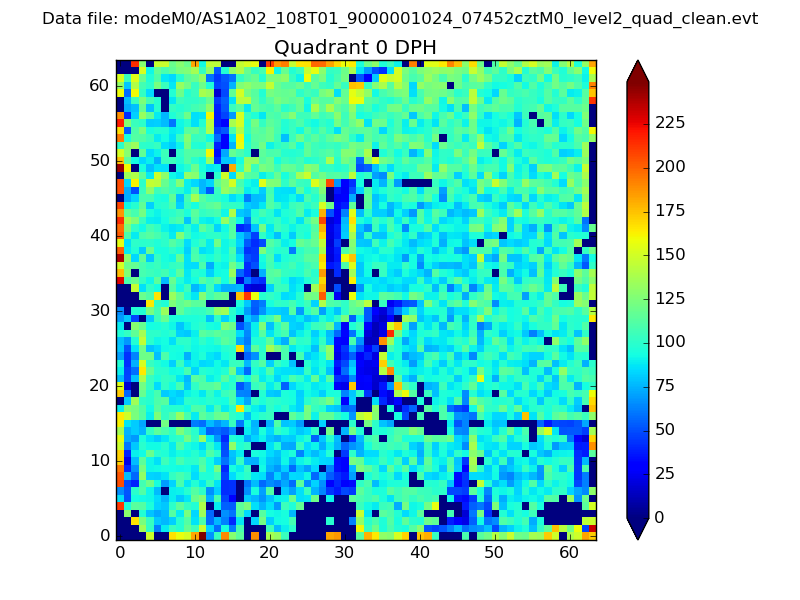 |
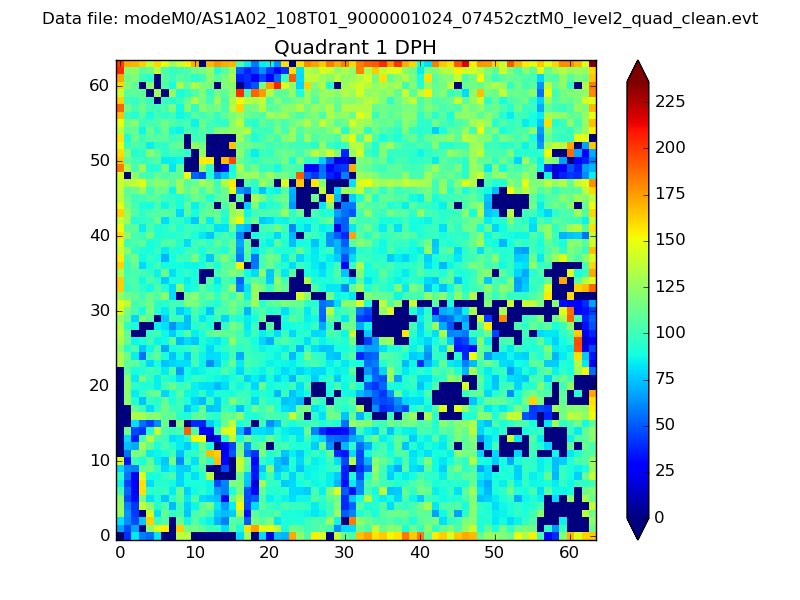 |
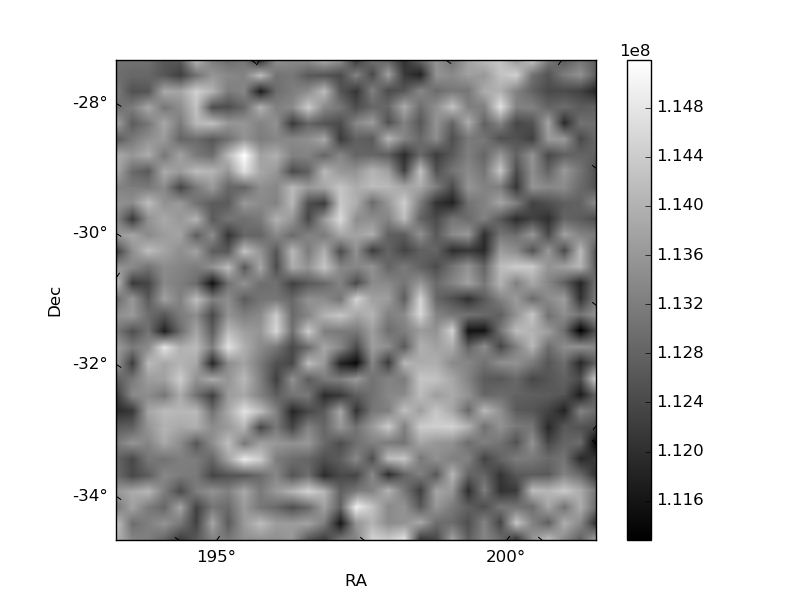
Quadrant B |
|---|---|---|---|
| Quadrant D | 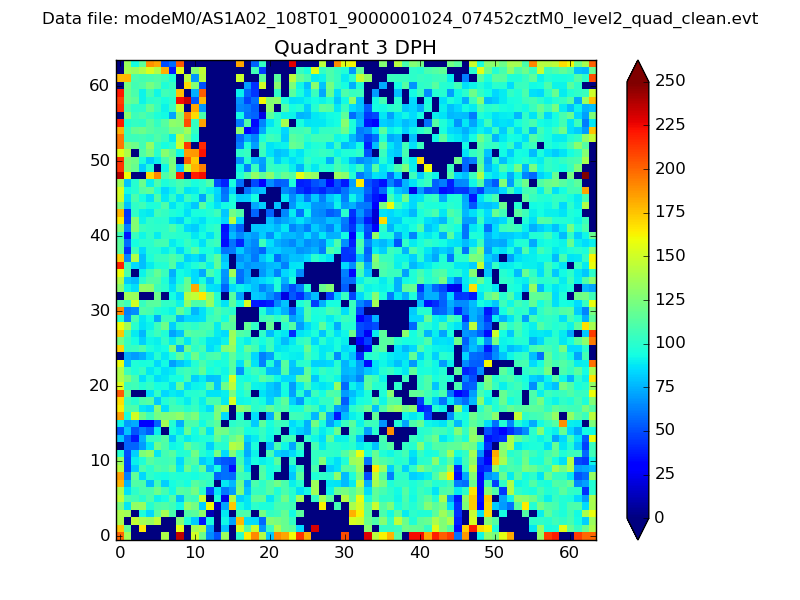 |
 |
Quadrant C |
| Plot type | Count rate plots | Images |
|---|---|---|
| Comparison with Poisson distribution Blue bars denote a histogram of data divided into 1 sec bins. Red curve is a Poisson curve with rate = median count rate of data. |
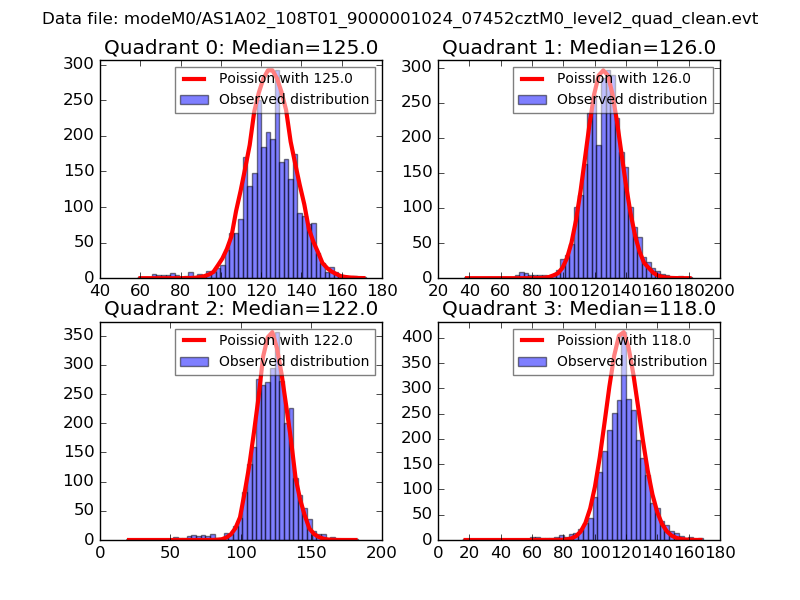 |
 |
| Quadrant-wise count rates Data is divided into 100 sec bins |
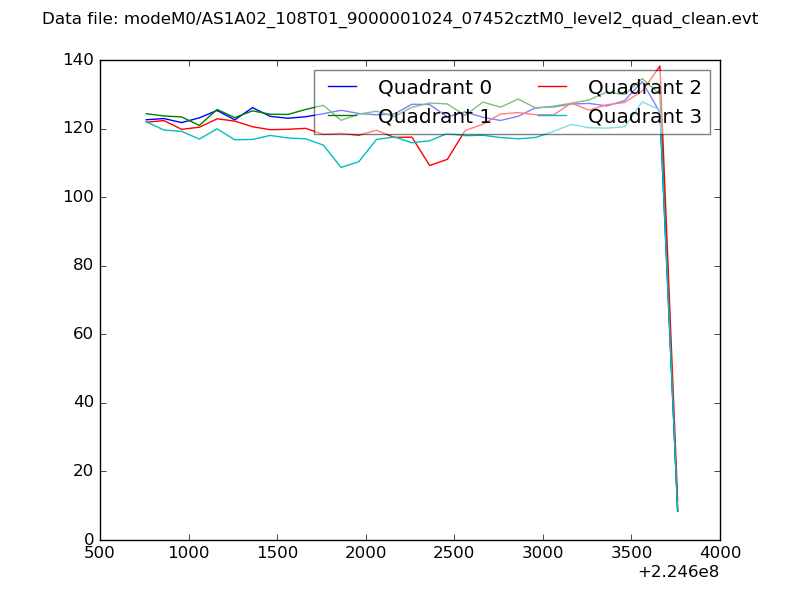 |
|
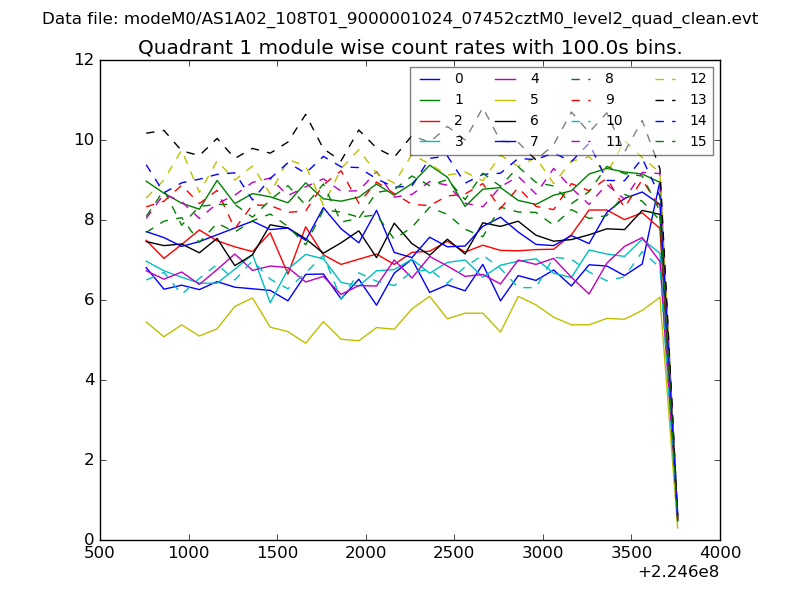
| Module-wise count rates for Quadrant A Data is divided into 100 sec bins |
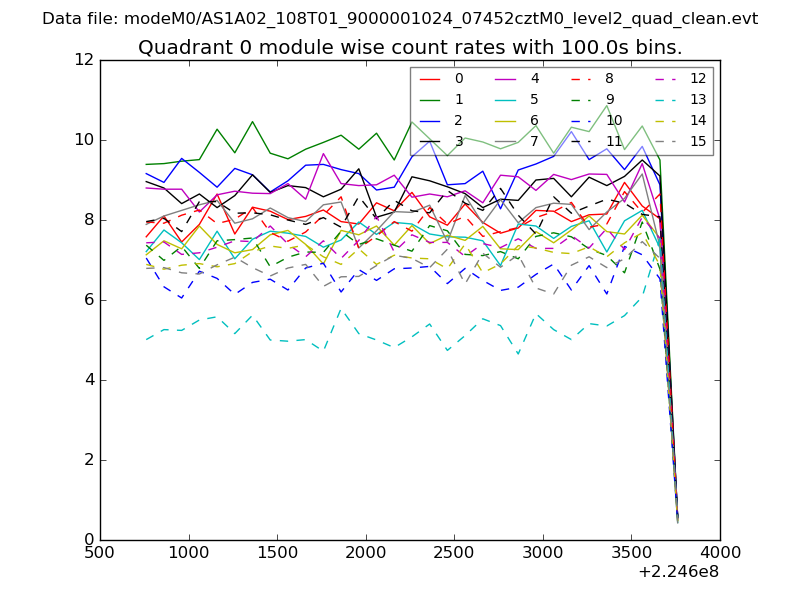 |
 |
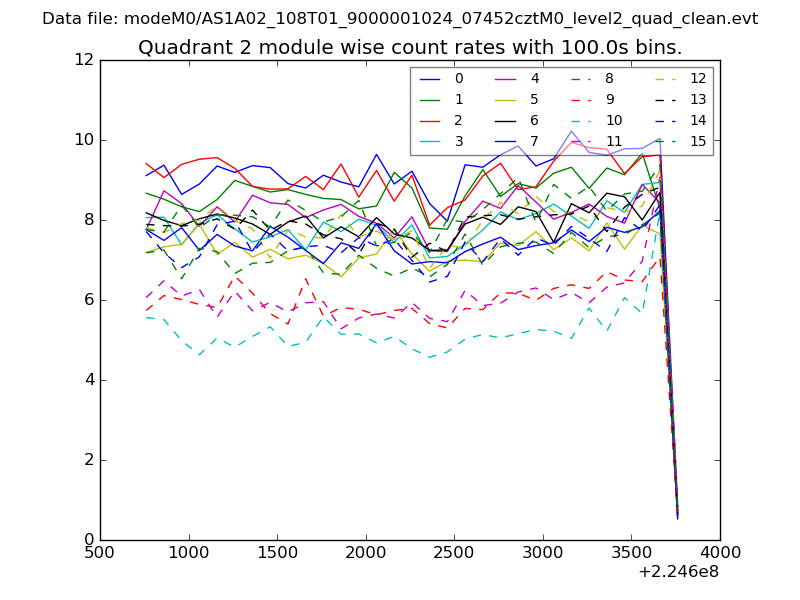
| Module-wise count rates for Quadrant B Data is divided into 100 sec bins |
 |
 |
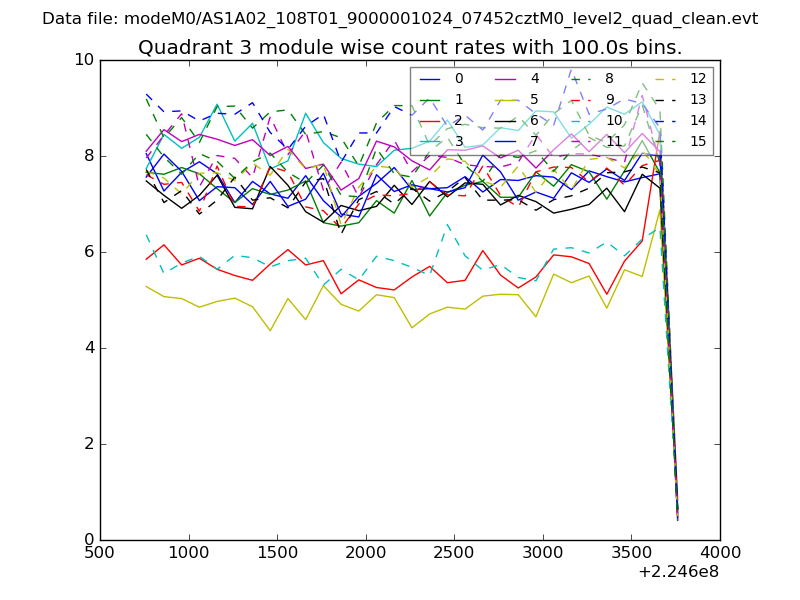
| Module-wise count rates for Quadrant C Data is divided into 100 sec bins |
 |
 |
| Module-wise count rates for Quadrant D Data is divided into 100 sec bins |
 |
 |
| Parameter | Plot |
|---|---|
| CZT HV Monitor | 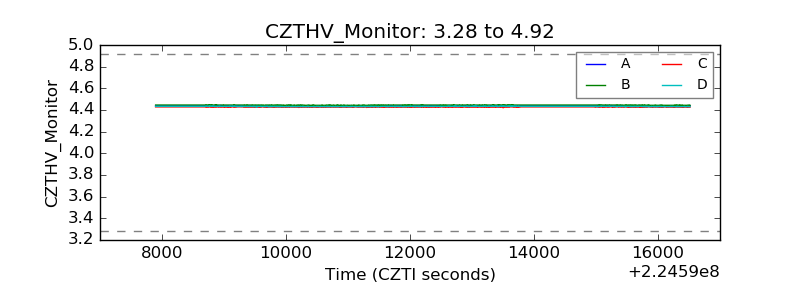 |
| D_VDD |  |
| Temperature 1 | 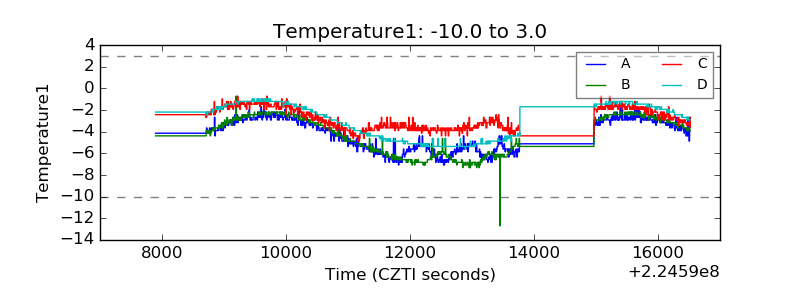 |
| Veto HV Monitor | 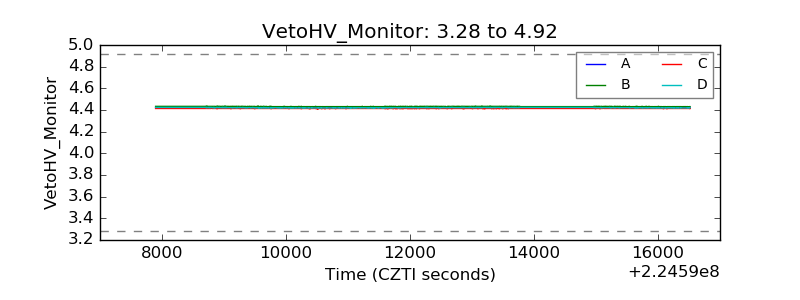 |
| Veto LLD | 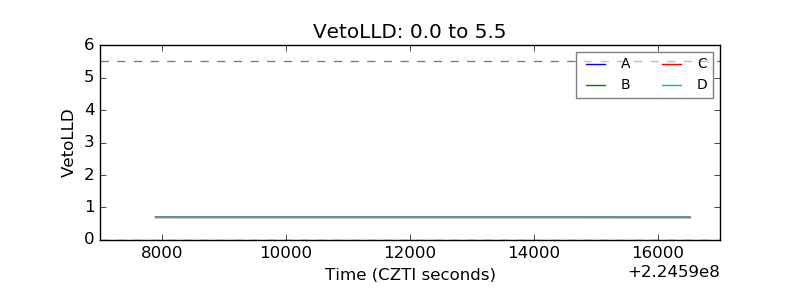 |
| Alpha Counter | 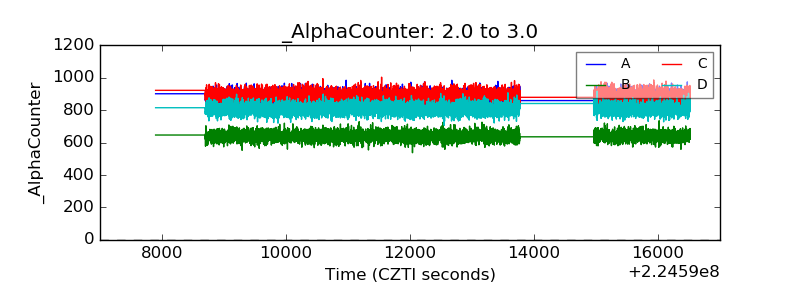 |
| _CPM_Rate | 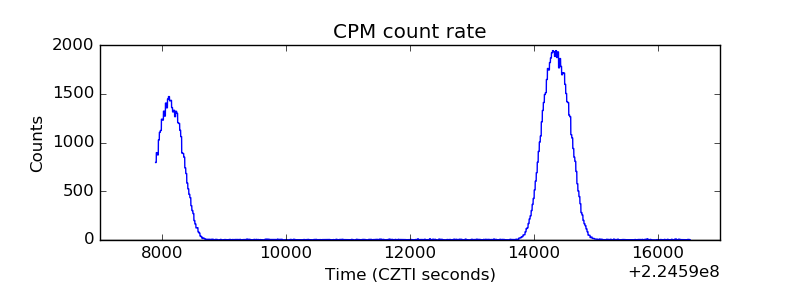 |
| CZT Counter | 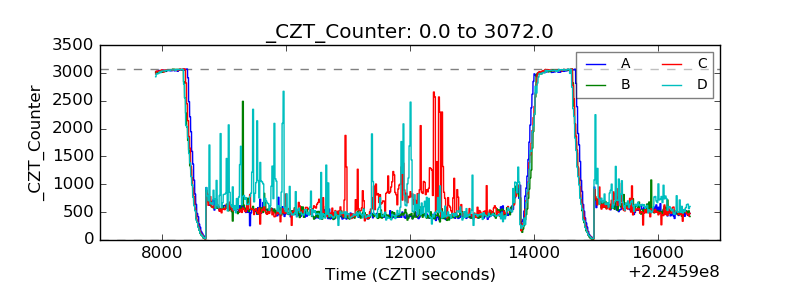 |
| +2.5 Volts monitor |  |
| +5 Volts monitor |  |
| _ROLL_ROT | 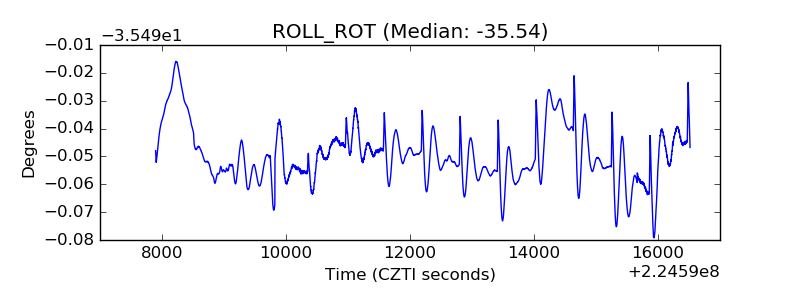 |
| _Roll_DEC | 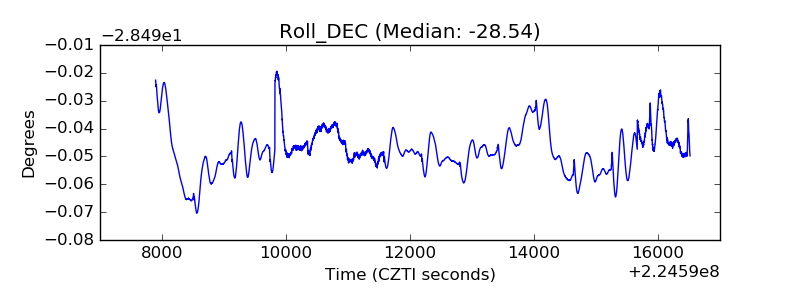 |
| _Roll_RA | 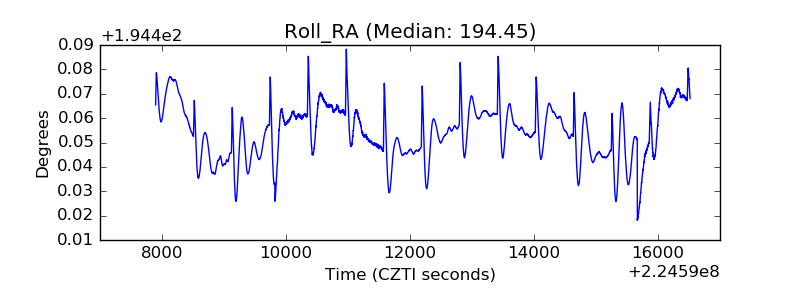 |
| Veto Counter | 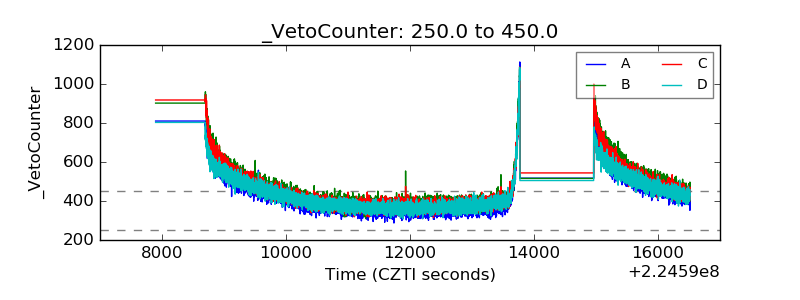 |