| Param | Original file | Final file |
|---|---|---|
| Filename | modeM0/AS1A02_108T01_9000001024_07453cztM0_level2.evt | modeM0/AS1A02_108T01_9000001024_07453cztM0_level2_quad_clean.evt |
| Size (bytes) | 468,884,160 | 74,407,680 |
| Size | 447.2 MB | 71.0 MB |
| Events in quadrant A | 3,224,418 | 458,591 |
| Events in quadrant B | 3,321,415 | 465,196 |
| Events in quadrant C | 3,211,674 | 450,679 |
| Events in quadrant D | 4,007,220 | 431,193 |
| Mode SS | |||
|---|---|---|---|
| Quadrant | BADHDUFLAG | Total packets | Discarded packets |
| A | 0 | 130 | 0 |
| B | 0 | 130 | 0 |
| C | 0 | 130 | 0 |
| D | 0 | 130 | 0 |
| Mode M9 | |||
|---|---|---|---|
| Quadrant | BADHDUFLAG | Total packets | Discarded packets |
| A | 0 | 19 | 0 |
| B | 0 | 19 | 0 |
| C | 0 | 19 | 0 |
| D | 0 | 20 | 0 |
| Mode M0 | |||
|---|---|---|---|
| Quadrant | BADHDUFLAG | Total packets | Discarded packets |
| A | 0 | 13761 | 3 |
| B | 0 | 14016 | 2 |
| C | 0 | 13774 | 2 |
| D | 0 | 16555 | 2 |
| Quadrant | Total seconds | Saturated seconds | Saturation percentage |
|---|---|---|---|
| A | 6413 | 84 | 1.309839% |
| B | 6413 | 79 | 1.231873% |
| C | 6413 | 51 | 0.795260% |
| D | 6413 | 129 | 2.011539% |
Noise dominated data is calculated using 1-second bins in cleaned event files. If a bin has >2000 counts, and if more than 50% of those come from <1% of pixels, then it is considered to be noise-dominated and hence unusable.
| Quadrant | # 1 sec bins | Bins with >0 counts | Bins with >2000 counts | High rate bins dominated by noise | Noise dominated (total time) | Noise dominated (detector-on time) | Marked lightcurve |
|---|---|---|---|---|---|---|---|
| A | 7683 | 6414 | 0 | 0 | 0.00% | 0.00% | 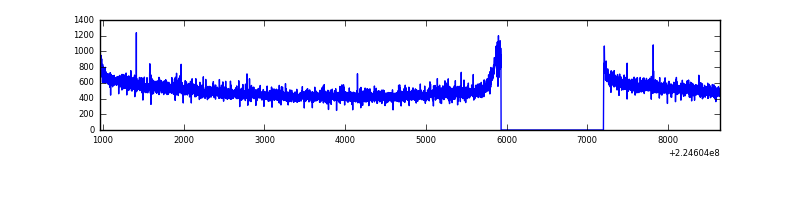 |
| B | 7683 | 6414 | 1 | 1 | 0.01% | 0.02% | 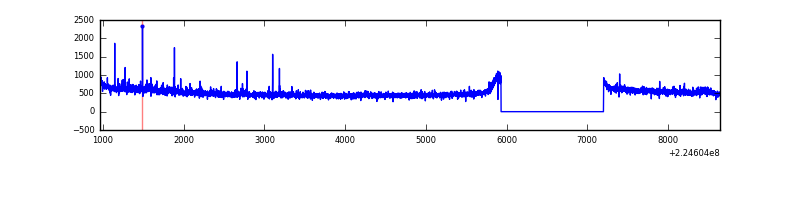 |
| C | 7683 | 6414 | 0 | 0 | 0.00% | 0.00% | 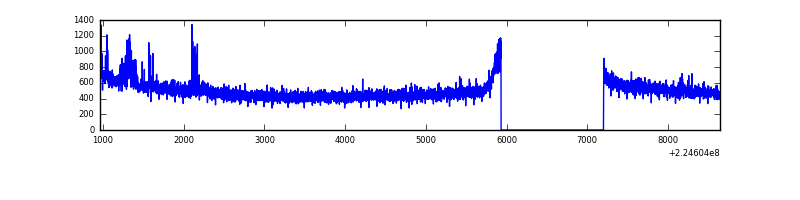 |
| D | 7683 | 6414 | 39 | 39 | 0.51% | 0.61% | 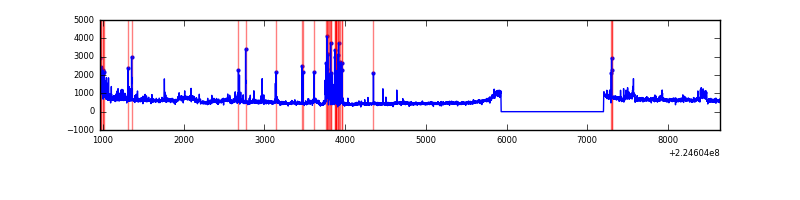 |
Top three noisy pixels from each quadrant. If the there are fewer than three noisy pixels in the level2.evt file, extra rows are filled as -1
| Pixel properties | Quadrant properties | ||||||
|---|---|---|---|---|---|---|---|
| Quadrant | DetID | PixID | Counts | Sigma | Mean | Median | Sigma |
| A | 0 | 226 | 8153 | 44.13 | 833 | 817 | 166.2 |
| A | 0 | 128 | 7443 | 39.86 | 833 | 817 | 166.2 |
| A | 12 | 194 | 7115 | 37.88 | 833 | 817 | 166.2 |
| B | 0 | 214 | 63993 | 402.9 | 838 | 821 | 156.8 |
| B | 12 | 111 | 15533 | 93.83 | 838 | 821 | 156.8 |
| B | 11 | 111 | 12571 | 74.94 | 838 | 821 | 156.8 |
| C | 9 | 68 | 87354 | 471.44 | 800 | 804 | 183.6 |
| C | 13 | 61 | 6273 | 29.79 | 800 | 804 | 183.6 |
| C | 1 | 16 | 4284 | 18.96 | 800 | 804 | 183.6 |
| D | 1 | 20 | 342427 | 1759.69 | 795 | 770 | 194.2 |
| D | 12 | 221 | 183239 | 939.8 | 795 | 770 | 194.2 |
| D | 13 | 105 | 118195 | 604.79 | 795 | 770 | 194.2 |
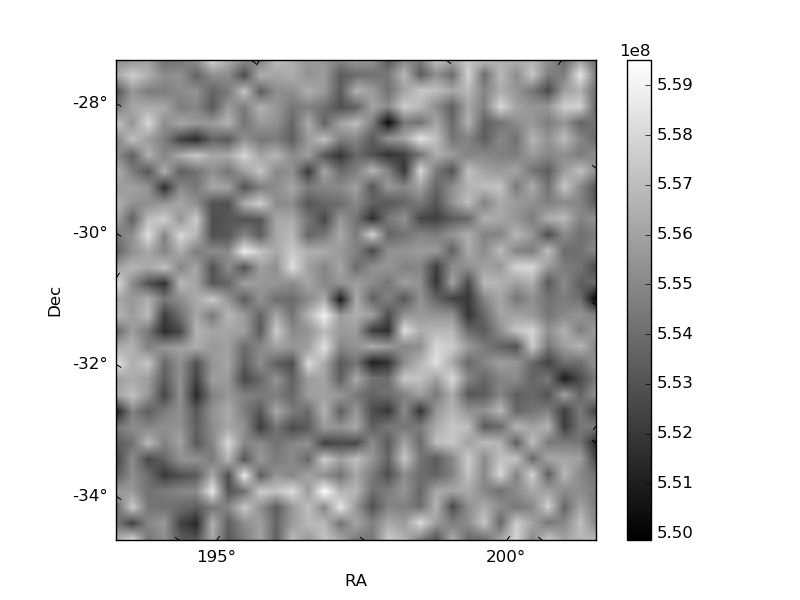
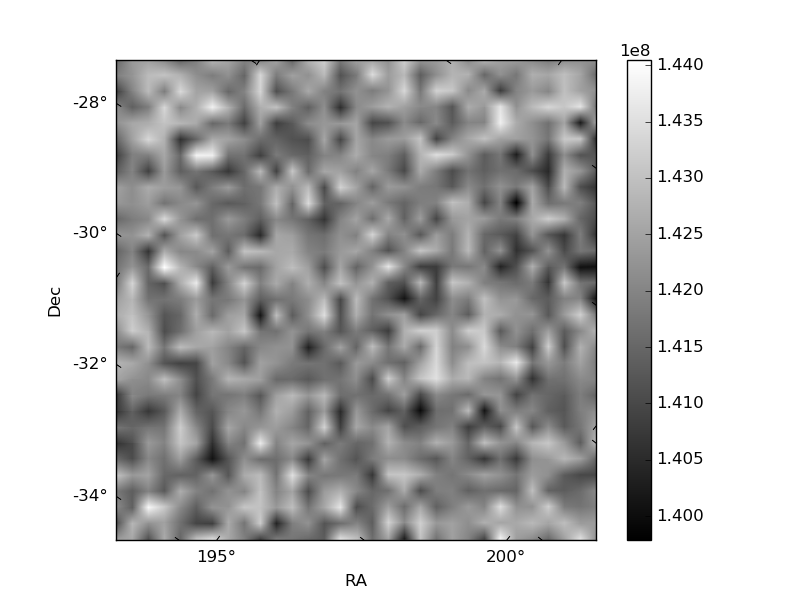
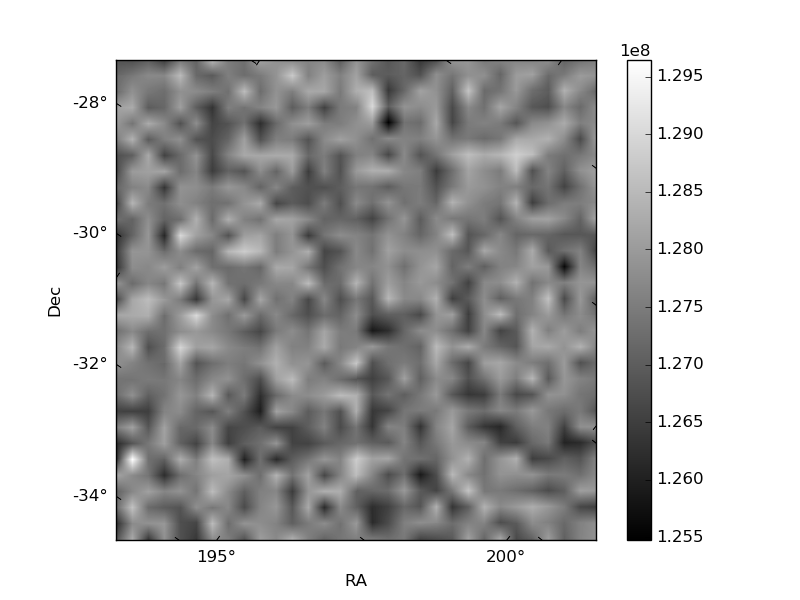
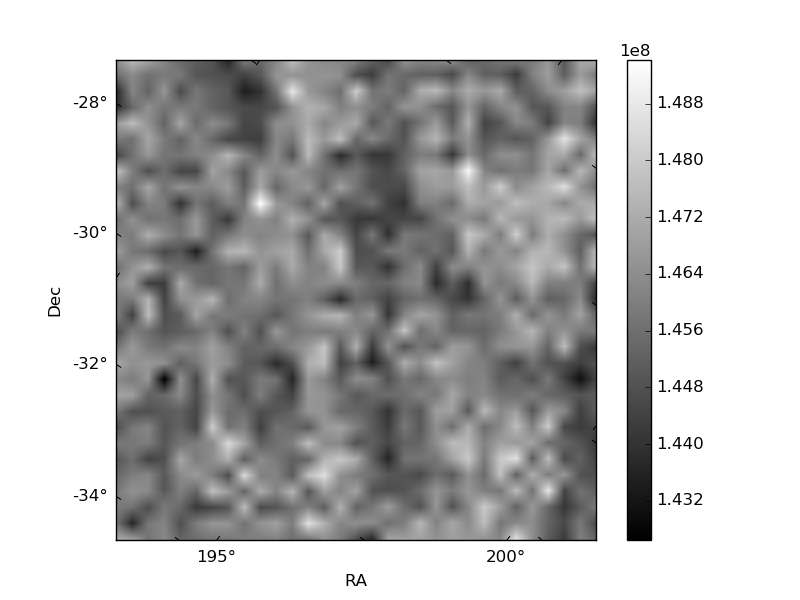
Histogram calculated using DETX and DETY for each event in the final _common_clean file
| Quadrant A | 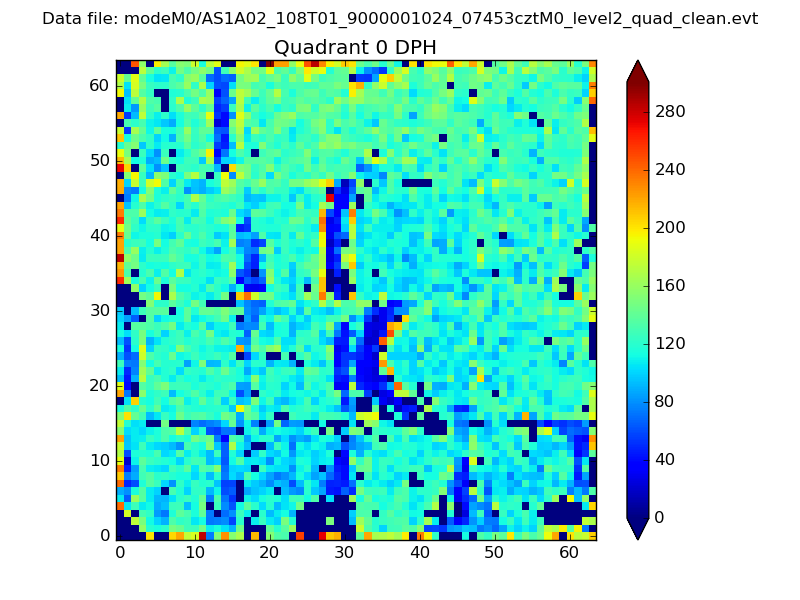 |
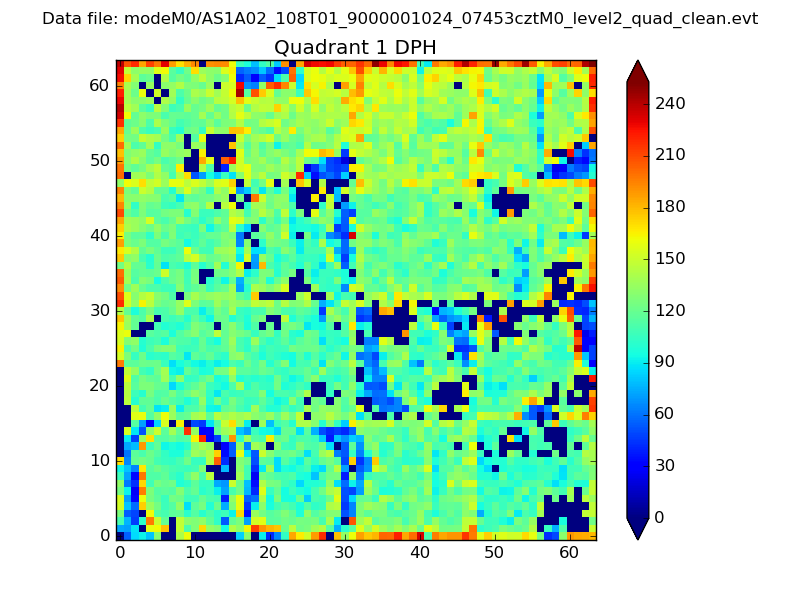 |
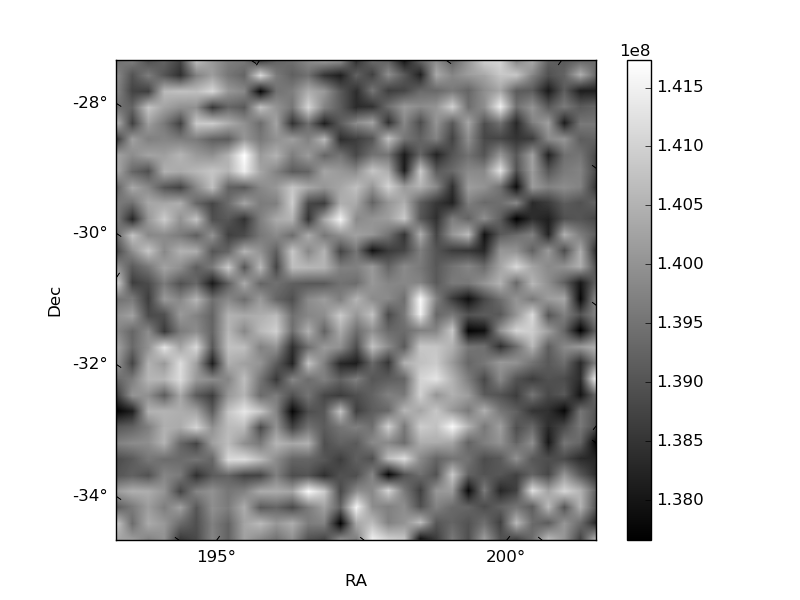
Quadrant B |
|---|---|---|---|
| Quadrant D | 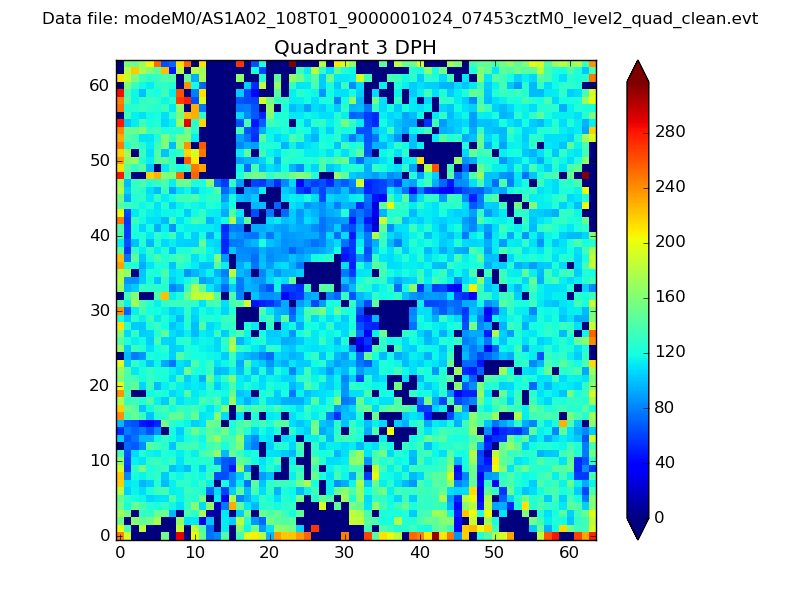 |
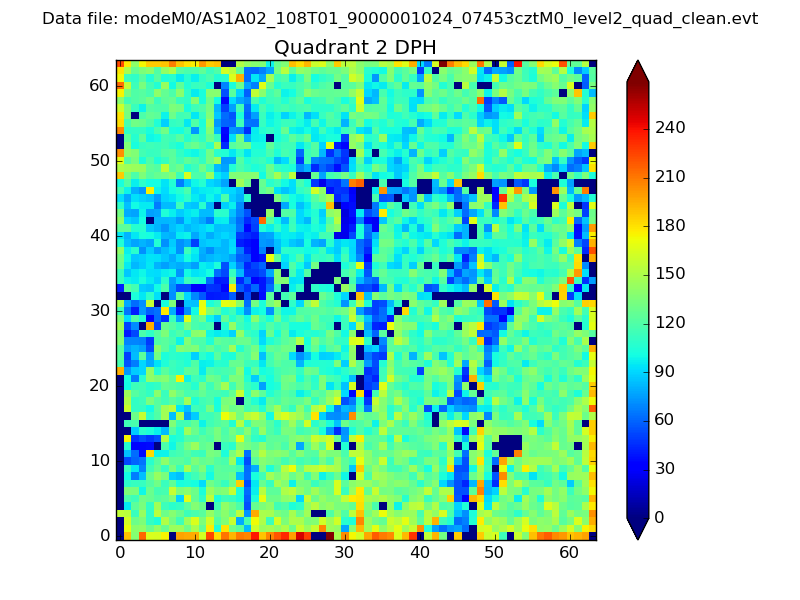 |
Quadrant C |
| Plot type | Count rate plots | Images |
|---|---|---|
| Comparison with Poisson distribution Blue bars denote a histogram of data divided into 1 sec bins. Red curve is a Poisson curve with rate = median count rate of data. |
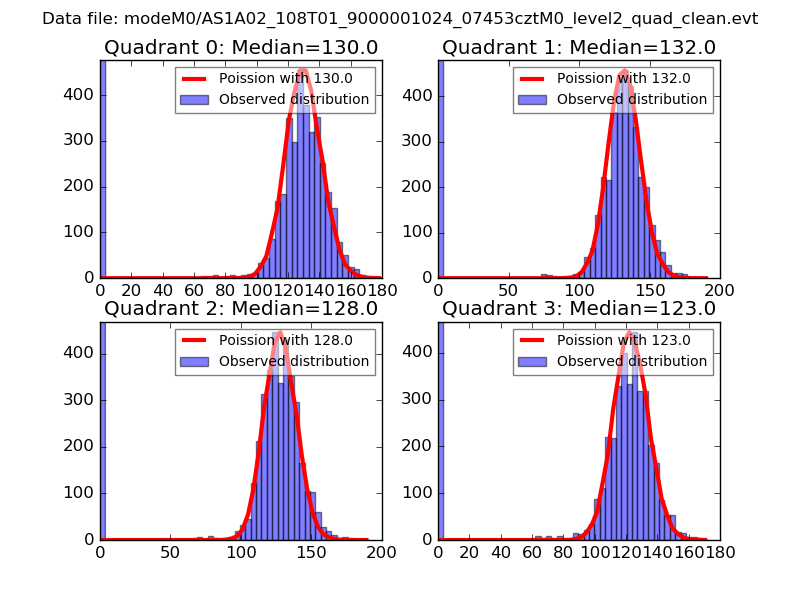 |
 |
| Quadrant-wise count rates Data is divided into 100 sec bins |
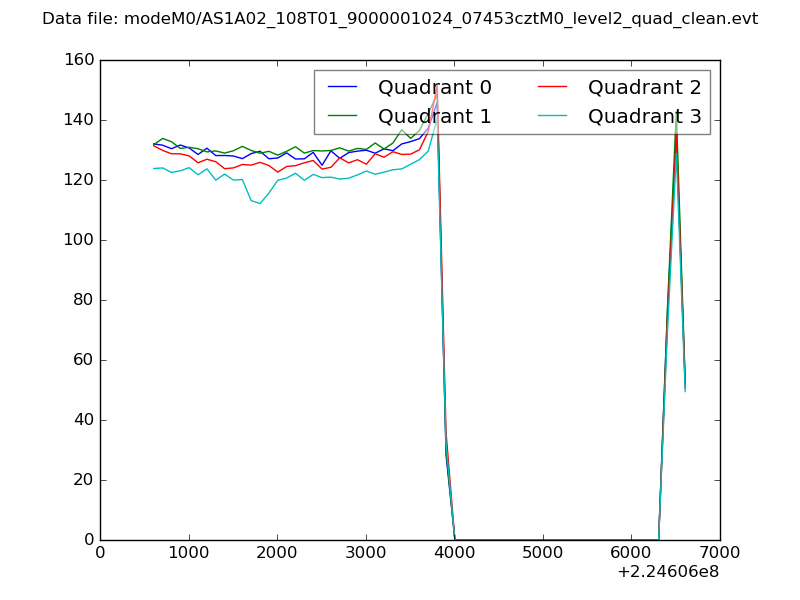 |
|
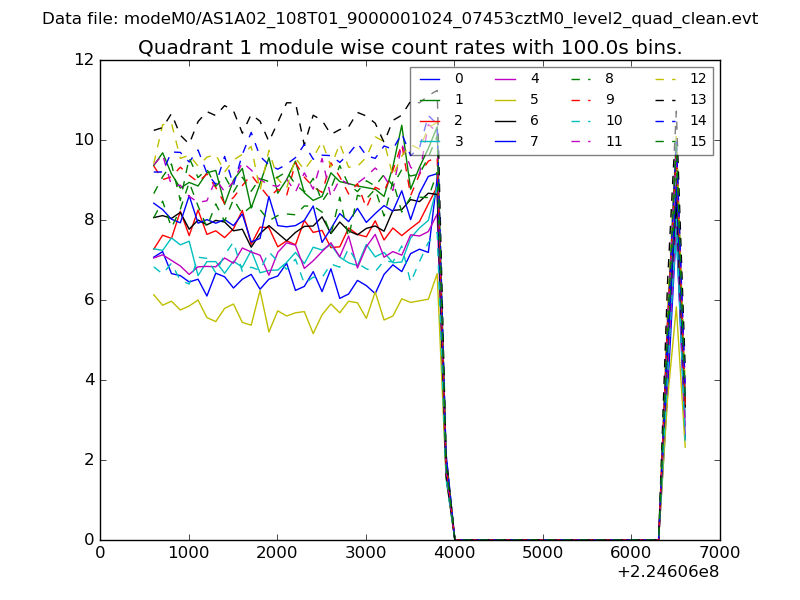
| Module-wise count rates for Quadrant A Data is divided into 100 sec bins |
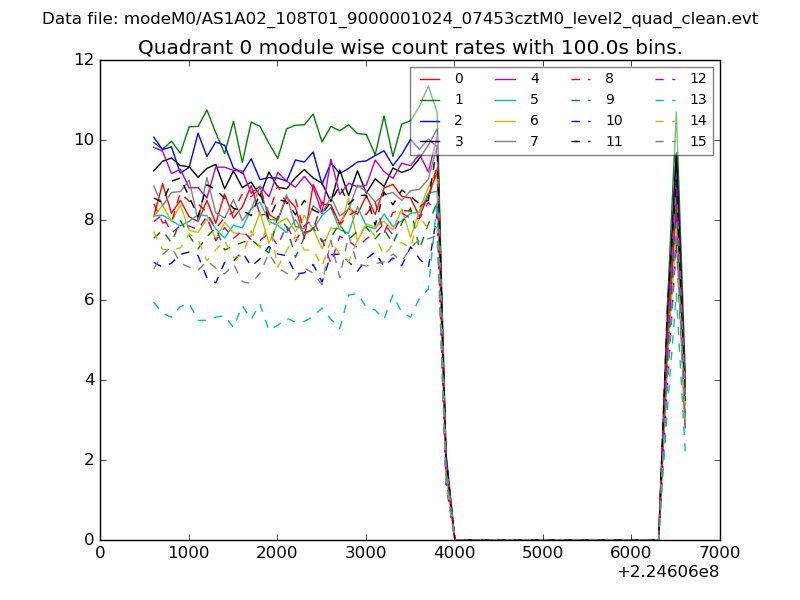 |
 |
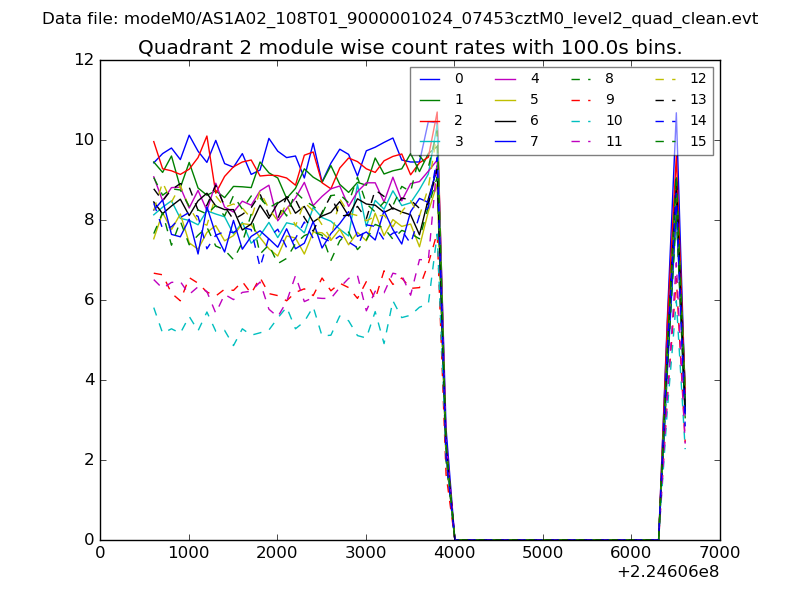
| Module-wise count rates for Quadrant B Data is divided into 100 sec bins |
 |
 |
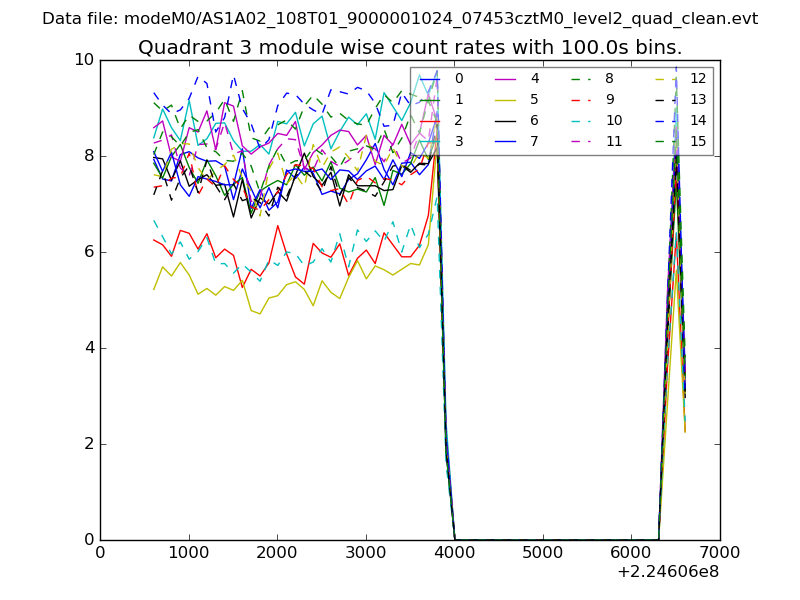
| Module-wise count rates for Quadrant C Data is divided into 100 sec bins |
 |
 |
| Module-wise count rates for Quadrant D Data is divided into 100 sec bins |
 |
 |
| Parameter | Plot |
|---|---|
| CZT HV Monitor | 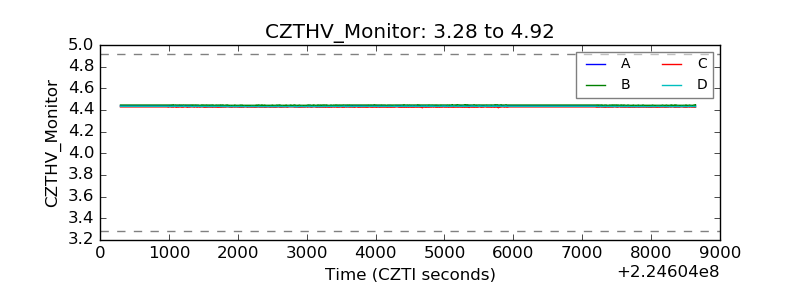 |
| D_VDD |  |
| Temperature 1 | 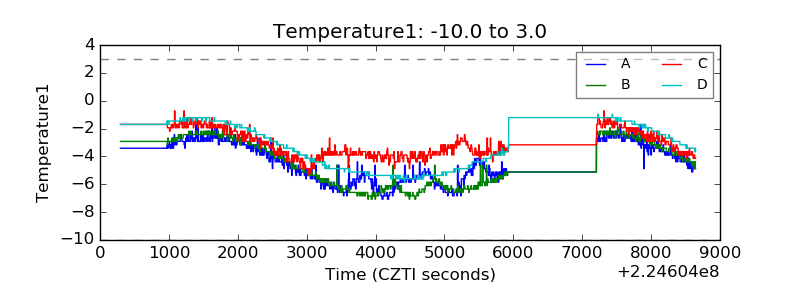 |
| Veto HV Monitor | 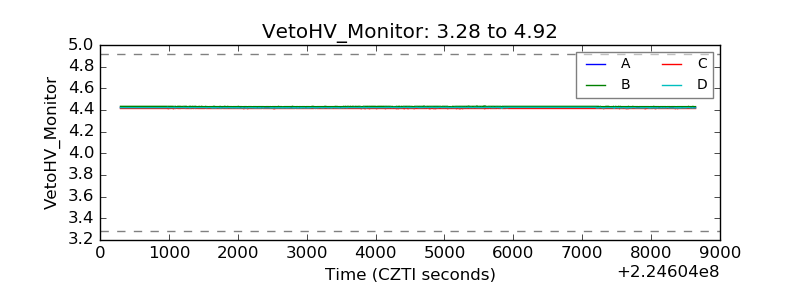 |
| Veto LLD | 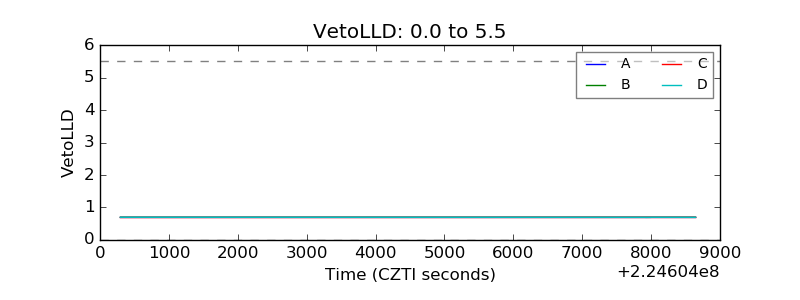 |
| Alpha Counter | 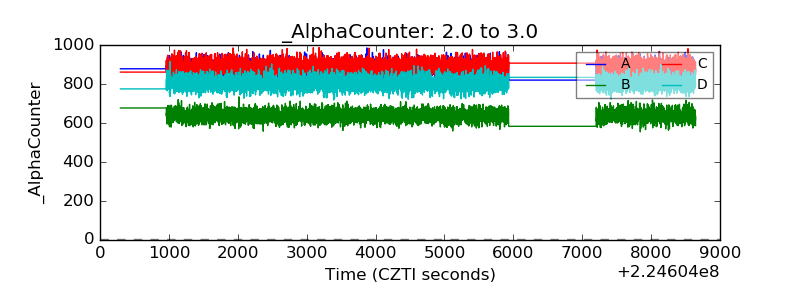 |
| _CPM_Rate | 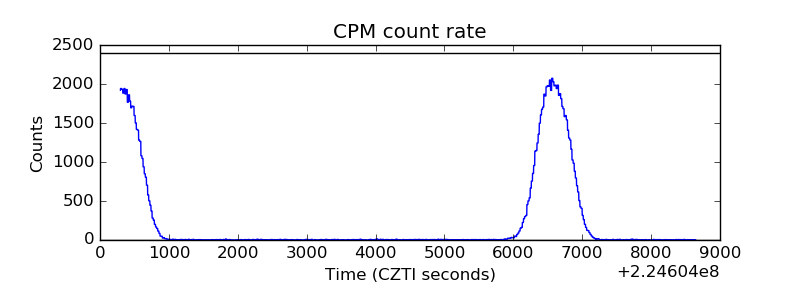 |
| CZT Counter | 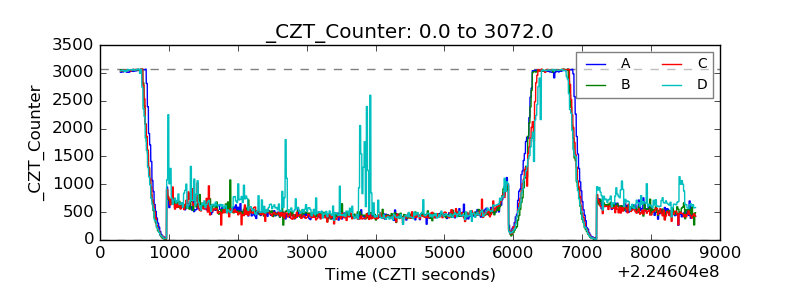 |
| +2.5 Volts monitor | 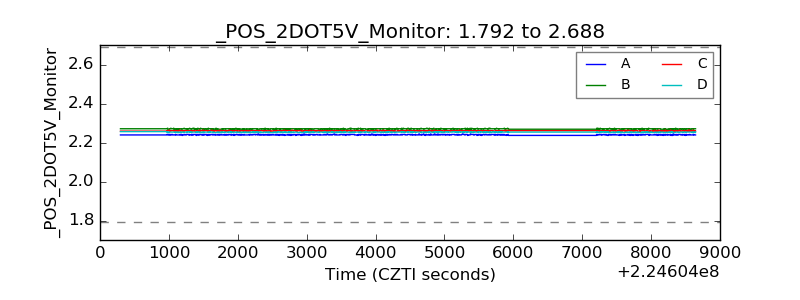 |
| +5 Volts monitor |  |
| _ROLL_ROT | 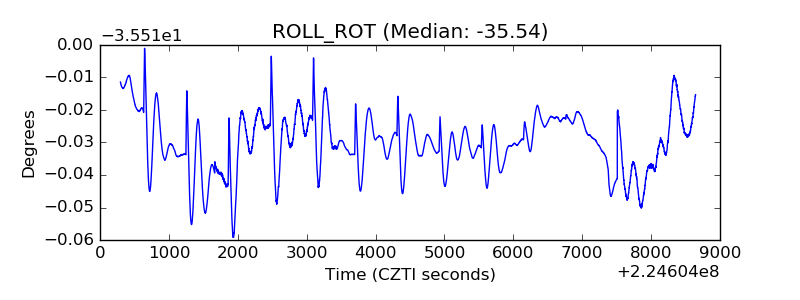 |
| _Roll_DEC | 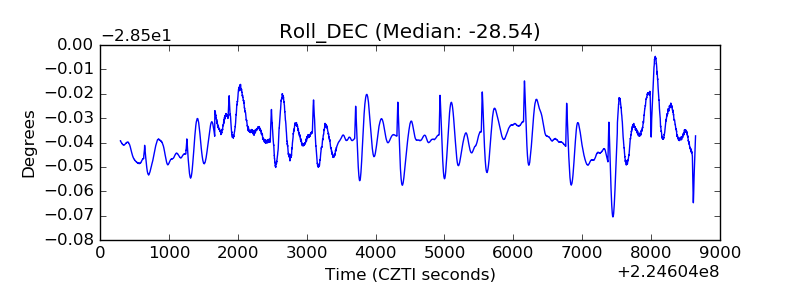 |
| _Roll_RA | 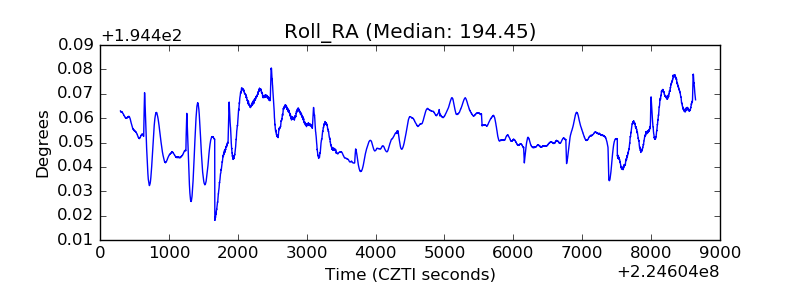 |
| Veto Counter | 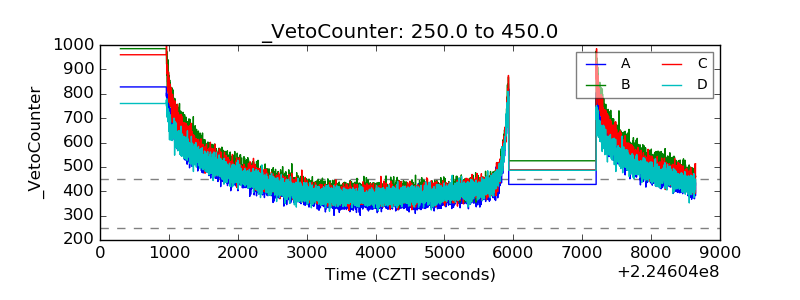 |