| Param | Original file | Final file |
|---|---|---|
| Filename | modeM0/AS1A02_108T01_9000001024_07454cztM0_level2.evt | modeM0/AS1A02_108T01_9000001024_07454cztM0_level2_quad_clean.evt |
| Size (bytes) | 407,540,160 | 82,851,840 |
| Size | 388.7 MB | 79.0 MB |
| Events in quadrant A | 2,891,943 | 533,269 |
| Events in quadrant B | 2,947,562 | 545,459 |
| Events in quadrant C | 2,826,793 | 523,924 |
| Events in quadrant D | 3,277,809 | 497,047 |
| Mode SS | |||
|---|---|---|---|
| Quadrant | BADHDUFLAG | Total packets | Discarded packets |
| A | 0 | 118 | 0 |
| B | 0 | 118 | 0 |
| C | 0 | 118 | 0 |
| D | 0 | 118 | 0 |
| Mode M9 | |||
|---|---|---|---|
| Quadrant | BADHDUFLAG | Total packets | Discarded packets |
| A | 0 | 13 | 0 |
| B | 0 | 13 | 0 |
| C | 0 | 13 | 0 |
| D | 0 | 13 | 0 |
| Mode M0 | |||
|---|---|---|---|
| Quadrant | BADHDUFLAG | Total packets | Discarded packets |
| A | 0 | 12321 | 2 |
| B | 0 | 12383 | 1 |
| C | 0 | 12209 | 1 |
| D | 0 | 13774 | 1 |
| Quadrant | Total seconds | Saturated seconds | Saturation percentage |
|---|---|---|---|
| A | 5858 | 89 | 1.519290% |
| B | 5858 | 90 | 1.536361% |
| C | 5858 | 64 | 1.092523% |
| D | 5858 | 93 | 1.587573% |
Noise dominated data is calculated using 1-second bins in cleaned event files. If a bin has >2000 counts, and if more than 50% of those come from <1% of pixels, then it is considered to be noise-dominated and hence unusable.
| Quadrant | # 1 sec bins | Bins with >0 counts | Bins with >2000 counts | High rate bins dominated by noise | Noise dominated (total time) | Noise dominated (detector-on time) | Marked lightcurve |
|---|---|---|---|---|---|---|---|
| A | 7143 | 5859 | 0 | 0 | 0.00% | 0.00% | 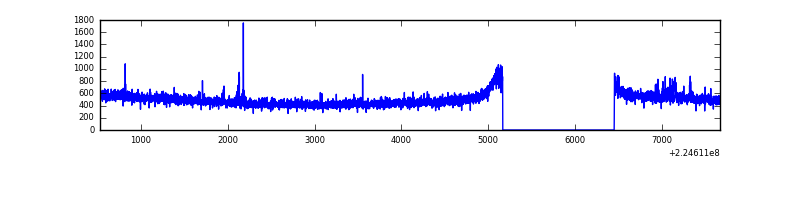 |
| B | 7143 | 5859 | 1 | 1 | 0.01% | 0.02% | 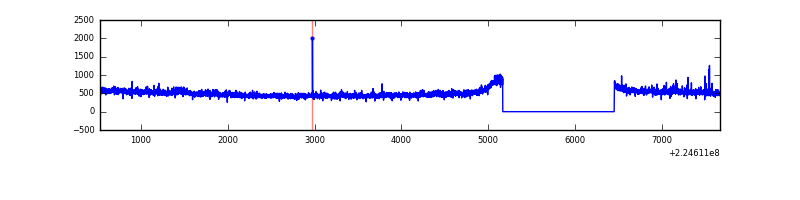 |
| C | 7143 | 5859 | 0 | 0 | 0.00% | 0.00% | 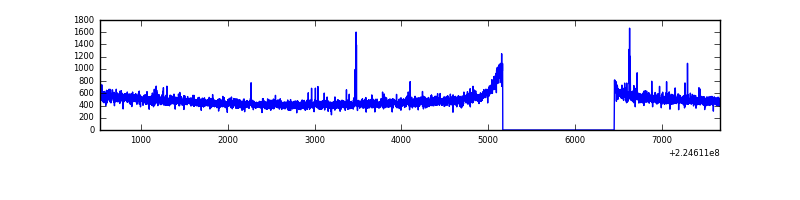 |
| D | 7143 | 5859 | 26 | 26 | 0.36% | 0.44% | 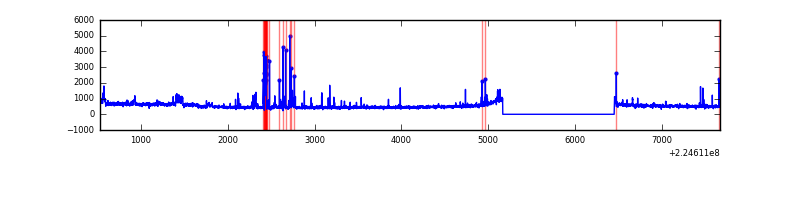 |
Top three noisy pixels from each quadrant. If the there are fewer than three noisy pixels in the level2.evt file, extra rows are filled as -1
| Pixel properties | Quadrant properties | ||||||
|---|---|---|---|---|---|---|---|
| Quadrant | DetID | PixID | Counts | Sigma | Mean | Median | Sigma |
| A | 0 | 128 | 30474 | 199.0 | 742 | 728 | 149.5 |
| A | 0 | 226 | 7196 | 43.27 | 742 | 728 | 149.5 |
| A | 12 | 194 | 6534 | 38.84 | 742 | 728 | 149.5 |
| B | 0 | 214 | 28837 | 198.42 | 751 | 733 | 141.6 |
| B | 12 | 111 | 14280 | 95.64 | 751 | 733 | 141.6 |
| B | 11 | 111 | 11167 | 73.67 | 751 | 733 | 141.6 |
| C | 9 | 68 | 27339 | 160.54 | 716 | 722 | 165.8 |
| C | 13 | 61 | 5599 | 29.42 | 716 | 722 | 165.8 |
| C | 1 | 16 | 5372 | 28.05 | 716 | 722 | 165.8 |
| D | 1 | 20 | 195719 | 1127.99 | 708 | 686 | 172.9 |
| D | 12 | 221 | 181436 | 1045.38 | 708 | 686 | 172.9 |
| D | 2 | 14 | 144582 | 832.24 | 708 | 686 | 172.9 |
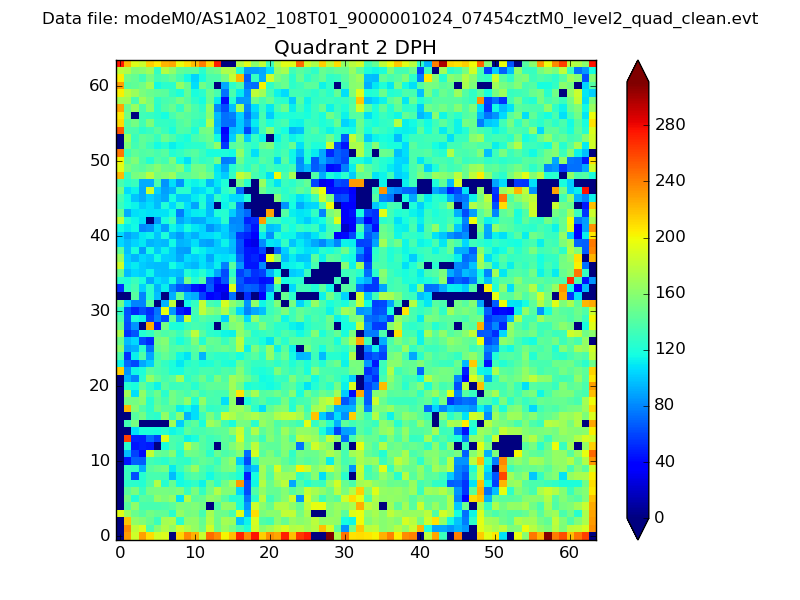
Histogram calculated using DETX and DETY for each event in the final _common_clean file
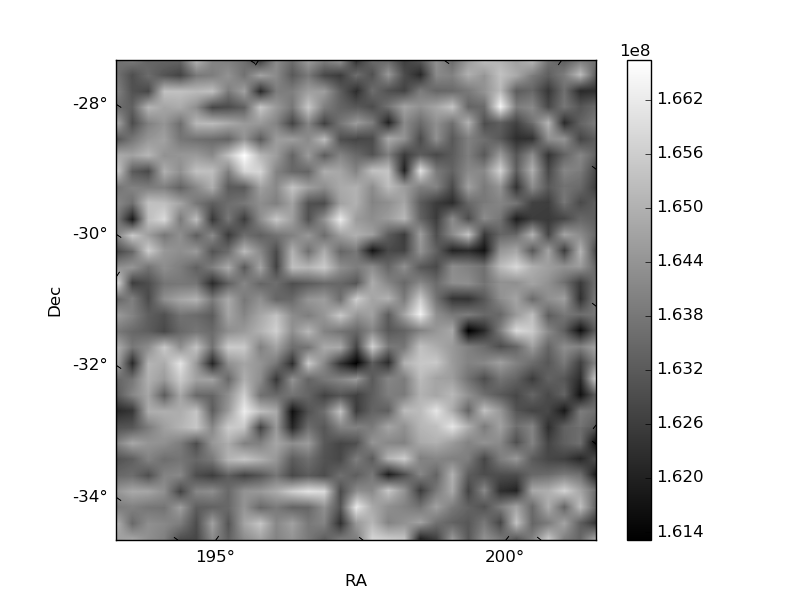
| Quadrant A | 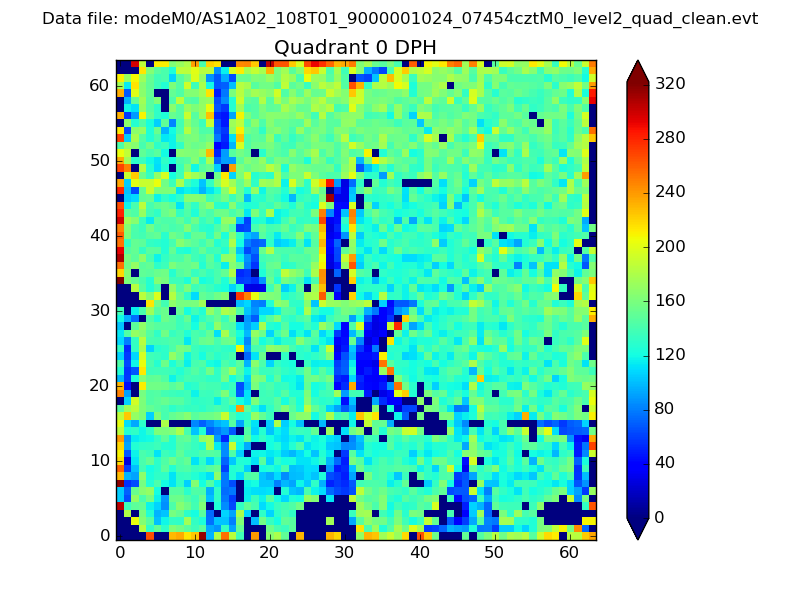 |
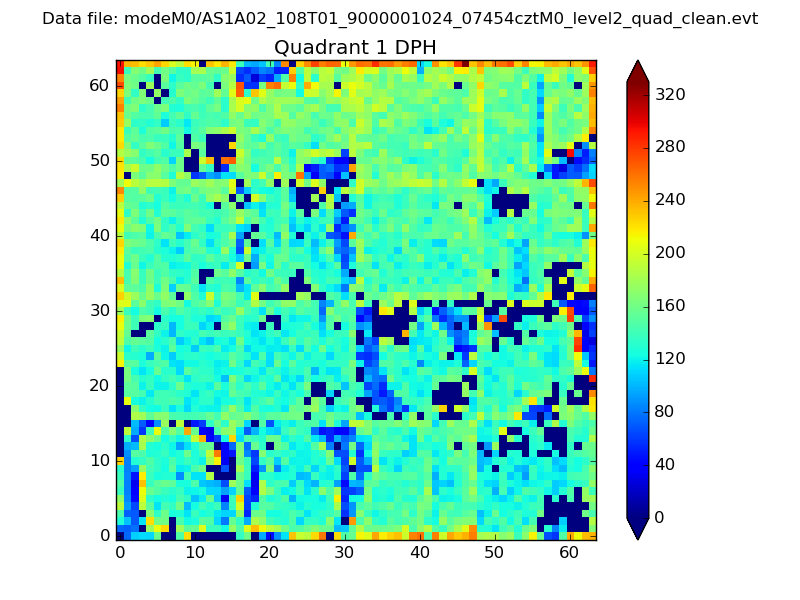 |
Quadrant B |
|---|---|---|---|
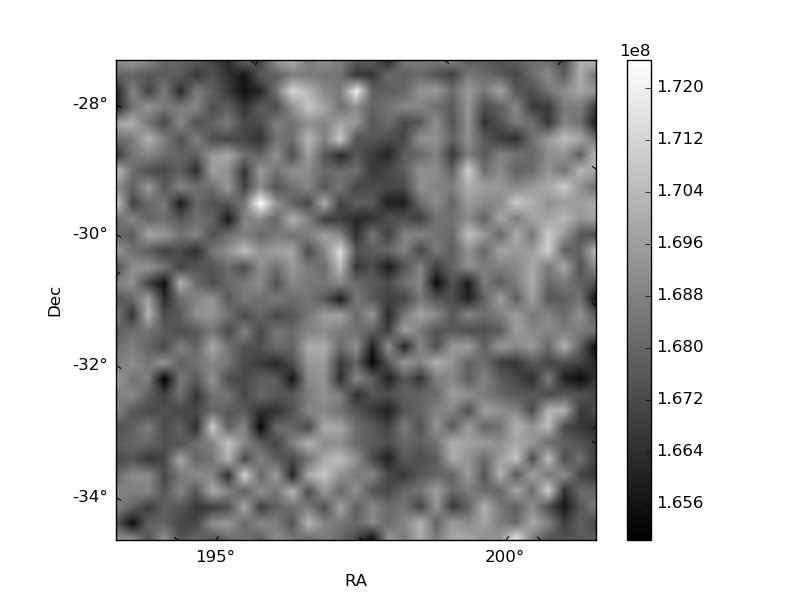
| Quadrant D | 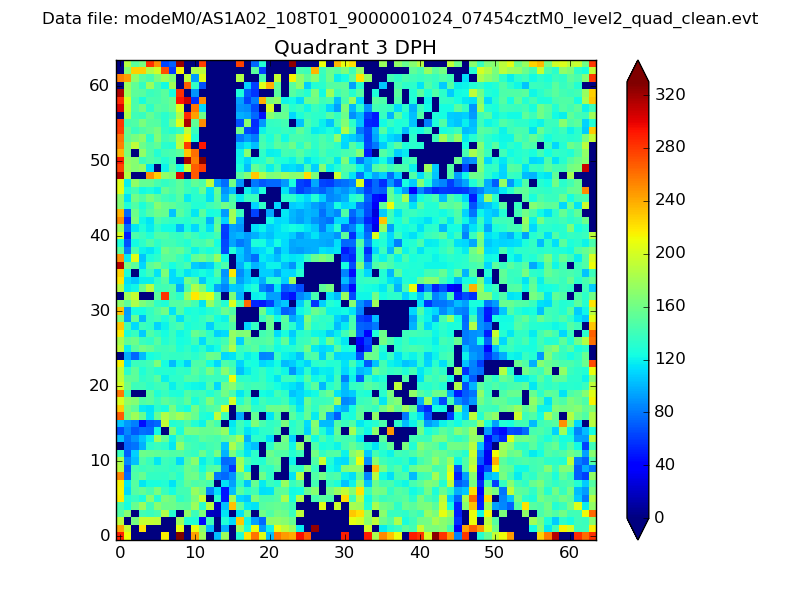 |
 |
Quadrant C |
| Plot type | Count rate plots | Images |
|---|---|---|
| Comparison with Poisson distribution Blue bars denote a histogram of data divided into 1 sec bins. Red curve is a Poisson curve with rate = median count rate of data. |
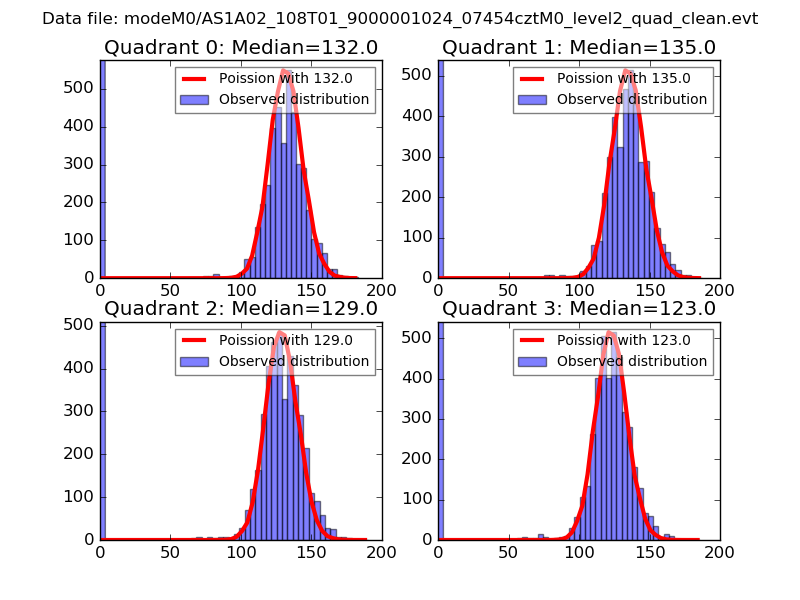 |
 |
| Quadrant-wise count rates Data is divided into 100 sec bins |
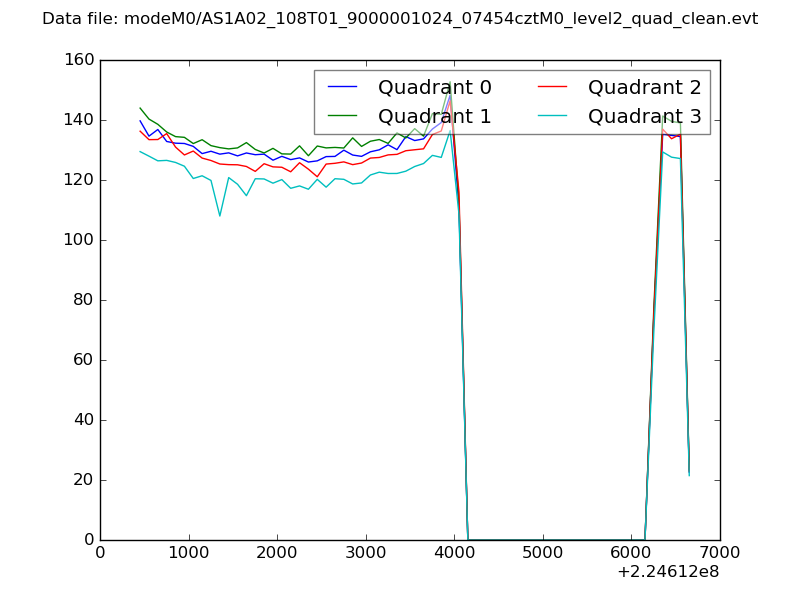 |
|
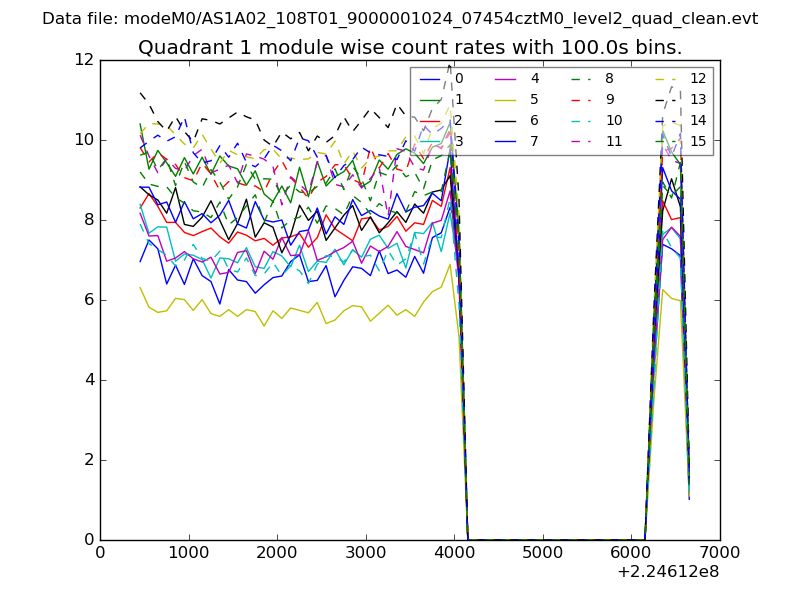
| Module-wise count rates for Quadrant A Data is divided into 100 sec bins |
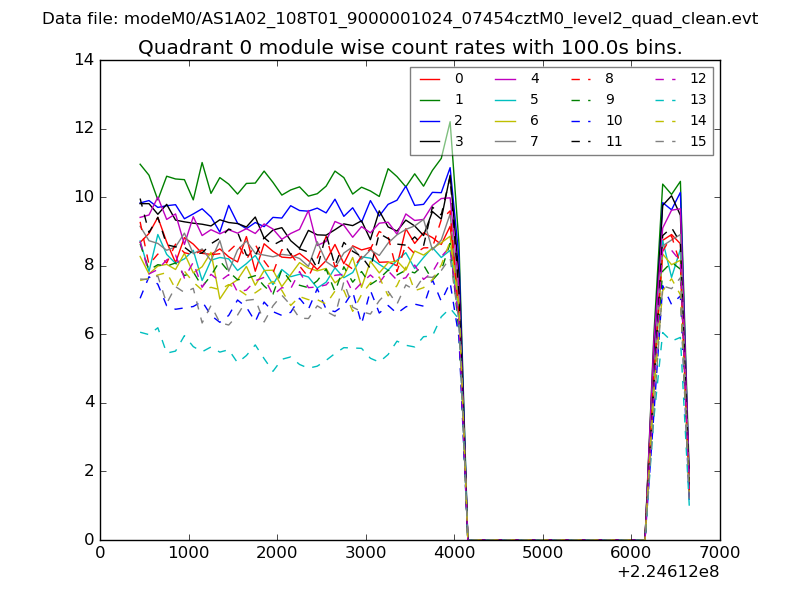 |
 |
| Module-wise count rates for Quadrant B Data is divided into 100 sec bins |
 |
 |
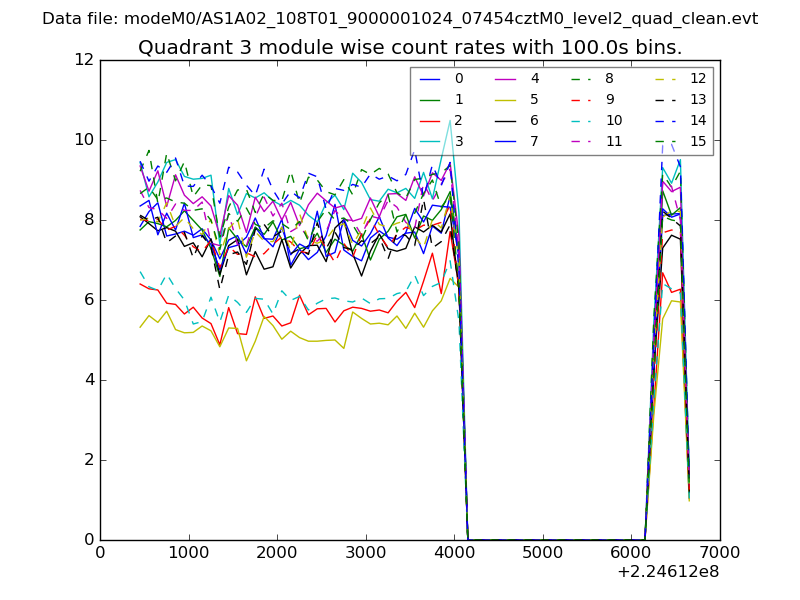
| Module-wise count rates for Quadrant C Data is divided into 100 sec bins |
 |
 |
| Module-wise count rates for Quadrant D Data is divided into 100 sec bins |
 |
 |
| Parameter | Plot |
|---|---|
| CZT HV Monitor | 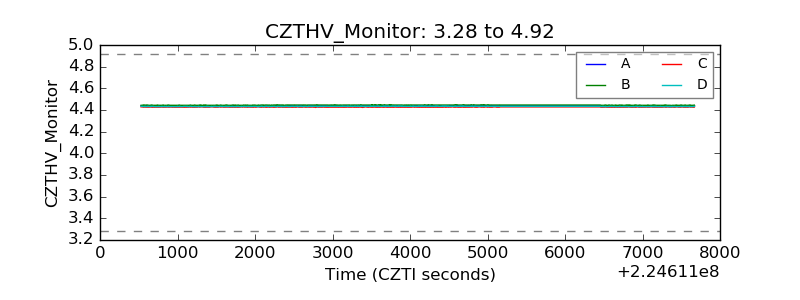 |
| D_VDD |  |
| Temperature 1 | 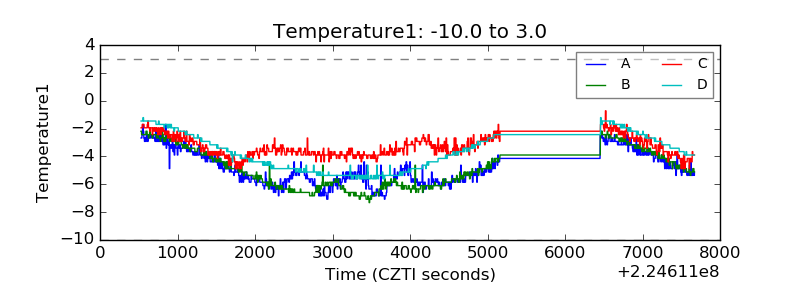 |
| Veto HV Monitor | 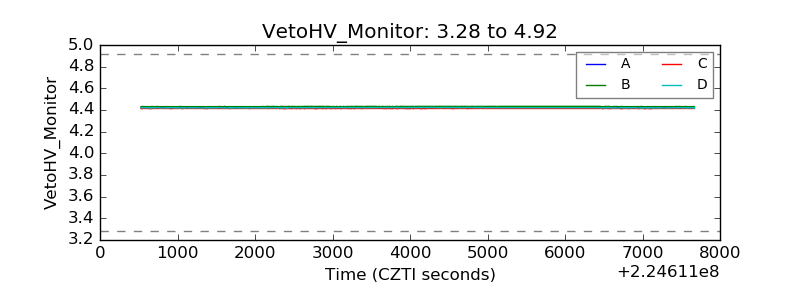 |
| Veto LLD | 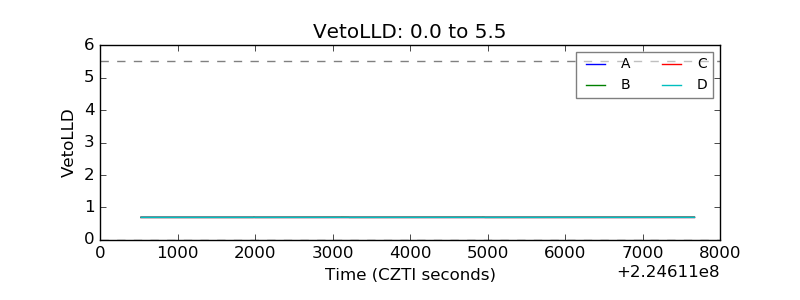 |
| Alpha Counter |  |
| _CPM_Rate | 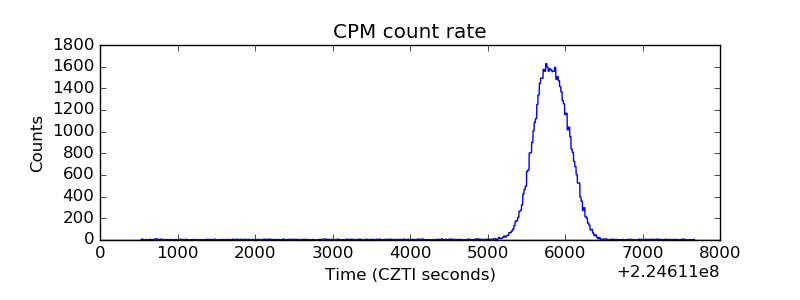 |
| CZT Counter | 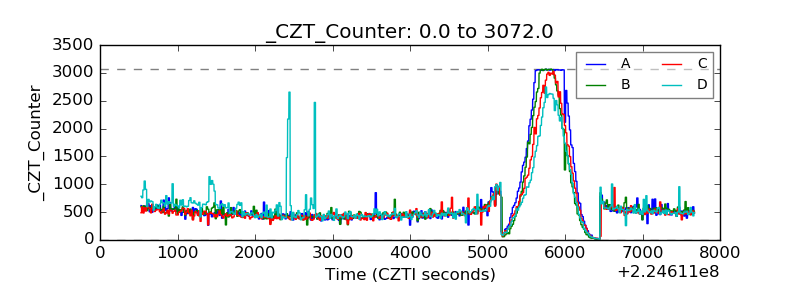 |
| +2.5 Volts monitor | 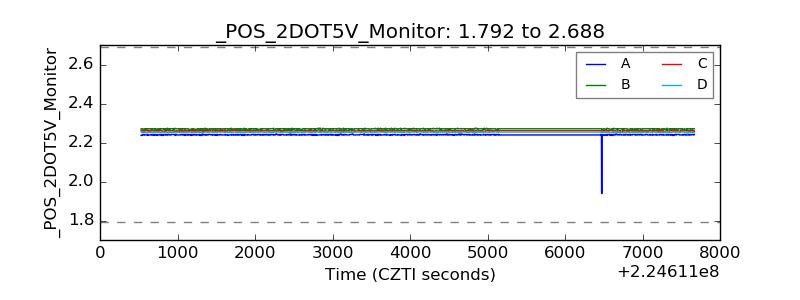 |
| +5 Volts monitor | 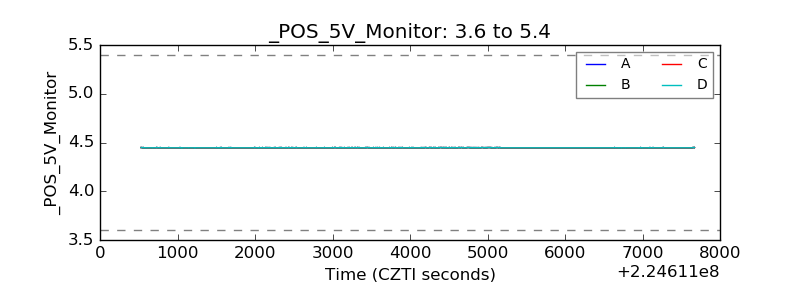 |
| _ROLL_ROT | 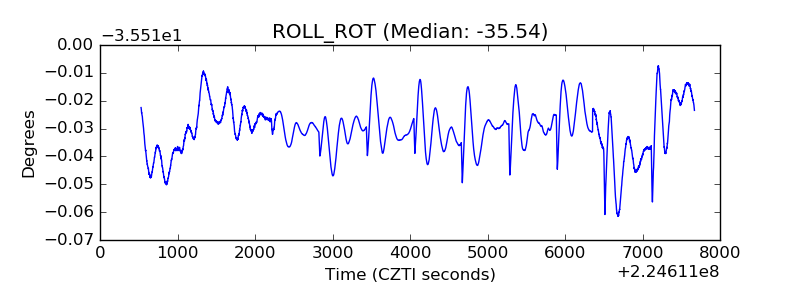 |
| _Roll_DEC | 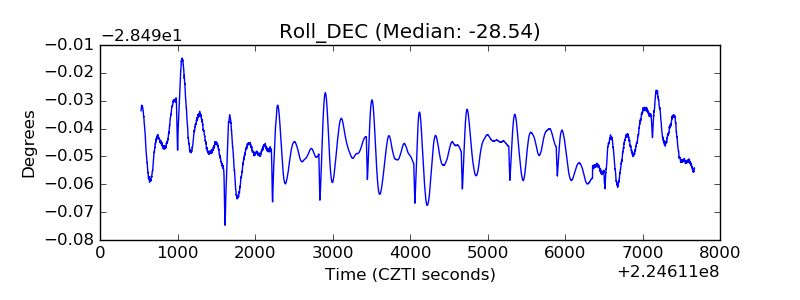 |
| _Roll_RA |  |
| Veto Counter | 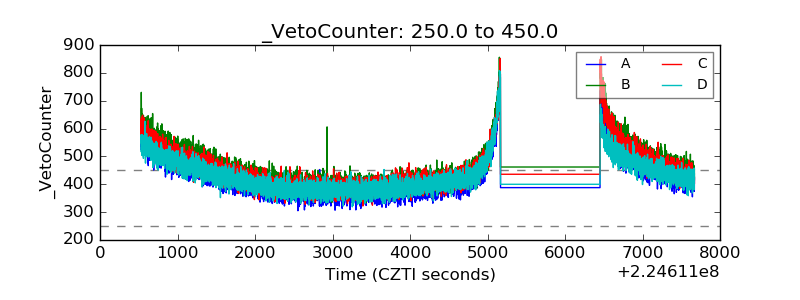 |