| Param | Original file | Final file |
|---|---|---|
| Filename | modeM0/AS1A02_108T01_9000001024_07455cztM0_level2.evt | modeM0/AS1A02_108T01_9000001024_07455cztM0_level2_quad_clean.evt |
| Size (bytes) | 433,825,920 | 91,365,120 |
| Size | 413.7 MB | 87.1 MB |
| Events in quadrant A | 3,063,521 | 590,588 |
| Events in quadrant B | 3,119,728 | 601,219 |
| Events in quadrant C | 2,975,264 | 582,327 |
| Events in quadrant D | 3,546,109 | 547,569 |
| Mode SS | |||
|---|---|---|---|
| Quadrant | BADHDUFLAG | Total packets | Discarded packets |
| A | 0 | 130 | 0 |
| B | 0 | 130 | 0 |
| C | 0 | 130 | 0 |
| D | 0 | 130 | 0 |
| Mode M9 | |||
|---|---|---|---|
| Quadrant | BADHDUFLAG | Total packets | Discarded packets |
| A | 0 | 21 | 0 |
| B | 0 | 21 | 0 |
| C | 0 | 21 | 0 |
| D | 0 | 22 | 0 |
| Mode M0 | |||
|---|---|---|---|
| Quadrant | BADHDUFLAG | Total packets | Discarded packets |
| A | 0 | 13332 | 3 |
| B | 0 | 13402 | 2 |
| C | 0 | 13170 | 2 |
| D | 0 | 14690 | 2 |
| Quadrant | Total seconds | Saturated seconds | Saturation percentage |
|---|---|---|---|
| A | 6378 | 49 | 0.768266% |
| B | 6378 | 59 | 0.925055% |
| C | 6378 | 21 | 0.329257% |
| D | 6378 | 120 | 1.881468% |
Noise dominated data is calculated using 1-second bins in cleaned event files. If a bin has >2000 counts, and if more than 50% of those come from <1% of pixels, then it is considered to be noise-dominated and hence unusable.
| Quadrant | # 1 sec bins | Bins with >0 counts | Bins with >2000 counts | High rate bins dominated by noise | Noise dominated (total time) | Noise dominated (detector-on time) | Marked lightcurve |
|---|---|---|---|---|---|---|---|
| A | 7643 | 6379 | 0 | 0 | 0.00% | 0.00% | 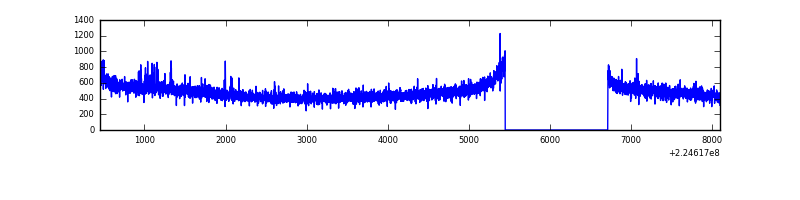 |
| B | 7643 | 6379 | 0 | 0 | 0.00% | 0.00% | 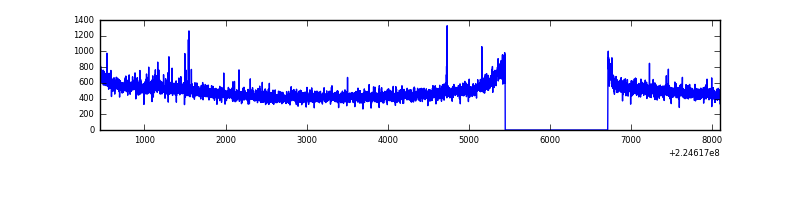 |
| C | 7643 | 6379 | 0 | 0 | 0.00% | 0.00% | 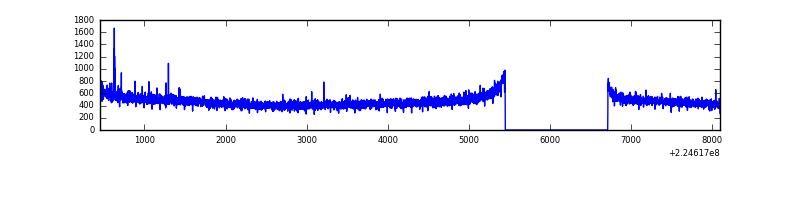 |
| D | 7643 | 6379 | 93 | 93 | 1.22% | 1.46% | 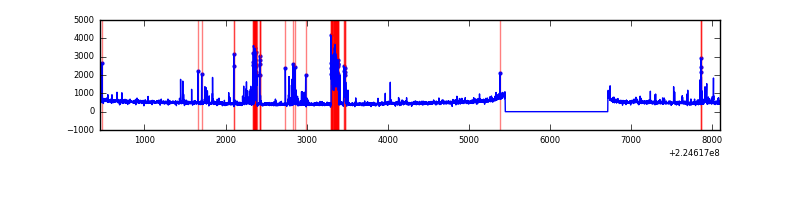 |
Top three noisy pixels from each quadrant. If the there are fewer than three noisy pixels in the level2.evt file, extra rows are filled as -1
| Pixel properties | Quadrant properties | ||||||
|---|---|---|---|---|---|---|---|
| Quadrant | DetID | PixID | Counts | Sigma | Mean | Median | Sigma |
| A | 0 | 128 | 25712 | 157.11 | 786 | 771 | 158.7 |
| A | 13 | 14 | 8134 | 46.38 | 786 | 771 | 158.7 |
| A | 0 | 226 | 7487 | 42.31 | 786 | 771 | 158.7 |
| B | 0 | 214 | 15843 | 99.83 | 794 | 774 | 151.0 |
| B | 12 | 111 | 15227 | 95.74 | 794 | 774 | 151.0 |
| B | 11 | 111 | 12273 | 76.18 | 794 | 774 | 151.0 |
| C | 9 | 68 | 11952 | 63.59 | 758 | 764 | 175.9 |
| C | 13 | 61 | 5939 | 29.41 | 758 | 764 | 175.9 |
| C | 1 | 16 | 4853 | 23.24 | 758 | 764 | 175.9 |
| D | 2 | 14 | 353656 | 1929.5 | 748 | 727 | 182.9 |
| D | 12 | 221 | 174973 | 952.62 | 748 | 727 | 182.9 |
| D | 1 | 52 | 64613 | 349.27 | 748 | 727 | 182.9 |
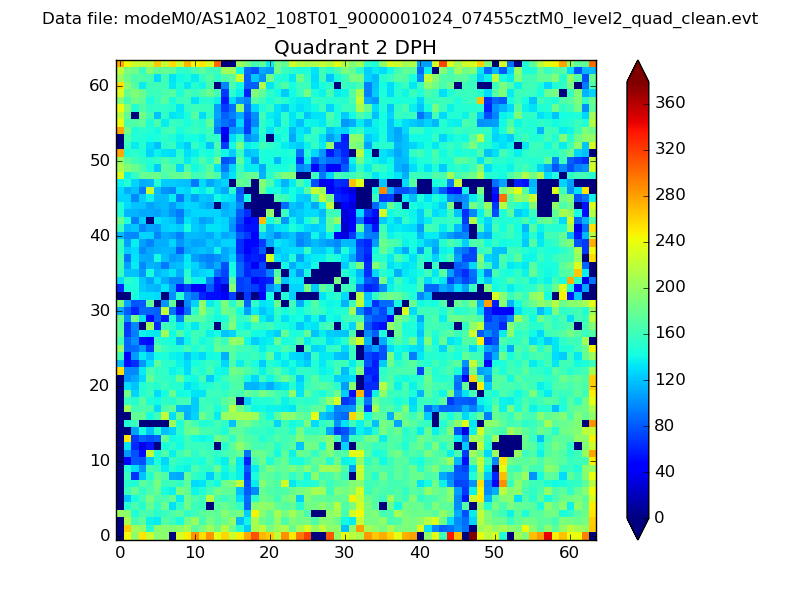
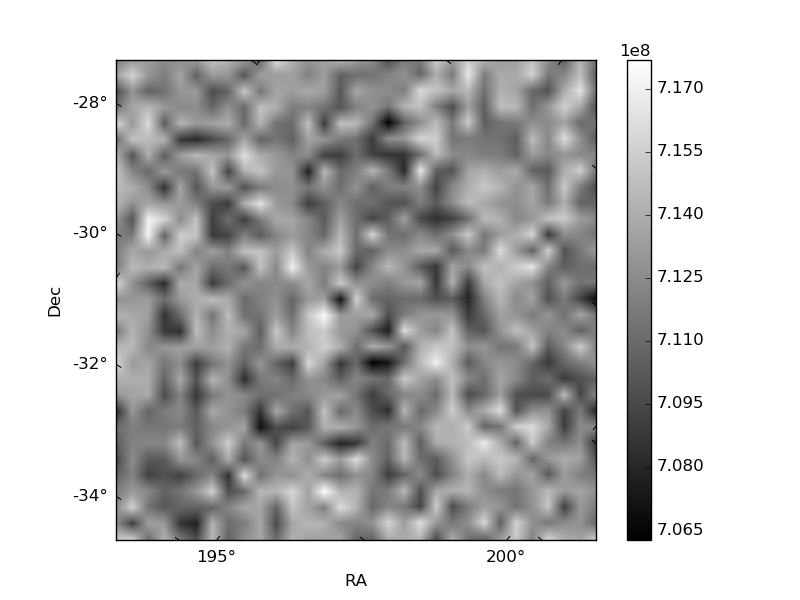
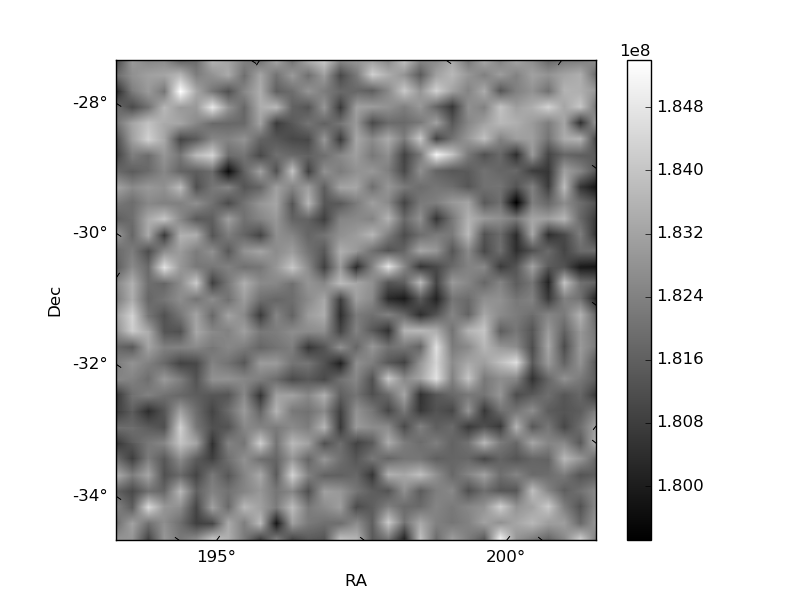
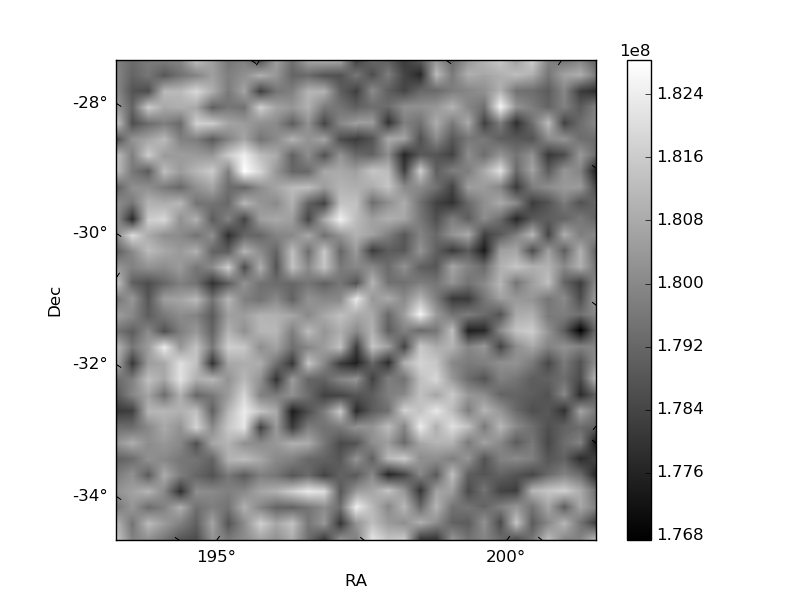
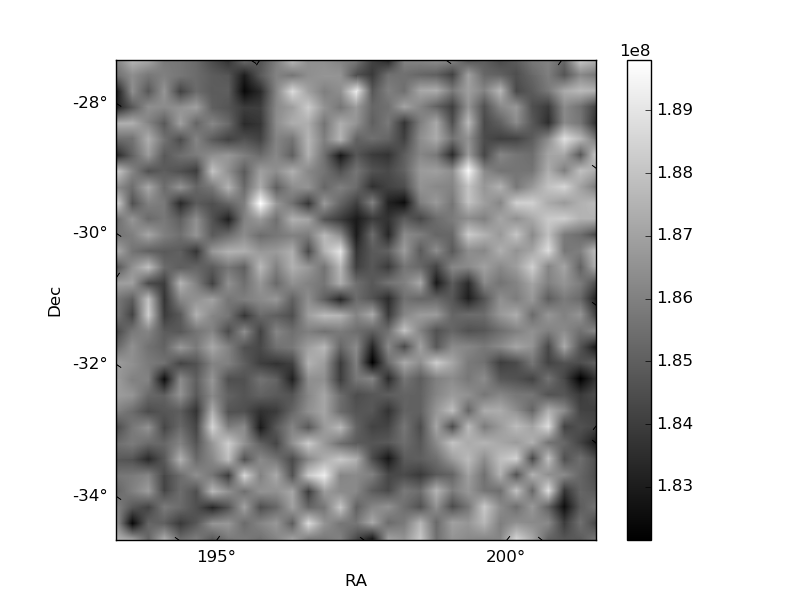
Histogram calculated using DETX and DETY for each event in the final _common_clean file
| Quadrant A | 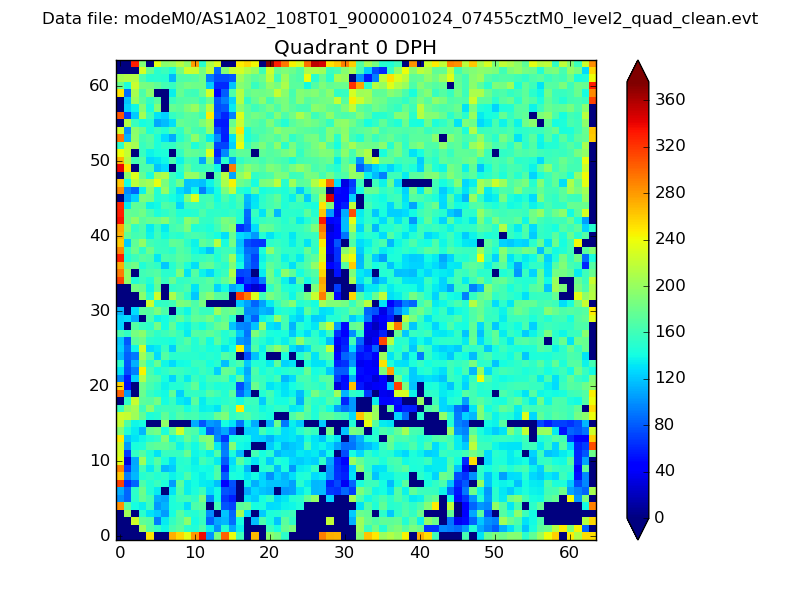 |
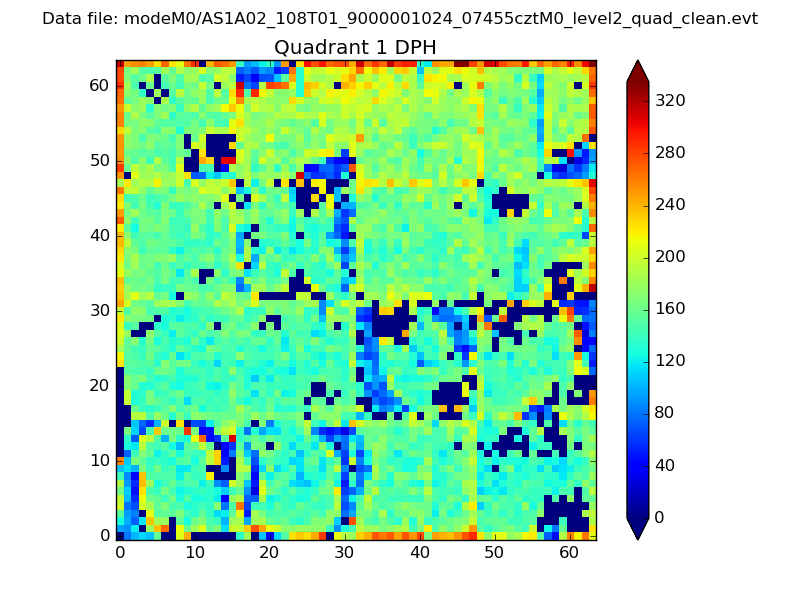 |
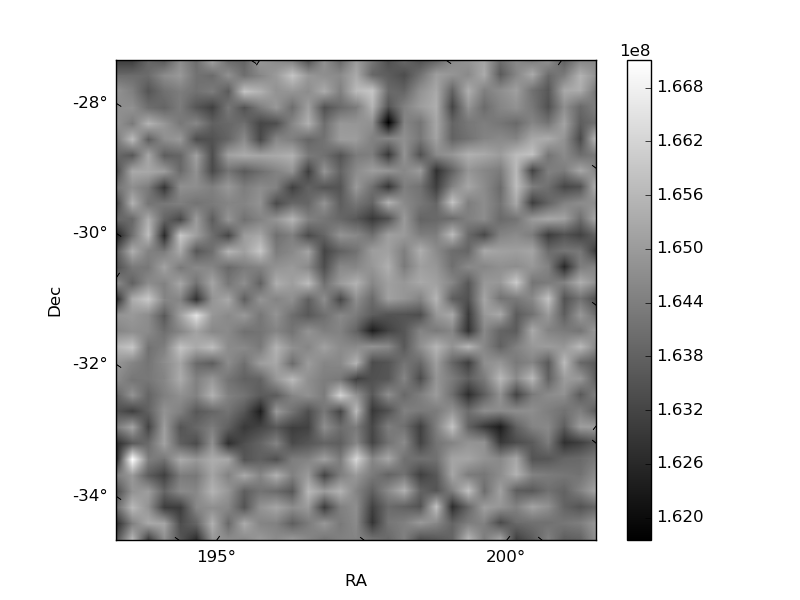
Quadrant B |
|---|---|---|---|
| Quadrant D | 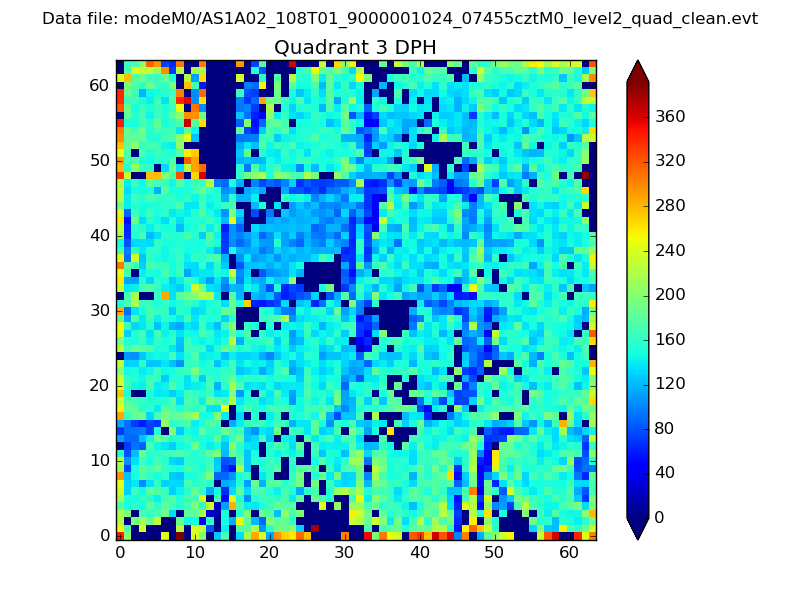 |
 |
Quadrant C |
| Plot type | Count rate plots | Images |
|---|---|---|
| Comparison with Poisson distribution Blue bars denote a histogram of data divided into 1 sec bins. Red curve is a Poisson curve with rate = median count rate of data. |
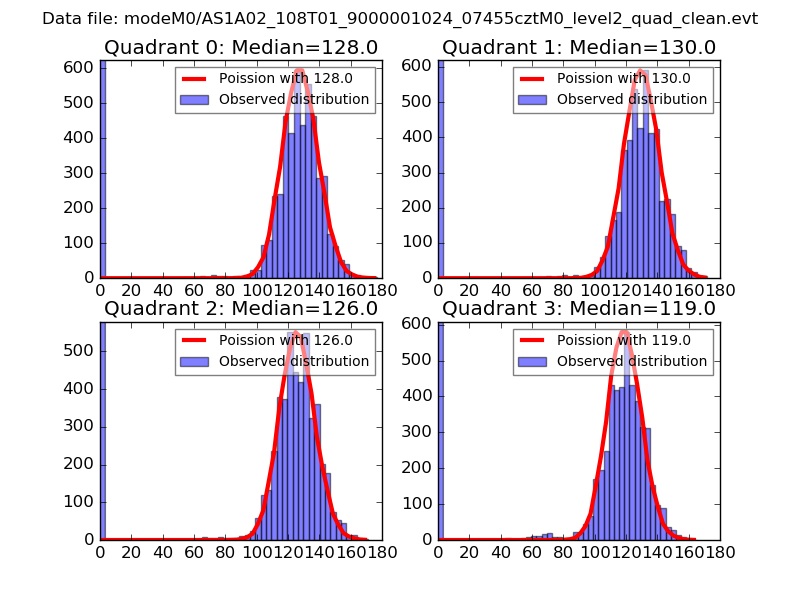 |
 |
| Quadrant-wise count rates Data is divided into 100 sec bins |
 |
|
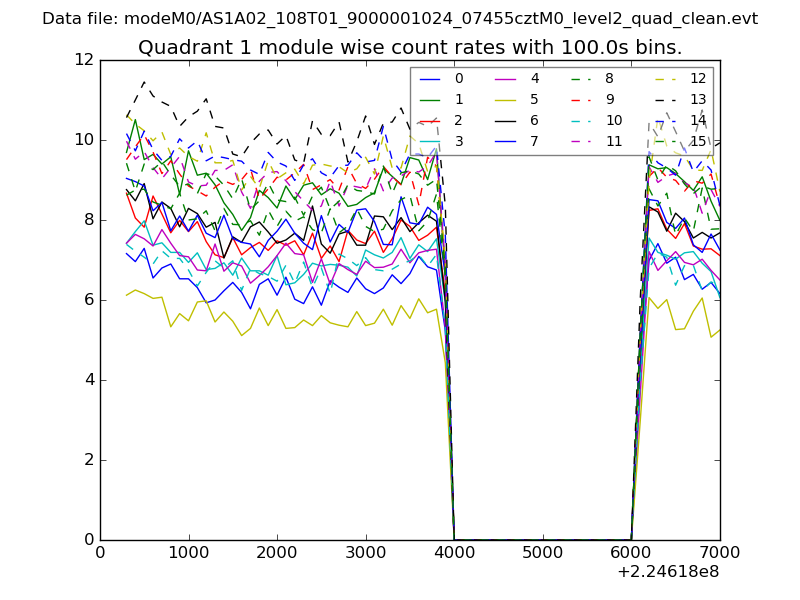
| Module-wise count rates for Quadrant A Data is divided into 100 sec bins |
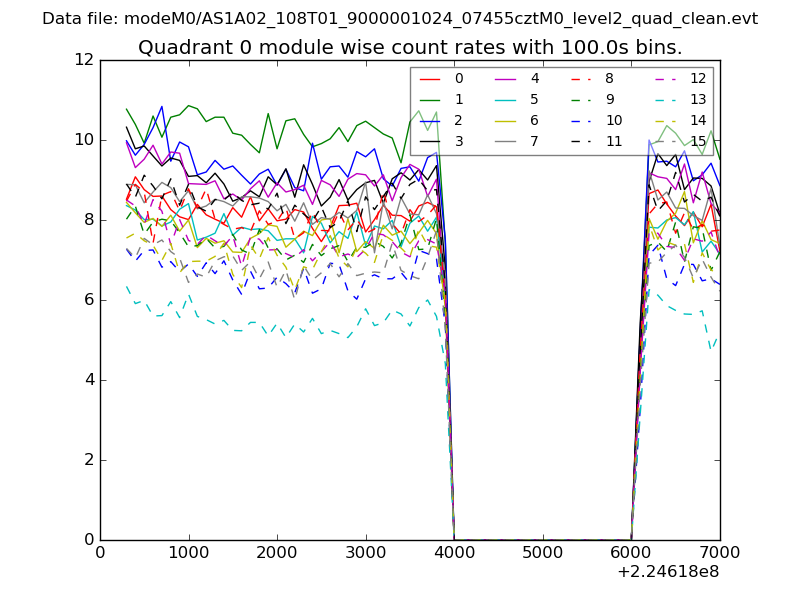 |
 |
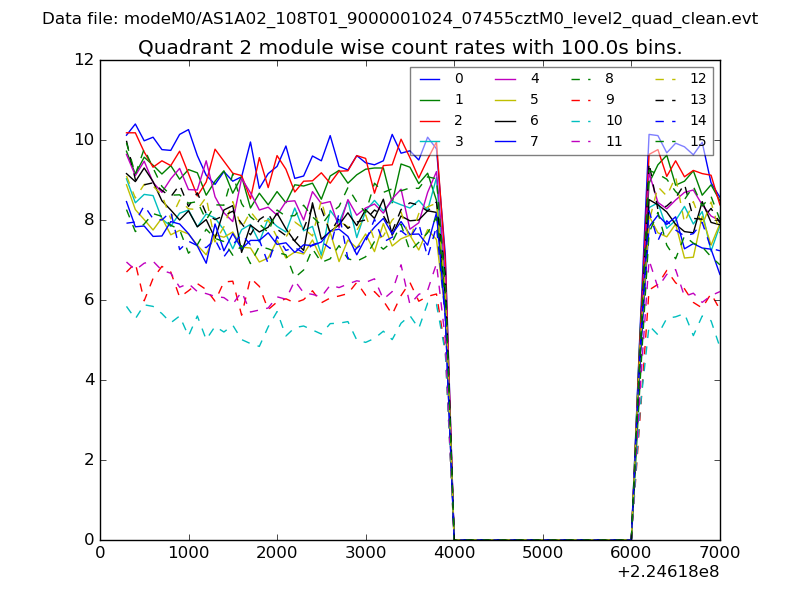
| Module-wise count rates for Quadrant B Data is divided into 100 sec bins |
 |
 |
| Module-wise count rates for Quadrant C Data is divided into 100 sec bins |
 |
 |
| Module-wise count rates for Quadrant D Data is divided into 100 sec bins |
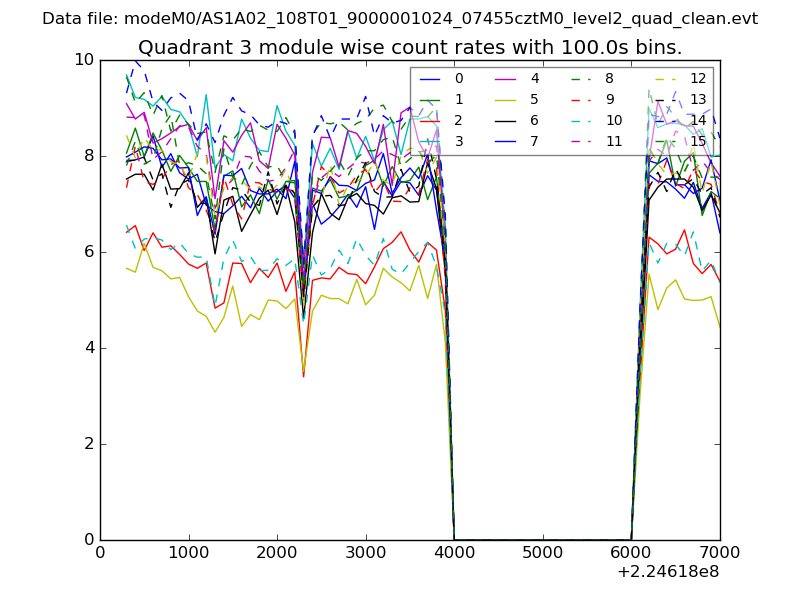 |
 |
| Parameter | Plot |
|---|---|
| CZT HV Monitor | 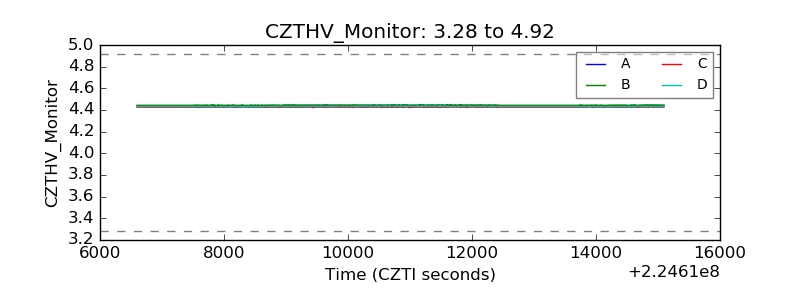 |
| D_VDD | 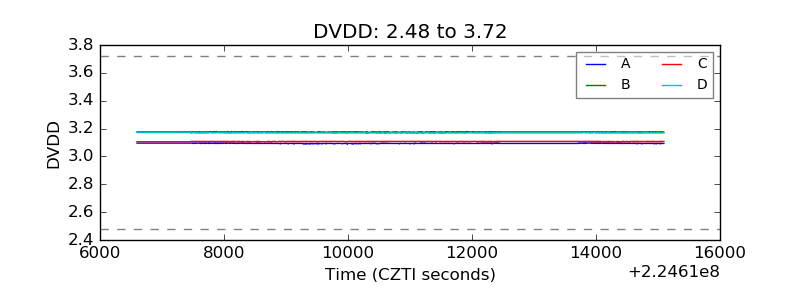 |
| Temperature 1 | 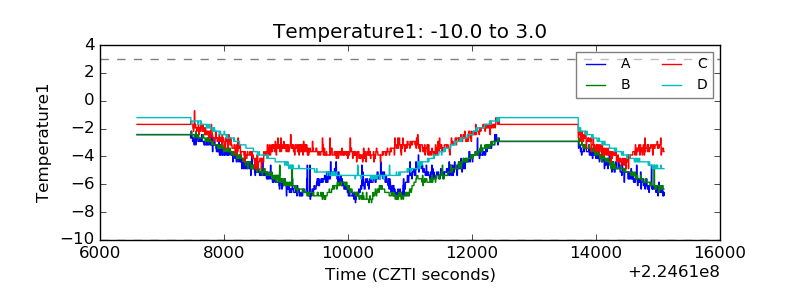 |
| Veto HV Monitor | 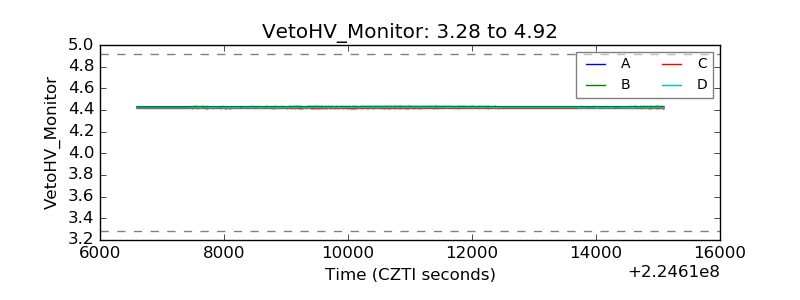 |
| Veto LLD | 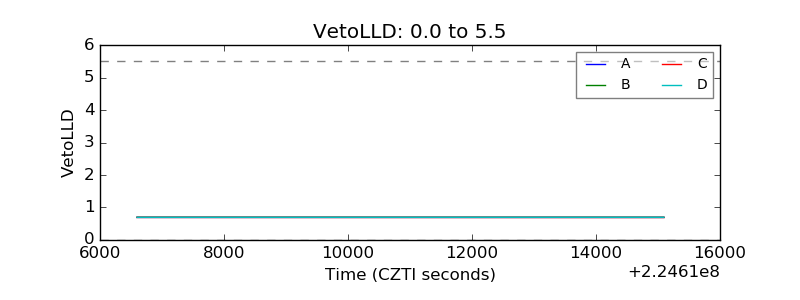 |
| Alpha Counter | 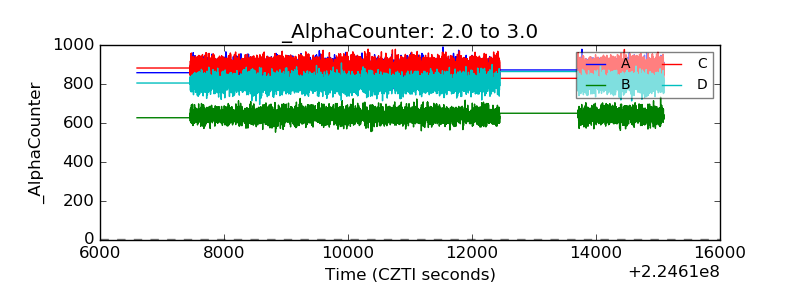 |
| _CPM_Rate | 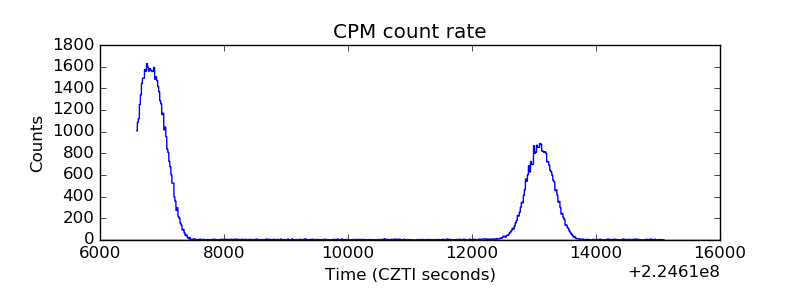 |
| CZT Counter | 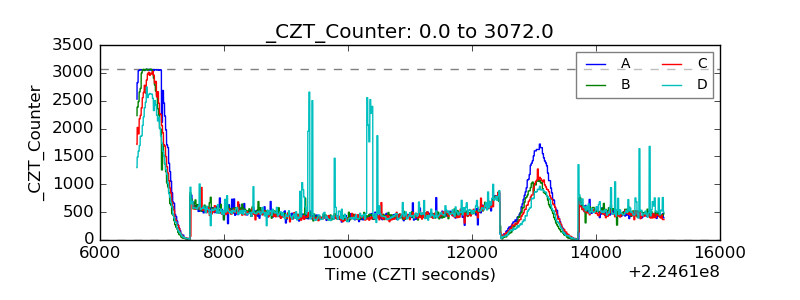 |
| +2.5 Volts monitor |  |
| +5 Volts monitor |  |
| _ROLL_ROT | 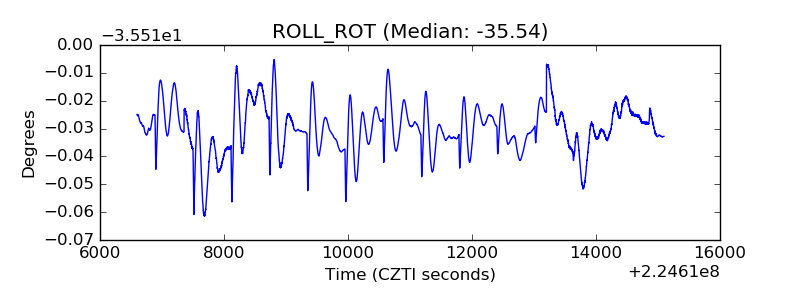 |
| _Roll_DEC | 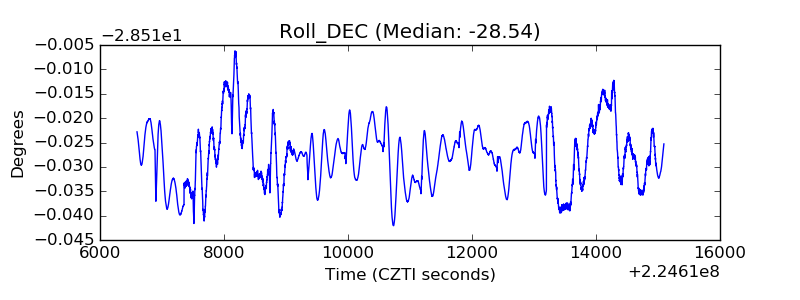 |
| _Roll_RA | 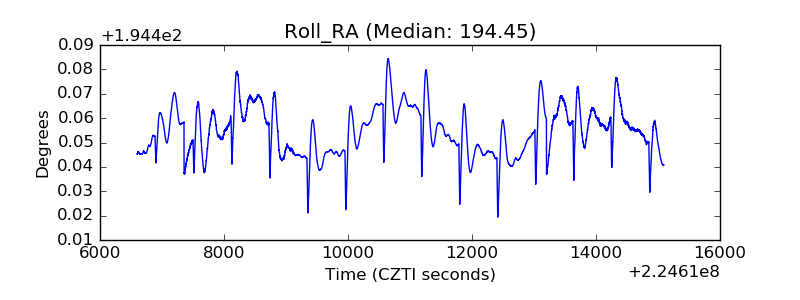 |
| Veto Counter | 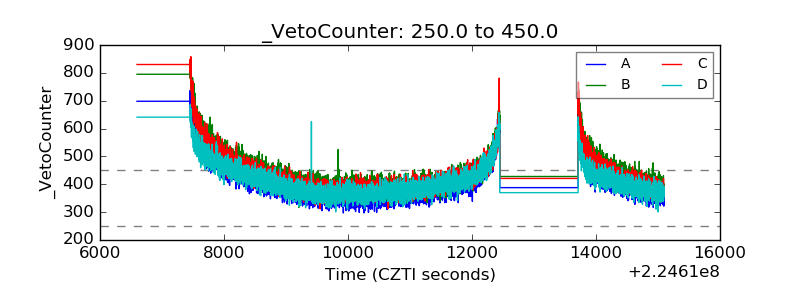 |