| Param | Original file | Final file |
|---|---|---|
| Filename | modeM0/AS1A02_108T01_9000001024_07457cztM0_level2.evt | modeM0/AS1A02_108T01_9000001024_07457cztM0_level2_quad_clean.evt |
| Size (bytes) | 836,043,840 | 89,818,560 |
| Size | 797.3 MB | 85.7 MB |
| Events in quadrant A | 14,655,426 | 422,572 |
| Events in quadrant B | 3,321,853 | 622,640 |
| Events in quadrant C | 3,177,874 | 604,389 |
| Events in quadrant D | 3,688,248 | 578,240 |
| Mode SS | |||
|---|---|---|---|
| Quadrant | BADHDUFLAG | Total packets | Discarded packets |
| A | 0 | 144 | 0 |
| B | 0 | 144 | 0 |
| C | 0 | 144 | 0 |
| D | 0 | 144 | 0 |
| Mode M9 | |||
|---|---|---|---|
| Quadrant | BADHDUFLAG | Total packets | Discarded packets |
| A | 0 | 6 | 0 |
| B | 0 | 6 | 0 |
| C | 0 | 6 | 0 |
| D | 0 | 7 | 0 |
| Mode M0 | |||
|---|---|---|---|
| Quadrant | BADHDUFLAG | Total packets | Discarded packets |
| A | 0 | 48407 | 3 |
| B | 0 | 14736 | 2 |
| C | 0 | 14456 | 2 |
| D | 0 | 15822 | 2 |
| Quadrant | Total seconds | Saturated seconds | Saturation percentage |
|---|---|---|---|
| A | 7044 | 4214 | 59.823964% |
| B | 7044 | 59 | 0.837592% |
| C | 7044 | 19 | 0.269733% |
| D | 7044 | 48 | 0.681431% |
Noise dominated data is calculated using 1-second bins in cleaned event files. If a bin has >2000 counts, and if more than 50% of those come from <1% of pixels, then it is considered to be noise-dominated and hence unusable.
| Quadrant | # 1 sec bins | Bins with >0 counts | Bins with >2000 counts | High rate bins dominated by noise | Noise dominated (total time) | Noise dominated (detector-on time) | Marked lightcurve |
|---|---|---|---|---|---|---|---|
| A | 7664 | 7044 | 3855 | 3855 | 50.30% | 54.73% | 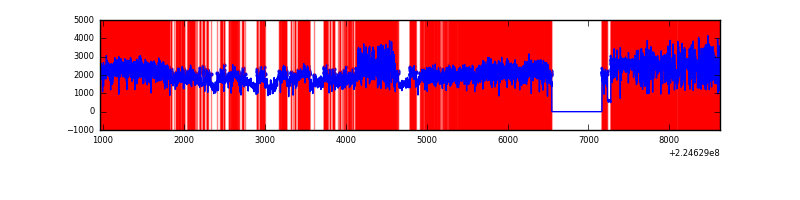 |
| B | 7664 | 7045 | 2 | 2 | 0.03% | 0.03% | 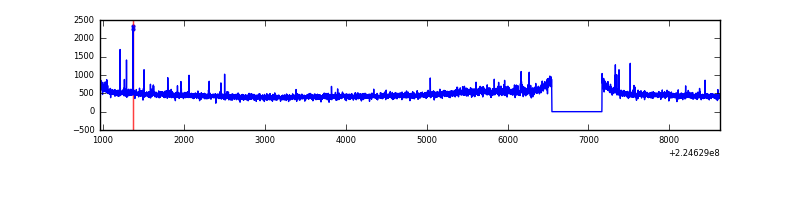 |
| C | 7664 | 7045 | 2 | 2 | 0.03% | 0.03% | 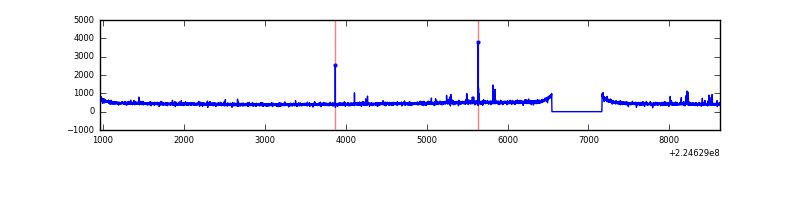 |
| D | 7664 | 7045 | 28 | 28 | 0.37% | 0.40% | 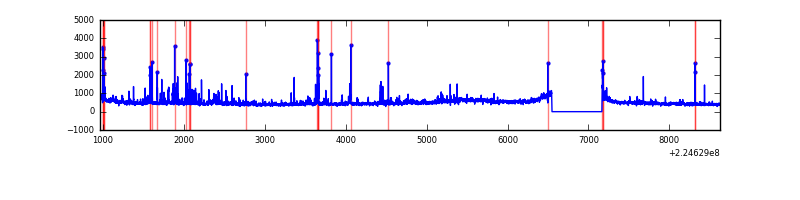 |
Top three noisy pixels from each quadrant. If the there are fewer than three noisy pixels in the level2.evt file, extra rows are filled as -1
| Pixel properties | Quadrant properties | ||||||
|---|---|---|---|---|---|---|---|
| Quadrant | DetID | PixID | Counts | Sigma | Mean | Median | Sigma |
| A | 15 | 239 | 12201571 | 93715.12 | 635 | 621 | 130.2 |
| A | 0 | 226 | 5725 | 39.2 | 635 | 621 | 130.2 |
| A | 12 | 194 | 5497 | 37.45 | 635 | 621 | 130.2 |
| B | 0 | 214 | 49413 | 303.61 | 837 | 816 | 160.1 |
| B | 12 | 111 | 16825 | 100.02 | 837 | 816 | 160.1 |
| B | 11 | 111 | 13220 | 77.49 | 837 | 816 | 160.1 |
| C | 1 | 16 | 35470 | 186.41 | 802 | 808 | 185.9 |
| C | 9 | 68 | 6421 | 30.19 | 802 | 808 | 185.9 |
| C | 13 | 61 | 6323 | 29.66 | 802 | 808 | 185.9 |
| D | 1 | 52 | 206481 | 1049.23 | 794 | 771 | 196.1 |
| D | 12 | 221 | 166241 | 843.98 | 794 | 771 | 196.1 |
| D | 8 | 195 | 103437 | 523.65 | 794 | 771 | 196.1 |
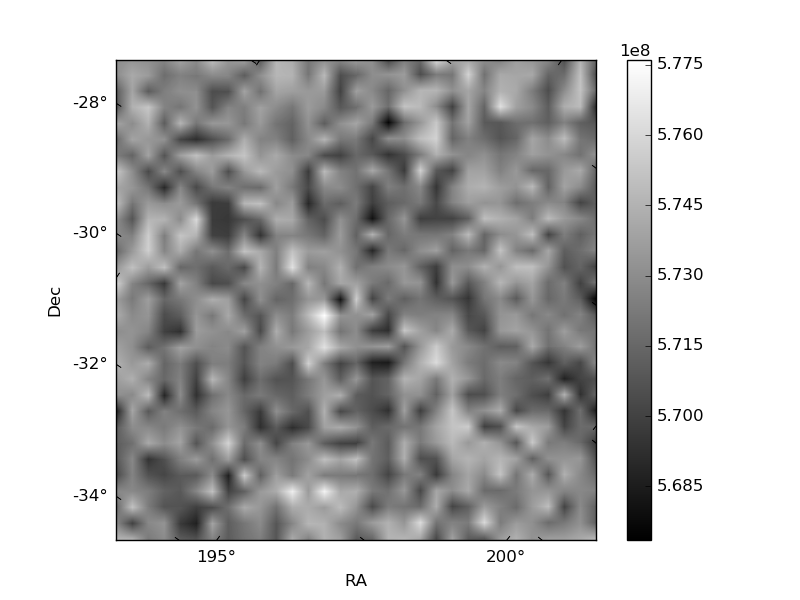
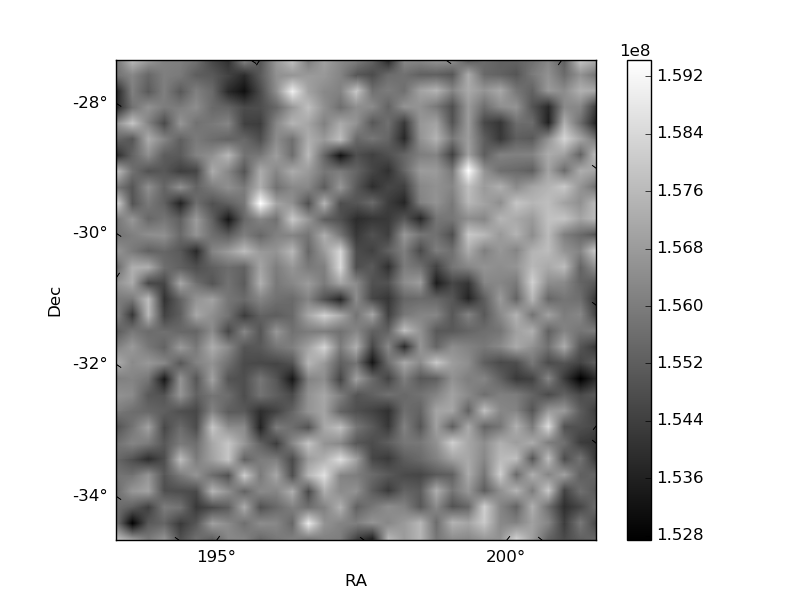
Histogram calculated using DETX and DETY for each event in the final _common_clean file
| Quadrant A | 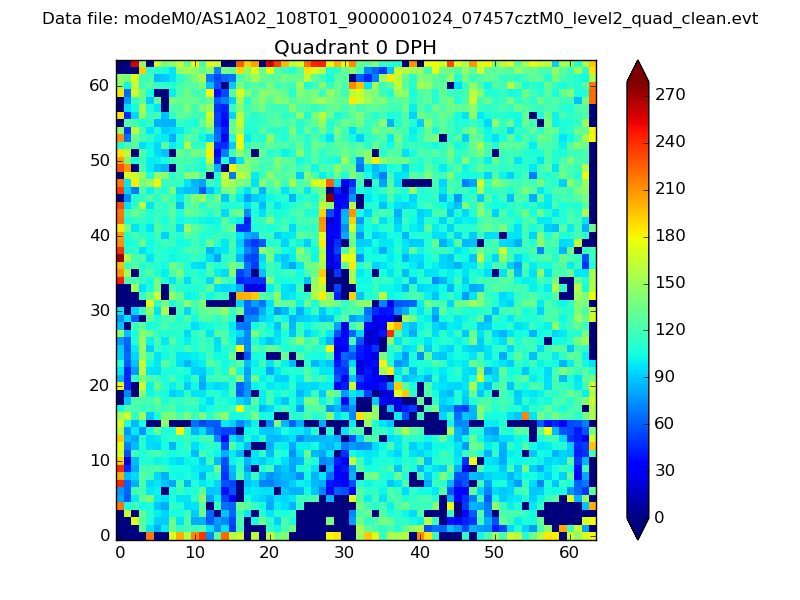 |
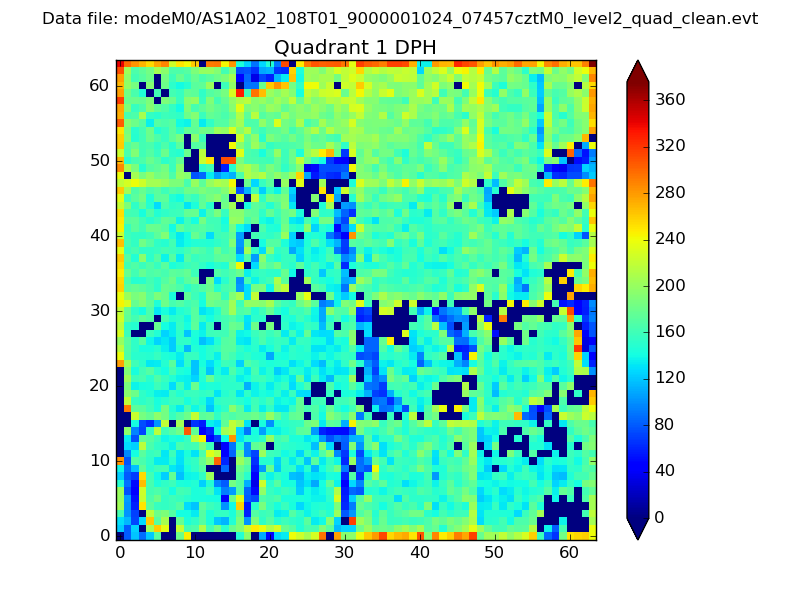 |
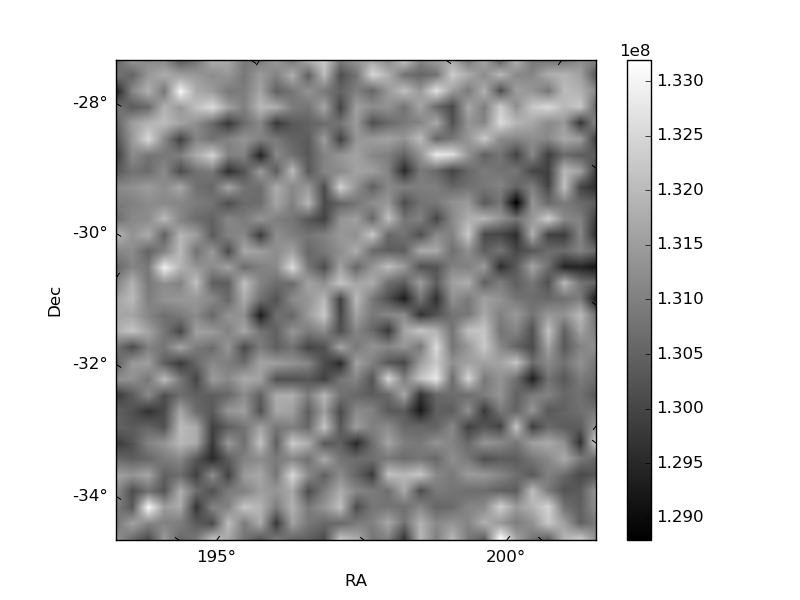
Quadrant B |
|---|---|---|---|
| Quadrant D | 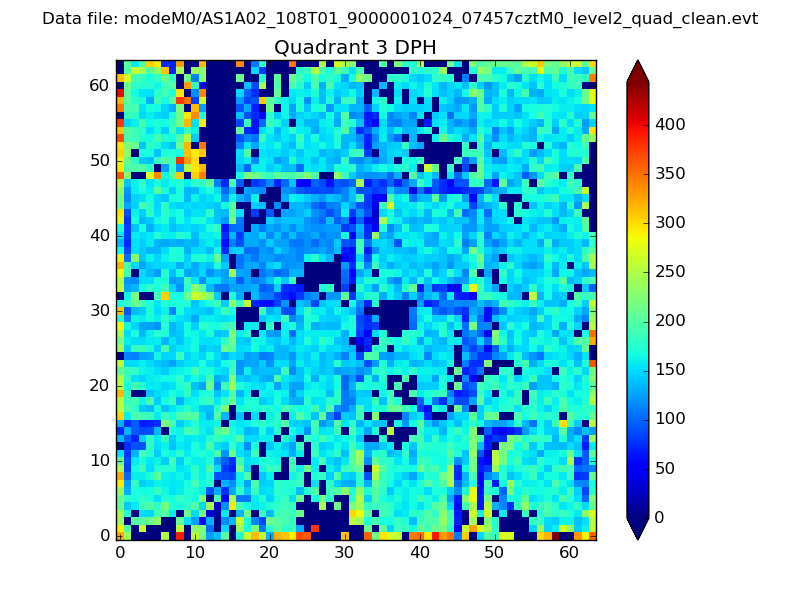 |
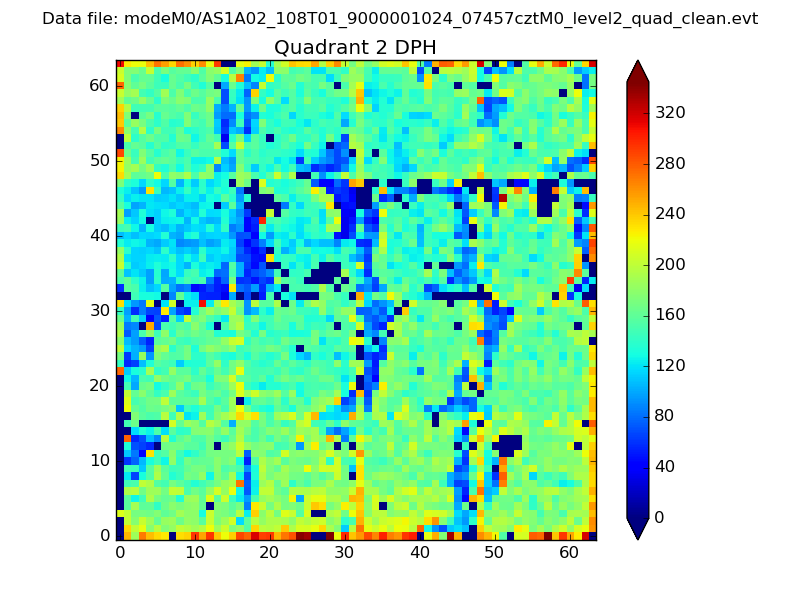 |
Quadrant C |
| Plot type | Count rate plots | Images |
|---|---|---|
| Comparison with Poisson distribution Blue bars denote a histogram of data divided into 1 sec bins. Red curve is a Poisson curve with rate = median count rate of data. |
 |
 |
| Quadrant-wise count rates Data is divided into 100 sec bins |
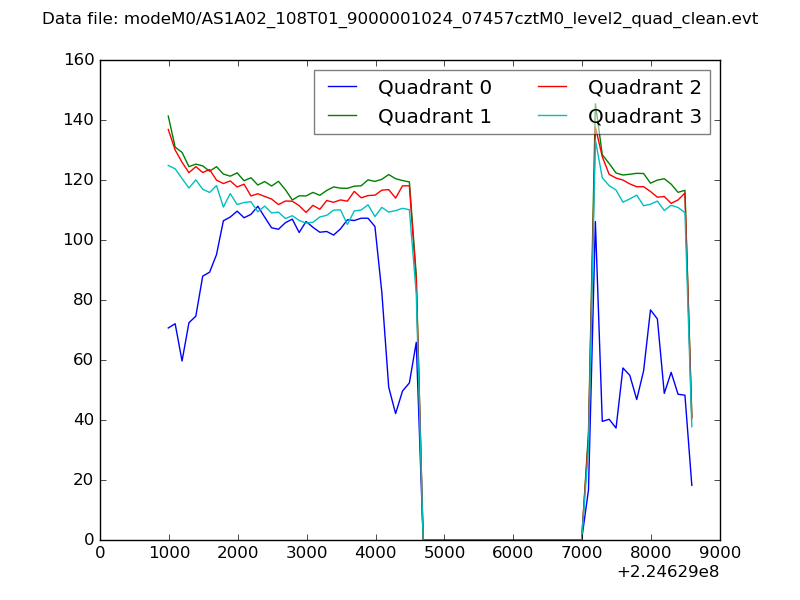 |
|
| Module-wise count rates for Quadrant A Data is divided into 100 sec bins |
 |
 |
| Module-wise count rates for Quadrant B Data is divided into 100 sec bins |
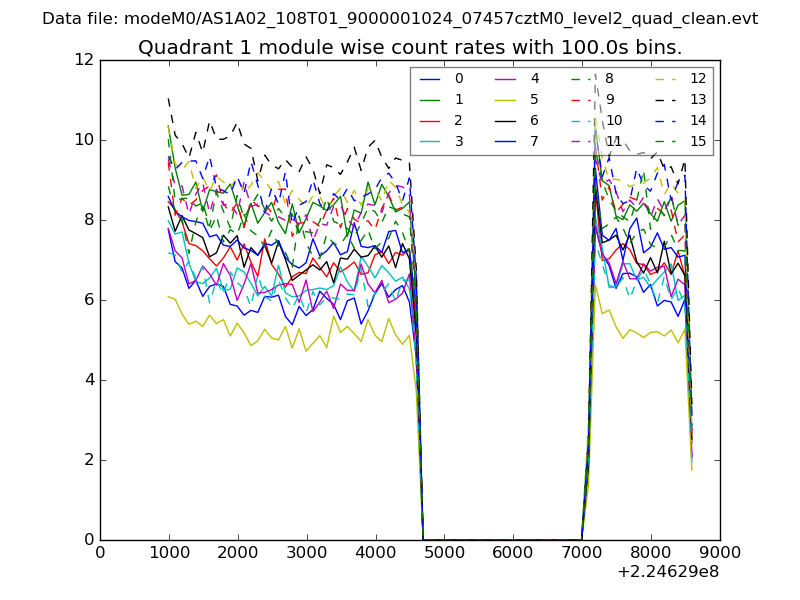 |
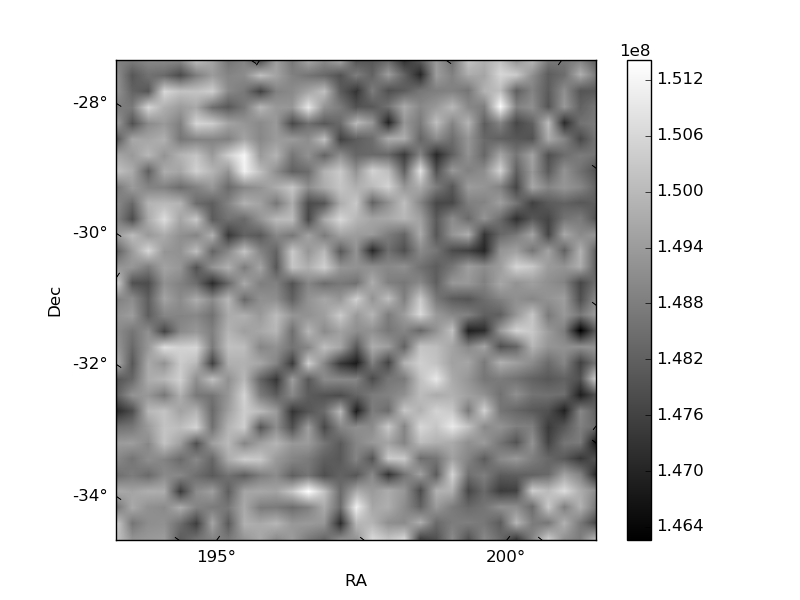 |
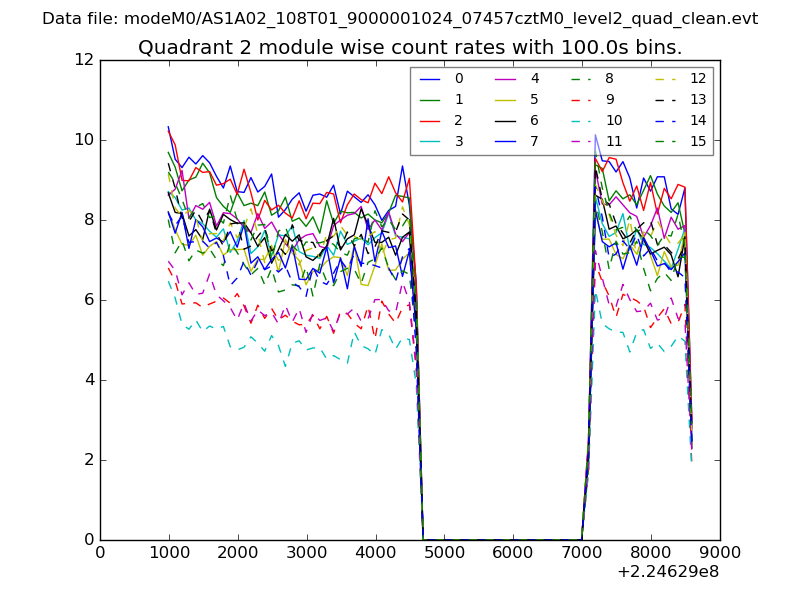
| Module-wise count rates for Quadrant C Data is divided into 100 sec bins |
 |
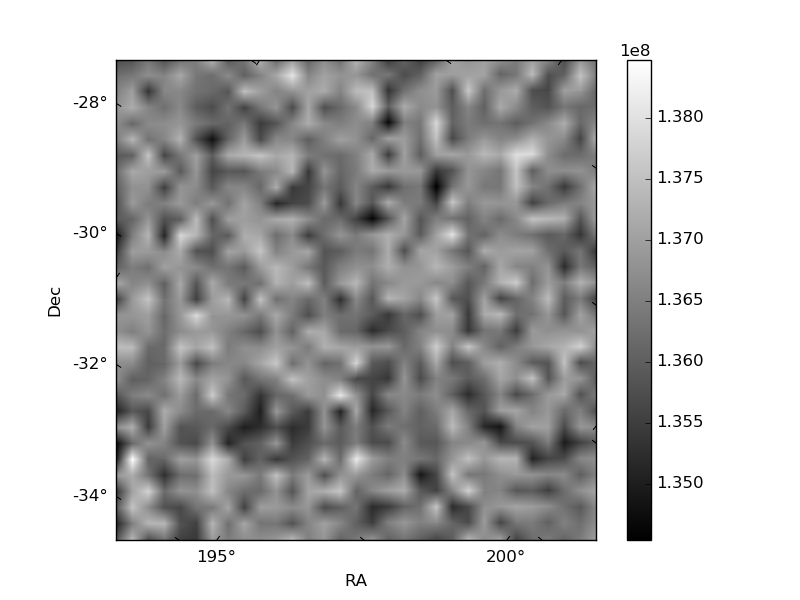 |
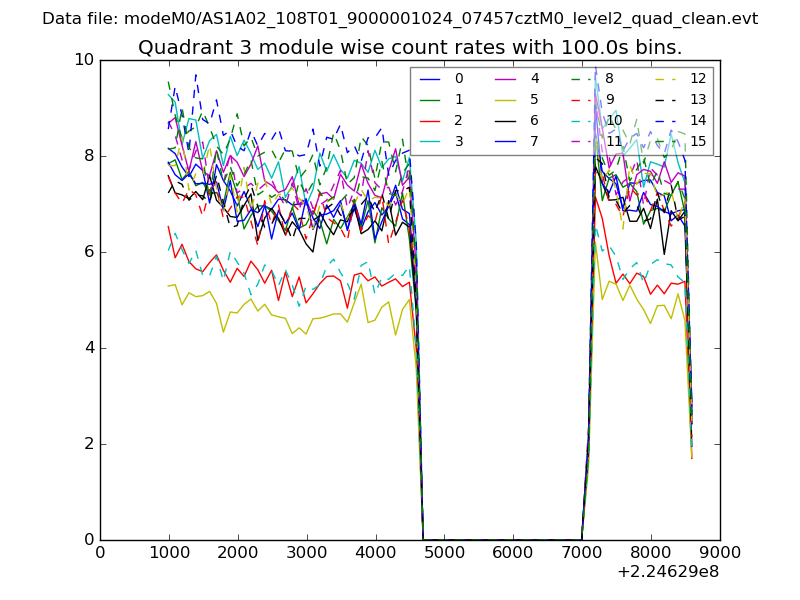
| Module-wise count rates for Quadrant D Data is divided into 100 sec bins |
 |
 |
| Parameter | Plot |
|---|---|
| CZT HV Monitor | 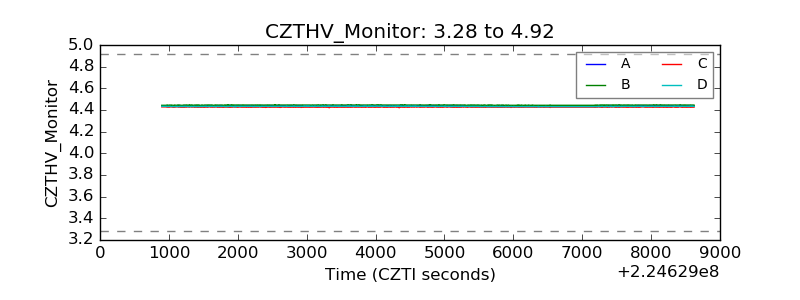 |
| D_VDD | 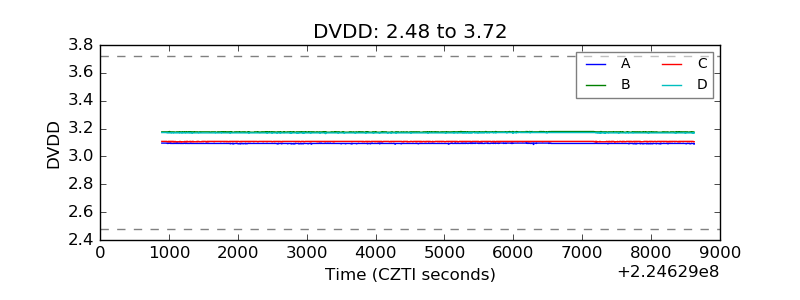 |
| Temperature 1 | 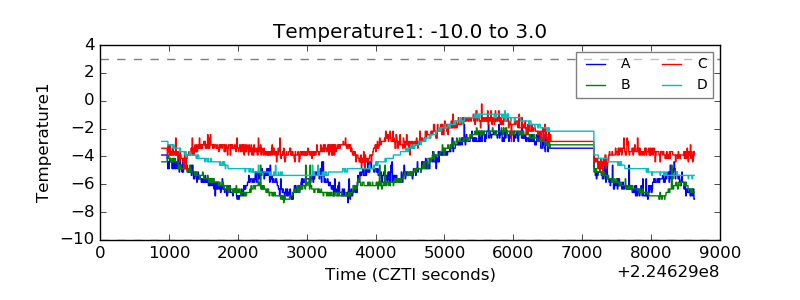 |
| Veto HV Monitor | 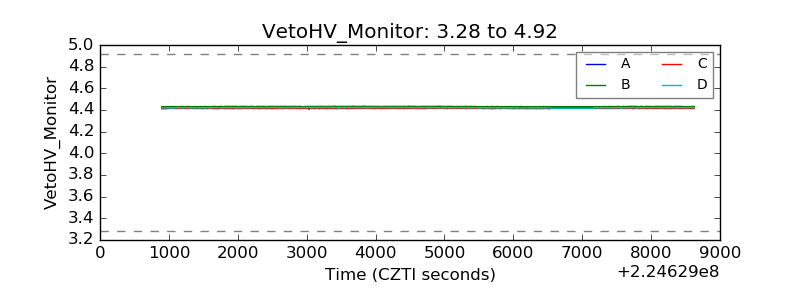 |
| Veto LLD | 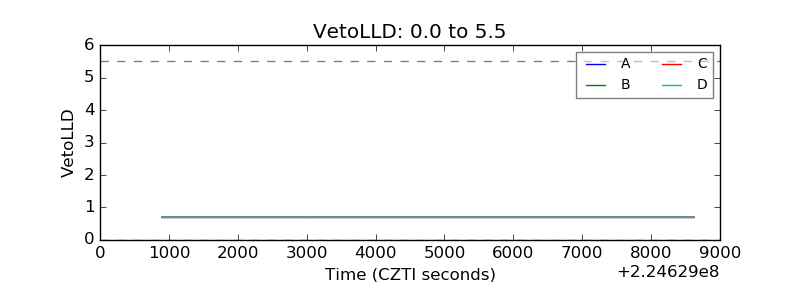 |
| Alpha Counter | 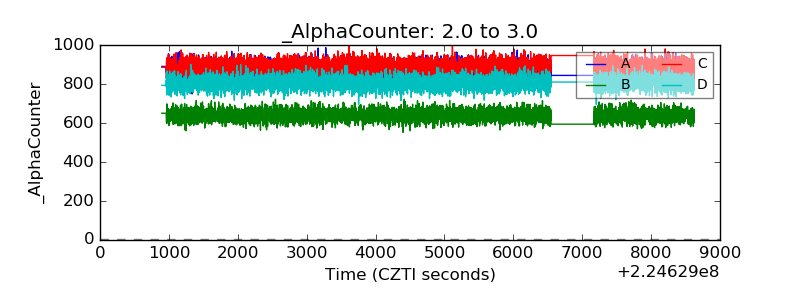 |
| _CPM_Rate | 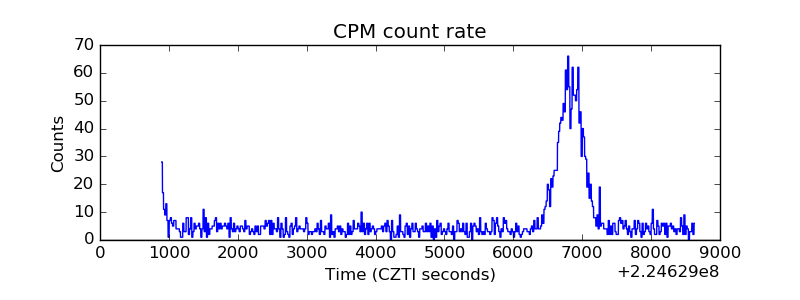 |
| CZT Counter | 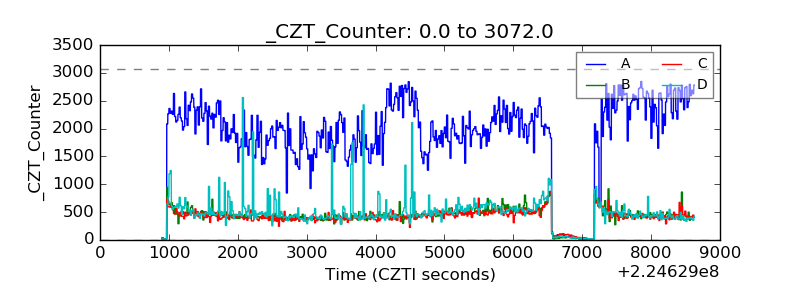 |
| +2.5 Volts monitor |  |
| +5 Volts monitor |  |
| _ROLL_ROT | 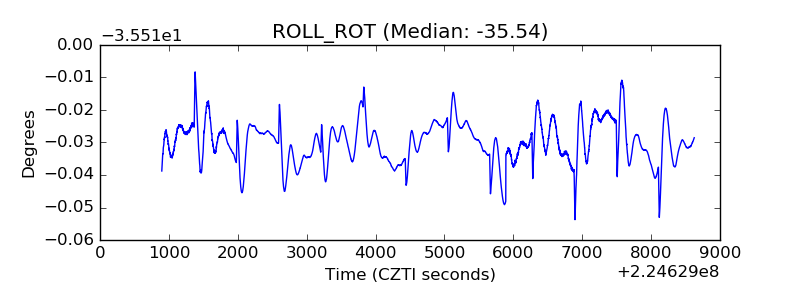 |
| _Roll_DEC | 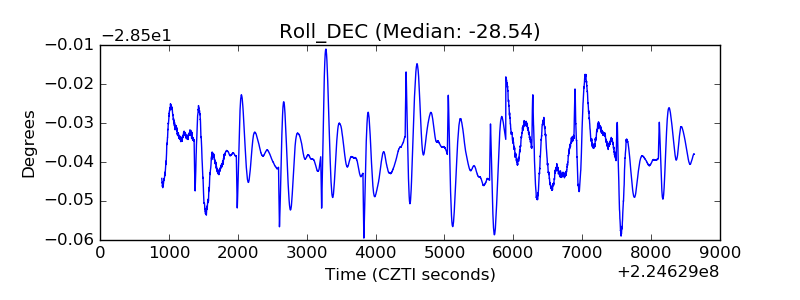 |
| _Roll_RA | 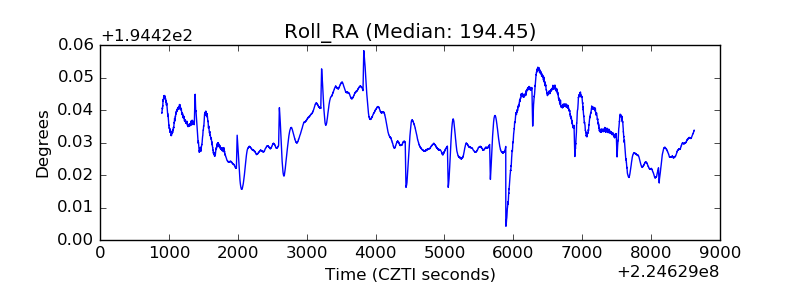 |
| Veto Counter | 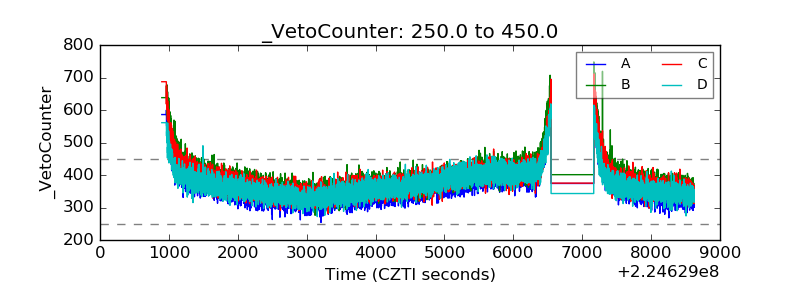 |