| Param | Original file | Final file |
|---|---|---|
| Filename | modeM0/AS1A02_108T01_9000001024_07458cztM0_level2.evt | modeM0/AS1A02_108T01_9000001024_07458cztM0_level2_quad_clean.evt |
| Size (bytes) | 903,816,000 | 95,987,520 |
| Size | 861.9 MB | 91.5 MB |
| Events in quadrant A | 15,463,084 | 411,338 |
| Events in quadrant B | 3,697,435 | 669,445 |
| Events in quadrant C | 3,545,588 | 654,859 |
| Events in quadrant D | 4,134,655 | 623,231 |
| Mode SS | |||
|---|---|---|---|
| Quadrant | BADHDUFLAG | Total packets | Discarded packets |
| A | 0 | 164 | 0 |
| B | 0 | 164 | 0 |
| C | 0 | 164 | 0 |
| D | 0 | 164 | 0 |
| Mode M9 | |||
|---|---|---|---|
| Quadrant | BADHDUFLAG | Total packets | Discarded packets |
| A | 0 | 8 | 0 |
| B | 0 | 8 | 0 |
| C | 0 | 8 | 0 |
| D | 0 | 8 | 0 |
| Mode M0 | |||
|---|---|---|---|
| Quadrant | BADHDUFLAG | Total packets | Discarded packets |
| A | 0 | 51380 | 4 |
| B | 0 | 16466 | 3 |
| C | 0 | 16215 | 3 |
| D | 0 | 17660 | 3 |
| Quadrant | Total seconds | Saturated seconds | Saturation percentage |
|---|---|---|---|
| A | 7845 | 5018 | 63.964308% |
| B | 7845 | 96 | 1.223709% |
| C | 7845 | 43 | 0.548120% |
| D | 7845 | 127 | 1.618866% |
Noise dominated data is calculated using 1-second bins in cleaned event files. If a bin has >2000 counts, and if more than 50% of those come from <1% of pixels, then it is considered to be noise-dominated and hence unusable.
| Quadrant | # 1 sec bins | Bins with >0 counts | Bins with >2000 counts | High rate bins dominated by noise | Noise dominated (total time) | Noise dominated (detector-on time) | Marked lightcurve |
|---|---|---|---|---|---|---|---|
| A | 8760 | 7847 | 4121 | 4121 | 47.04% | 52.52% | 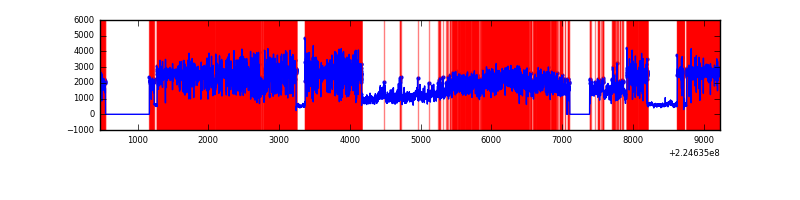 |
| B | 8760 | 7848 | 2 | 2 | 0.02% | 0.03% | 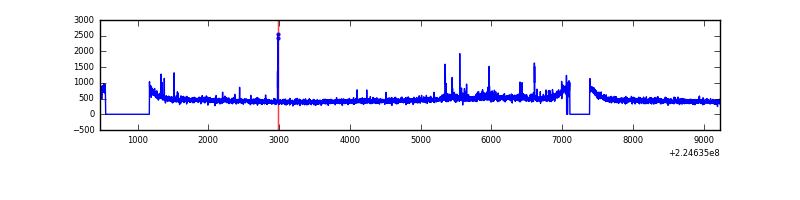 |
| C | 8760 | 7848 | 0 | 0 | 0.00% | 0.00% |  |
| D | 8760 | 7848 | 77 | 77 | 0.88% | 0.98% | 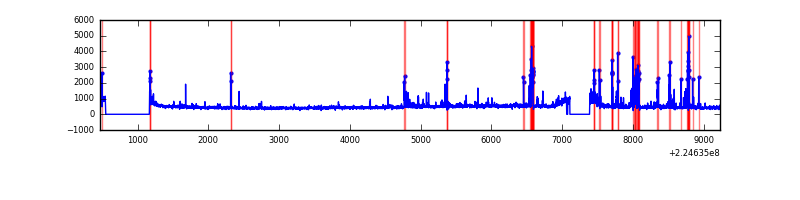 |
Top three noisy pixels from each quadrant. If the there are fewer than three noisy pixels in the level2.evt file, extra rows are filled as -1
| Pixel properties | Quadrant properties | ||||||
|---|---|---|---|---|---|---|---|
| Quadrant | DetID | PixID | Counts | Sigma | Mean | Median | Sigma |
| A | 15 | 239 | 12780785 | 90500.09 | 688 | 671 | 141.2 |
| A | 0 | 128 | 17278 | 117.6 | 688 | 671 | 141.2 |
| A | 15 | 234 | 14353 | 96.88 | 688 | 671 | 141.2 |
| B | 0 | 214 | 50441 | 271.52 | 933 | 907 | 182.4 |
| B | 12 | 111 | 19314 | 100.9 | 933 | 907 | 182.4 |
| B | 11 | 111 | 15038 | 77.46 | 933 | 907 | 182.4 |
| C | 1 | 16 | 32406 | 149.73 | 898 | 902 | 210.4 |
| C | 13 | 61 | 6876 | 28.39 | 898 | 902 | 210.4 |
| C | 9 | 68 | 6164 | 25.01 | 898 | 902 | 210.4 |
| D | 12 | 221 | 178625 | 815.27 | 888 | 859 | 218.0 |
| D | 2 | 14 | 151883 | 692.63 | 888 | 859 | 218.0 |
| D | 12 | 233 | 111865 | 509.1 | 888 | 859 | 218.0 |
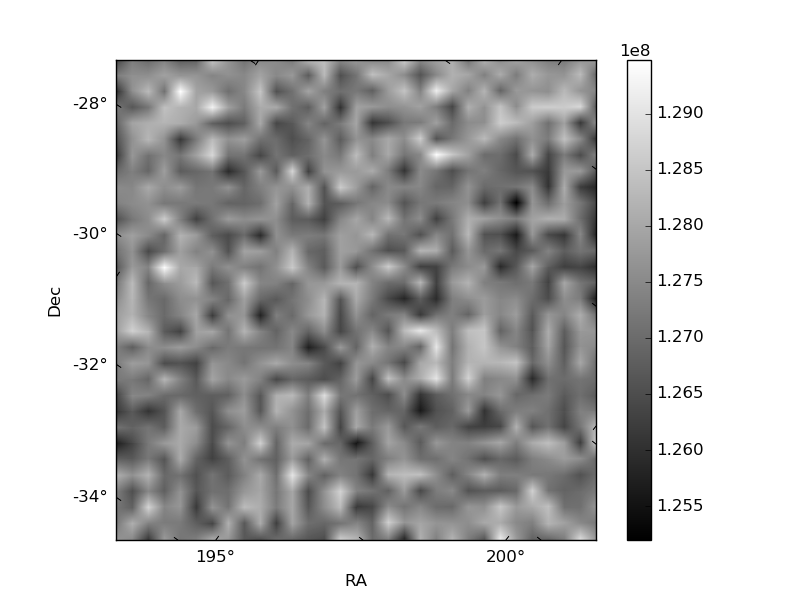
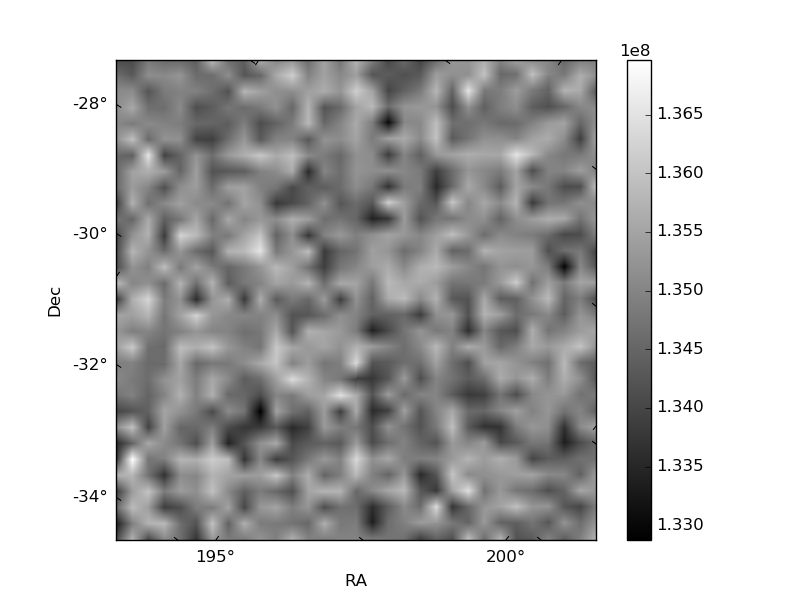
Histogram calculated using DETX and DETY for each event in the final _common_clean file
| Quadrant A |  |
 |
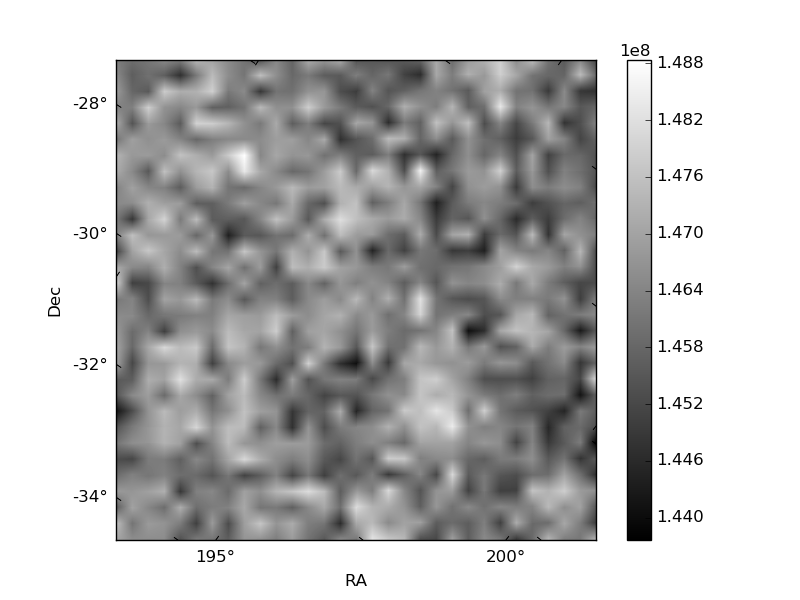
Quadrant B |
|---|---|---|---|
| Quadrant D | 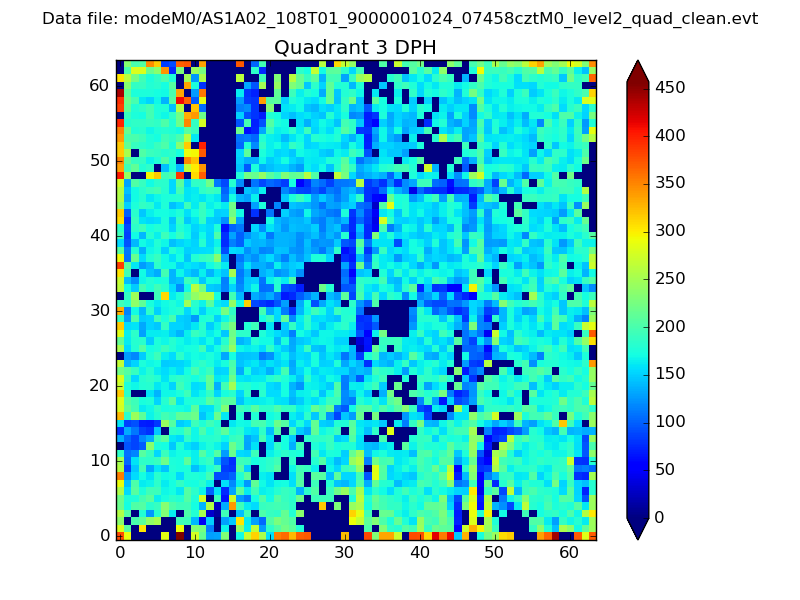 |
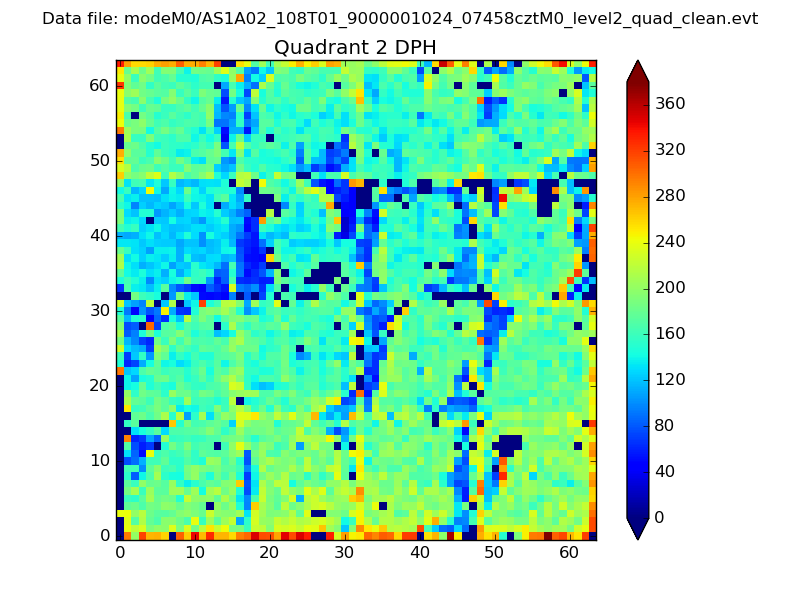 |
Quadrant C |
| Plot type | Count rate plots | Images |
|---|---|---|
| Comparison with Poisson distribution Blue bars denote a histogram of data divided into 1 sec bins. Red curve is a Poisson curve with rate = median count rate of data. |
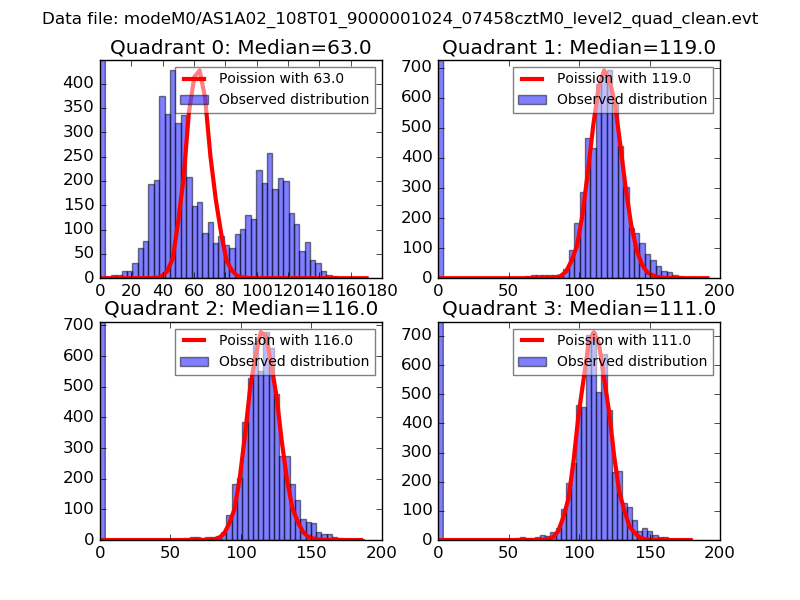 |
 |
| Quadrant-wise count rates Data is divided into 100 sec bins |
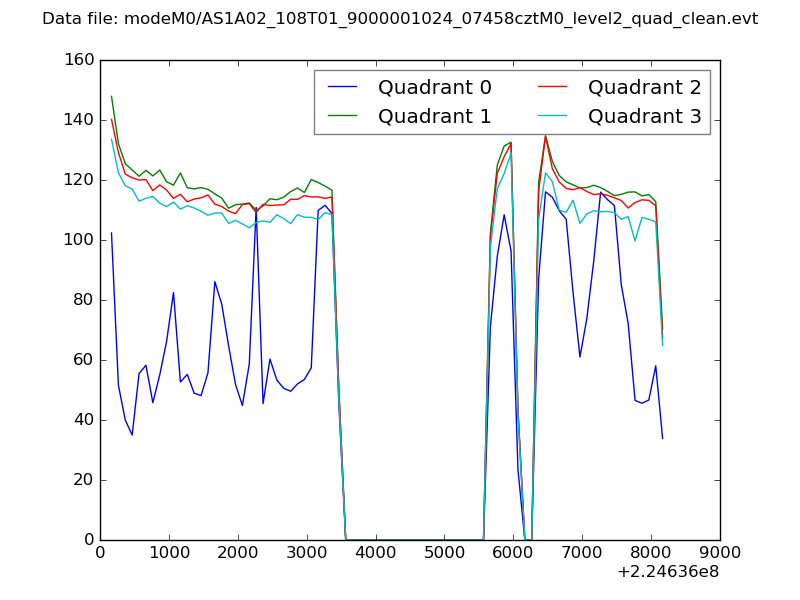 |
|
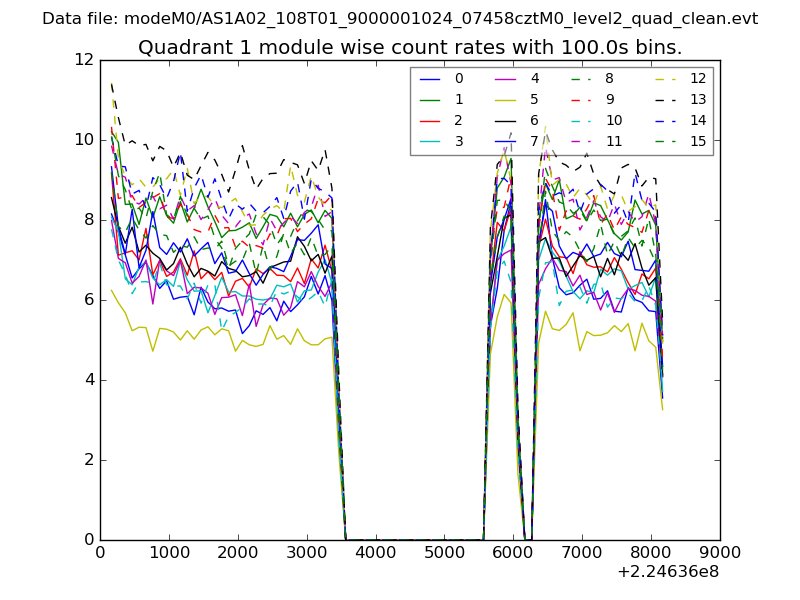
| Module-wise count rates for Quadrant A Data is divided into 100 sec bins |
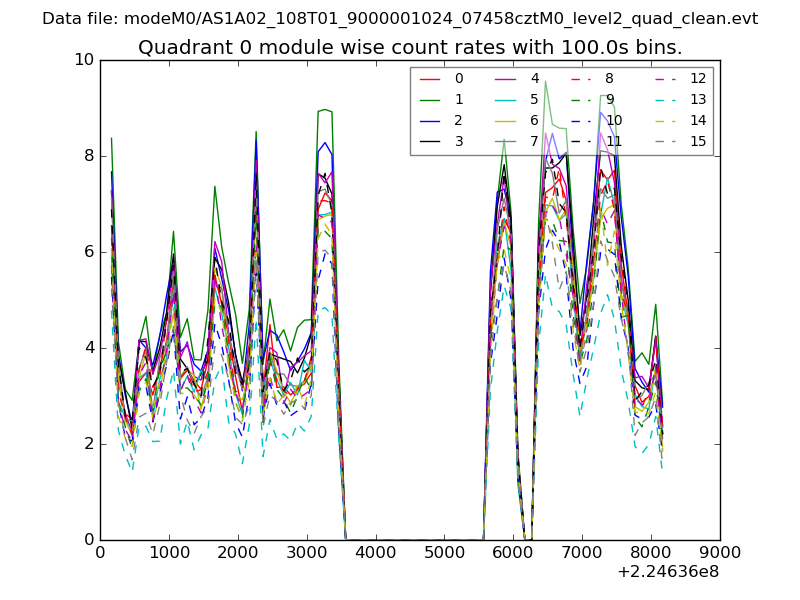 |
 |
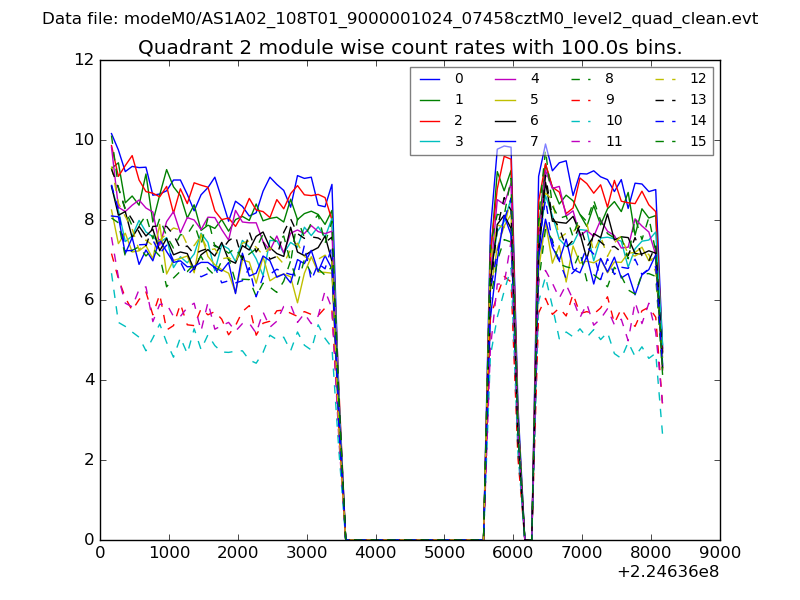
| Module-wise count rates for Quadrant B Data is divided into 100 sec bins |
 |
 |
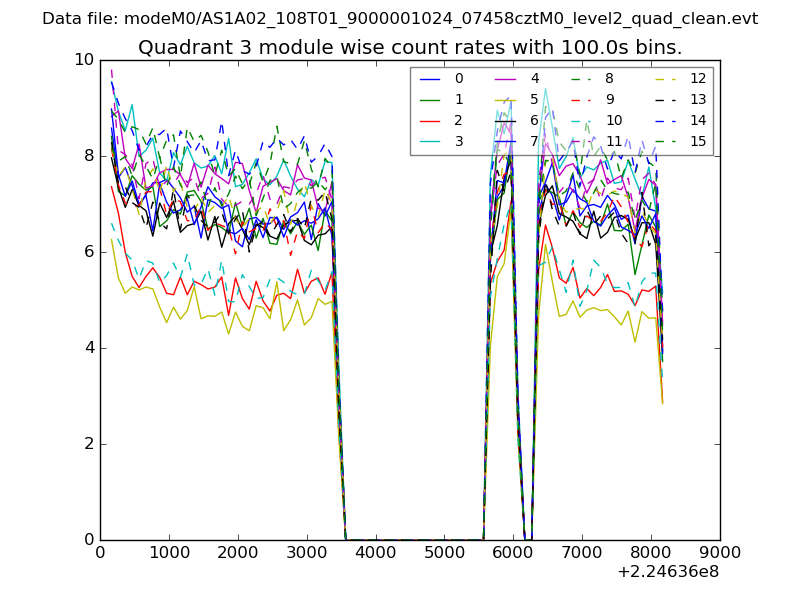
| Module-wise count rates for Quadrant C Data is divided into 100 sec bins |
 |
 |
| Module-wise count rates for Quadrant D Data is divided into 100 sec bins |
 |
 |
| Parameter | Plot |
|---|---|
| CZT HV Monitor | 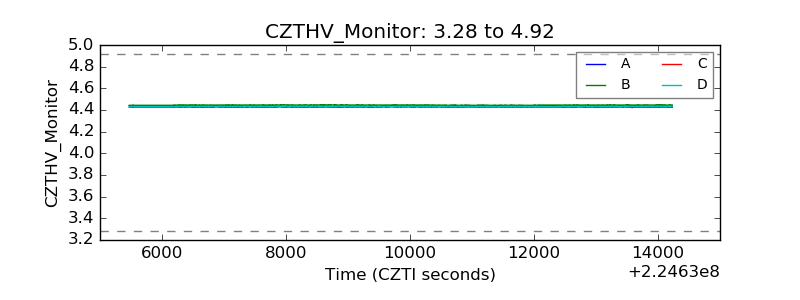 |
| D_VDD | 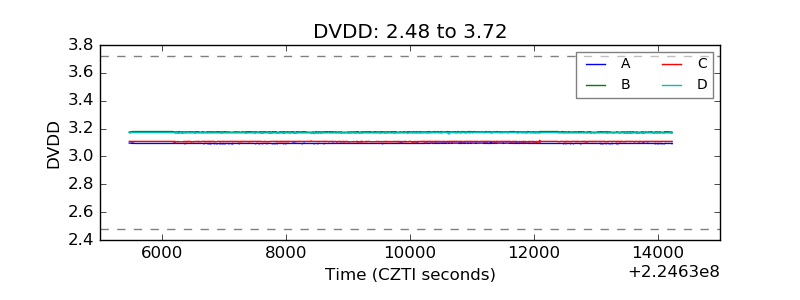 |
| Temperature 1 | 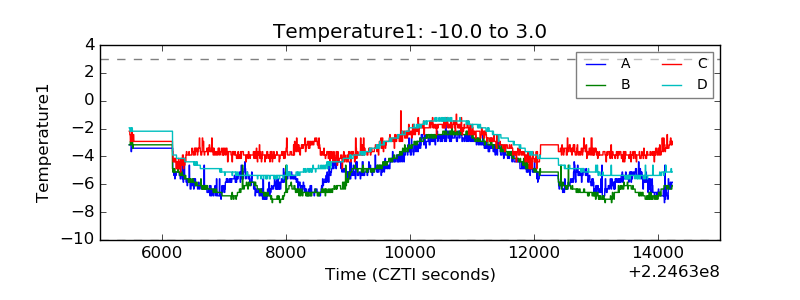 |
| Veto HV Monitor | 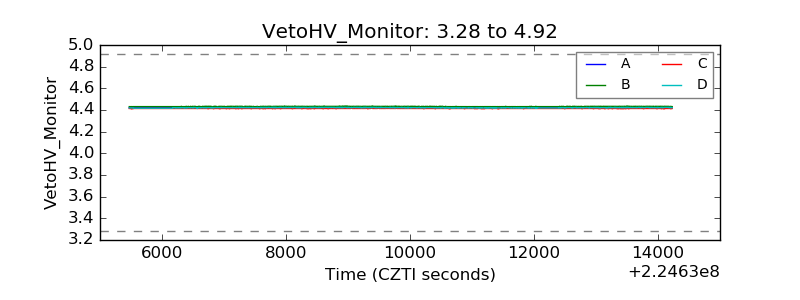 |
| Veto LLD | 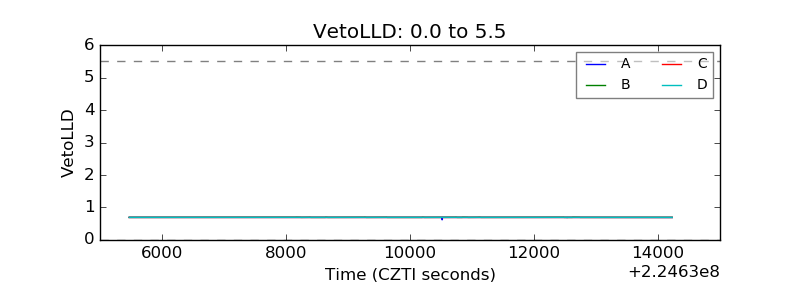 |
| Alpha Counter | 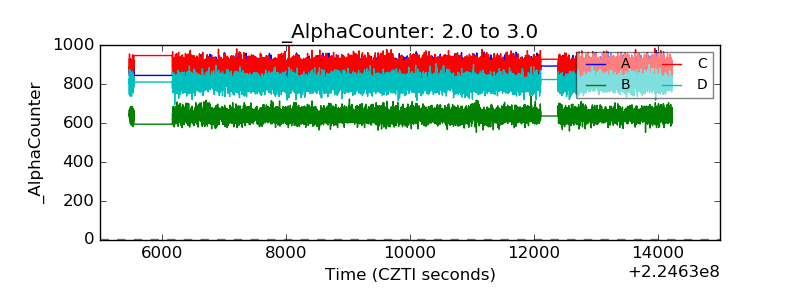 |
| _CPM_Rate | 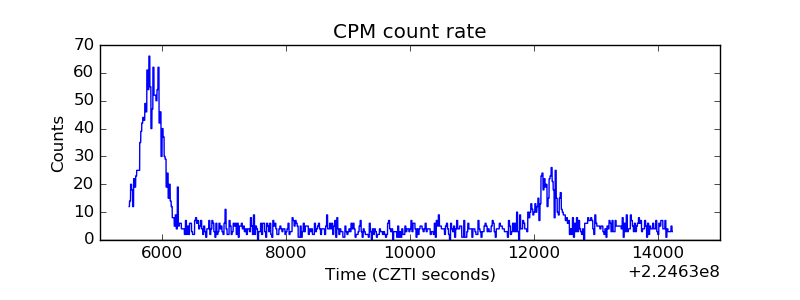 |
| CZT Counter | 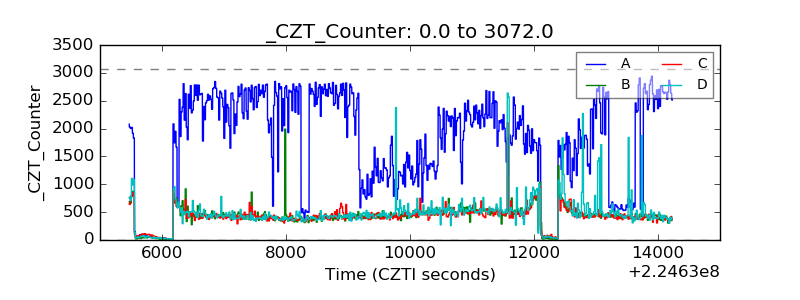 |
| +2.5 Volts monitor |  |
| +5 Volts monitor |  |
| _ROLL_ROT | 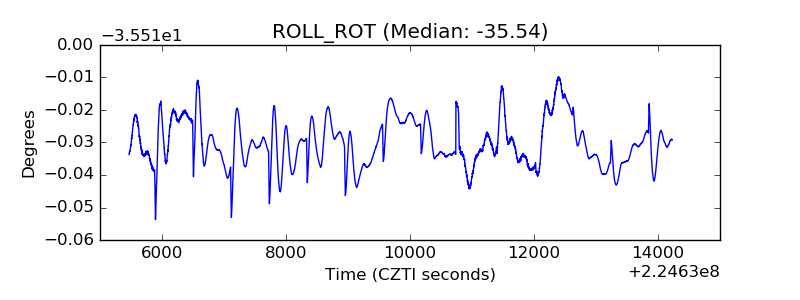 |
| _Roll_DEC | 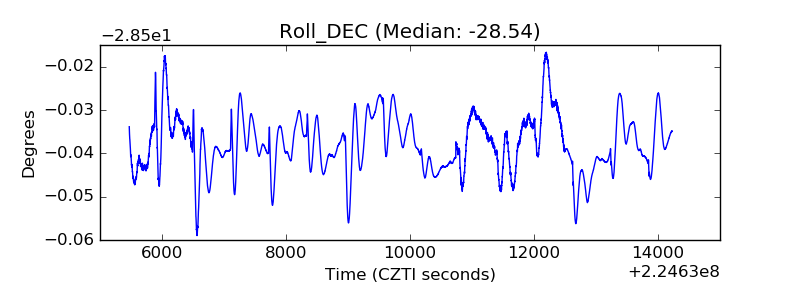 |
| _Roll_RA | 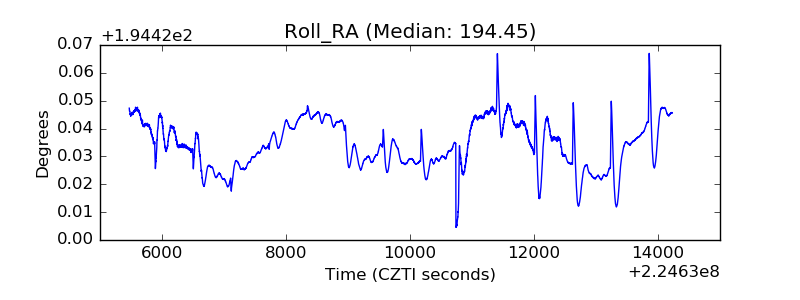 |
| Veto Counter | 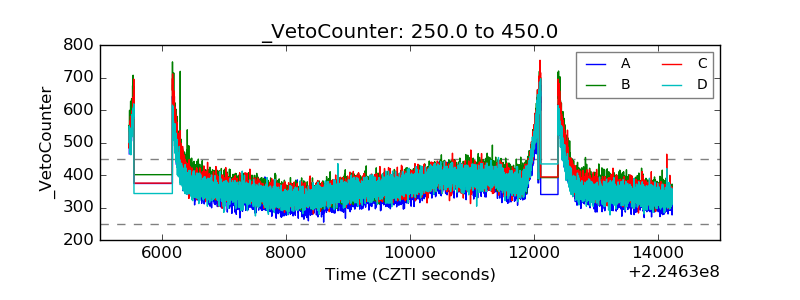 |