| Param | Original file | Final file |
|---|---|---|
| Filename | modeM0/AS1A02_108T01_9000001024_07459cztM0_level2.evt | modeM0/AS1A02_108T01_9000001024_07459cztM0_level2_quad_clean.evt |
| Size (bytes) | 892,468,800 | 96,045,120 |
| Size | 851.1 MB | 91.6 MB |
| Events in quadrant A | 14,645,425 | 473,323 |
| Events in quadrant B | 3,609,884 | 656,629 |
| Events in quadrant C | 3,820,017 | 633,480 |
| Events in quadrant D | 4,433,043 | 608,645 |
| Mode SS | |||
|---|---|---|---|
| Quadrant | BADHDUFLAG | Total packets | Discarded packets |
| A | 0 | 156 | 0 |
| B | 0 | 156 | 0 |
| C | 0 | 156 | 0 |
| D | 0 | 156 | 0 |
| Mode M9 | |||
|---|---|---|---|
| Quadrant | BADHDUFLAG | Total packets | Discarded packets |
| A | 0 | 3 | 0 |
| B | 0 | 3 | 0 |
| C | 0 | 3 | 0 |
| D | 0 | 3 | 0 |
| Mode M0 | |||
|---|---|---|---|
| Quadrant | BADHDUFLAG | Total packets | Discarded packets |
| A | 0 | 48868 | 2 |
| B | 0 | 16109 | 1 |
| C | 0 | 16809 | 1 |
| D | 0 | 18444 | 1 |
| Quadrant | Total seconds | Saturated seconds | Saturation percentage |
|---|---|---|---|
| A | 7692 | 4525 | 58.827353% |
| B | 7692 | 88 | 1.144046% |
| C | 7692 | 144 | 1.872075% |
| D | 7692 | 254 | 3.302132% |
Noise dominated data is calculated using 1-second bins in cleaned event files. If a bin has >2000 counts, and if more than 50% of those come from <1% of pixels, then it is considered to be noise-dominated and hence unusable.
| Quadrant | # 1 sec bins | Bins with >0 counts | Bins with >2000 counts | High rate bins dominated by noise | Noise dominated (total time) | Noise dominated (detector-on time) | Marked lightcurve |
|---|---|---|---|---|---|---|---|
| A | 7957 | 7693 | 3934 | 3934 | 49.44% | 51.14% | 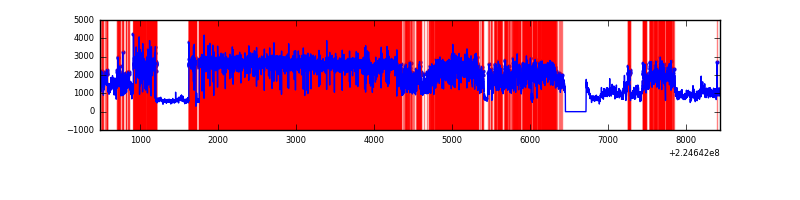 |
| B | 7957 | 7693 | 8 | 8 | 0.10% | 0.10% | 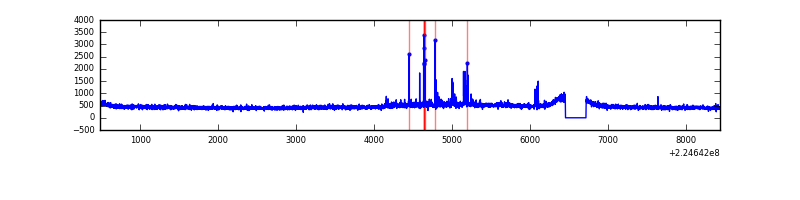 |
| C | 7957 | 7693 | 57 | 57 | 0.72% | 0.74% | 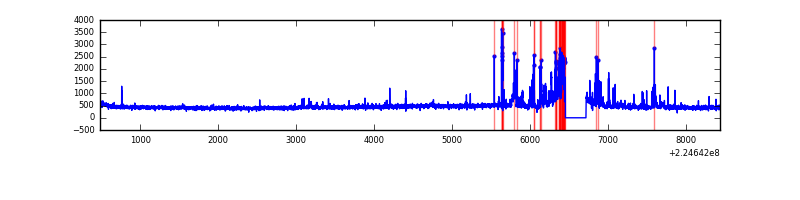 |
| D | 7957 | 7693 | 143 | 143 | 1.80% | 1.86% | 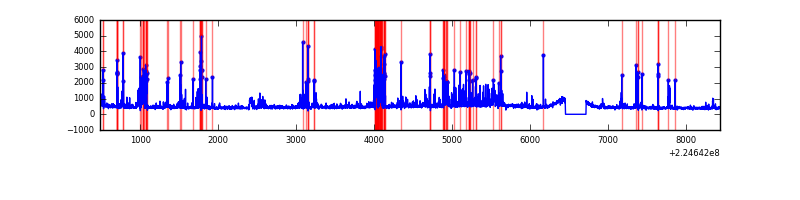 |
Top three noisy pixels from each quadrant. If the there are fewer than three noisy pixels in the level2.evt file, extra rows are filled as -1
| Pixel properties | Quadrant properties | ||||||
|---|---|---|---|---|---|---|---|
| Quadrant | DetID | PixID | Counts | Sigma | Mean | Median | Sigma |
| A | 15 | 239 | 11860170 | 86262.67 | 673 | 658 | 137.5 |
| A | 15 | 234 | 179632 | 1301.81 | 673 | 658 | 137.5 |
| A | 0 | 128 | 11339 | 77.69 | 673 | 658 | 137.5 |
| B | 0 | 214 | 113212 | 655.52 | 897 | 875 | 171.4 |
| B | 12 | 111 | 18509 | 102.9 | 897 | 875 | 171.4 |
| B | 11 | 111 | 14592 | 80.04 | 897 | 875 | 171.4 |
| C | 1 | 16 | 370994 | 1835.07 | 862 | 867 | 201.7 |
| C | 10 | 22 | 54425 | 265.54 | 862 | 867 | 201.7 |
| C | 9 | 68 | 25161 | 120.45 | 862 | 867 | 201.7 |
| D | 1 | 52 | 310667 | 1491.62 | 853 | 827 | 207.7 |
| D | 2 | 136 | 260419 | 1249.72 | 853 | 827 | 207.7 |
| D | 2 | 14 | 190049 | 910.95 | 853 | 827 | 207.7 |
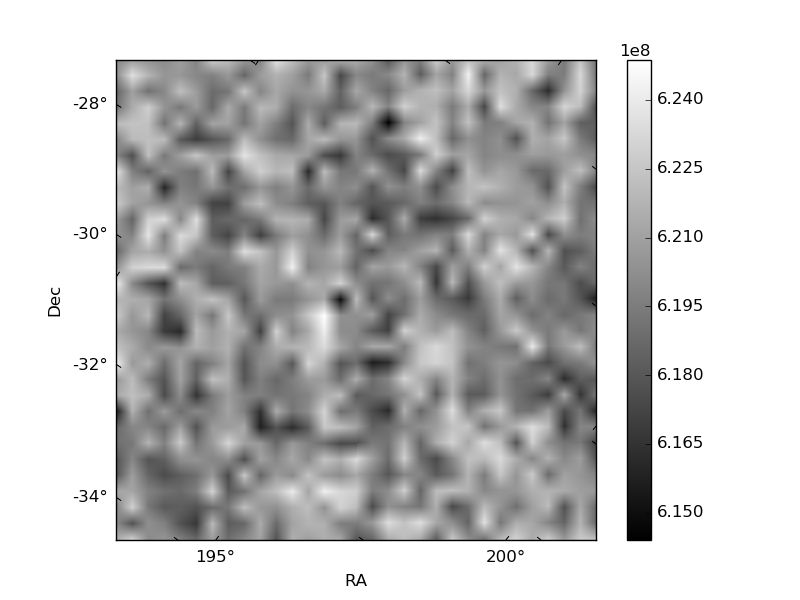
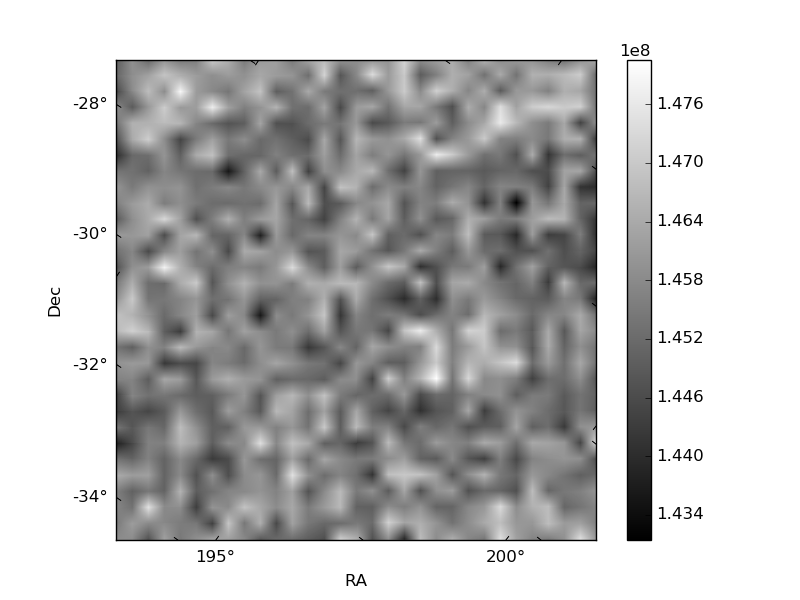
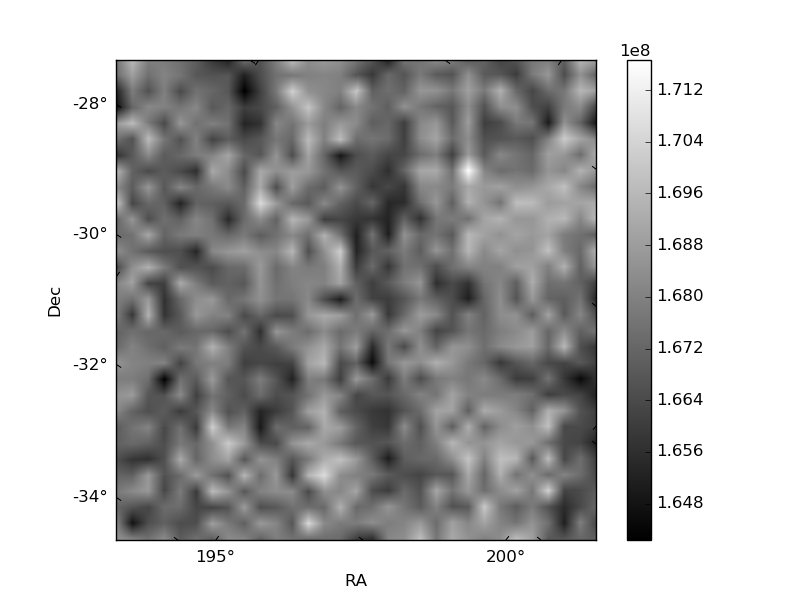
Histogram calculated using DETX and DETY for each event in the final _common_clean file
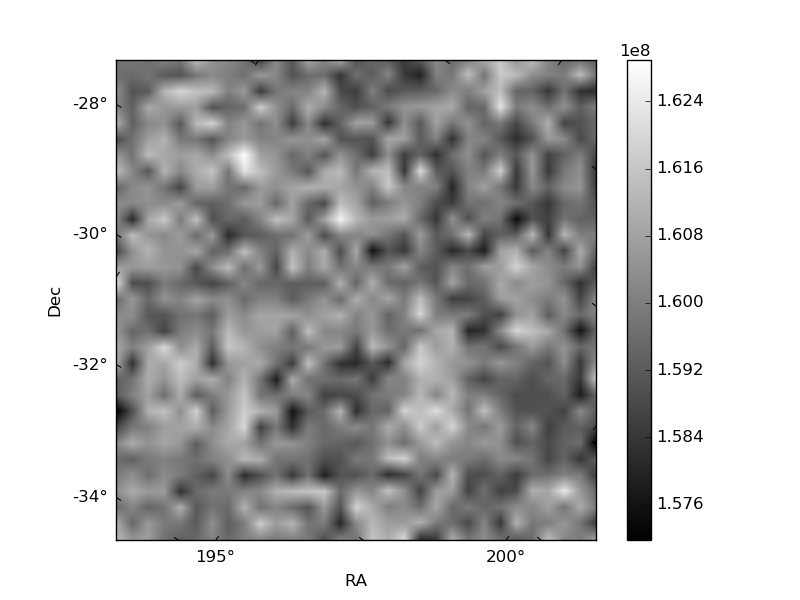
| Quadrant A | 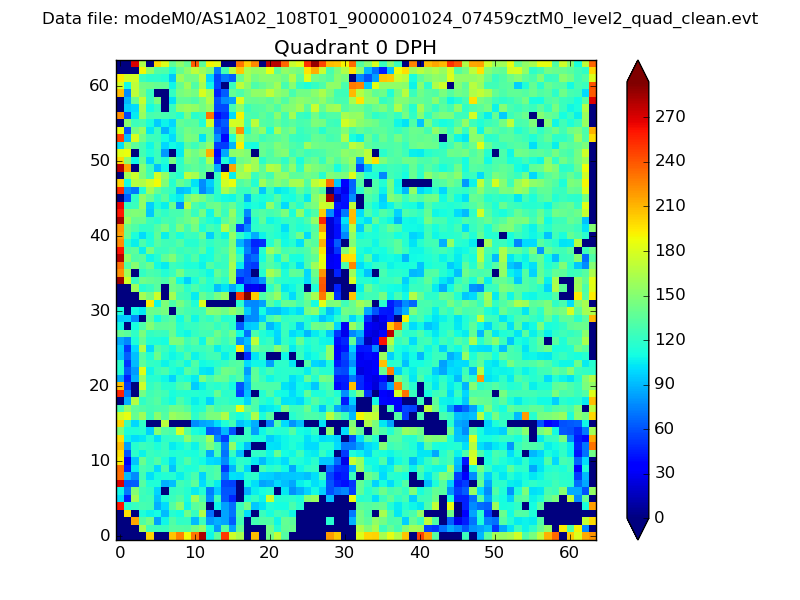 |
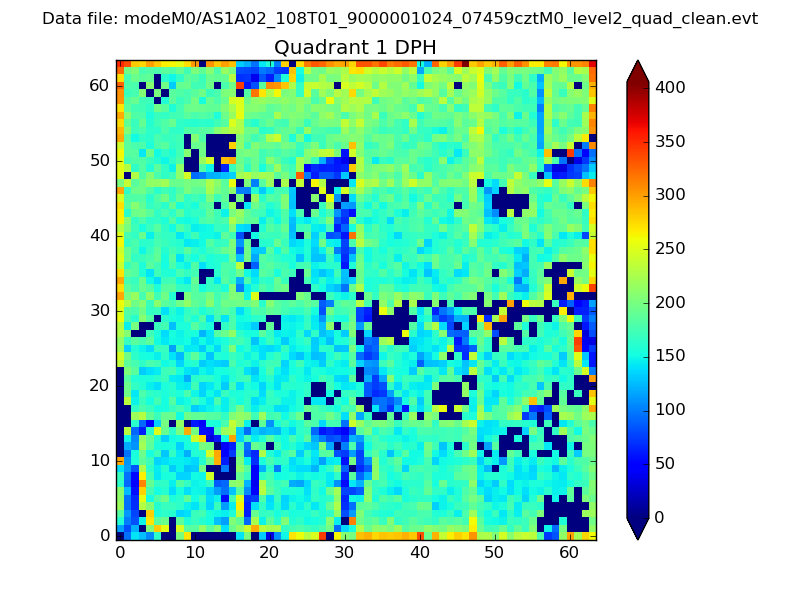 |
Quadrant B |
|---|---|---|---|
| Quadrant D | 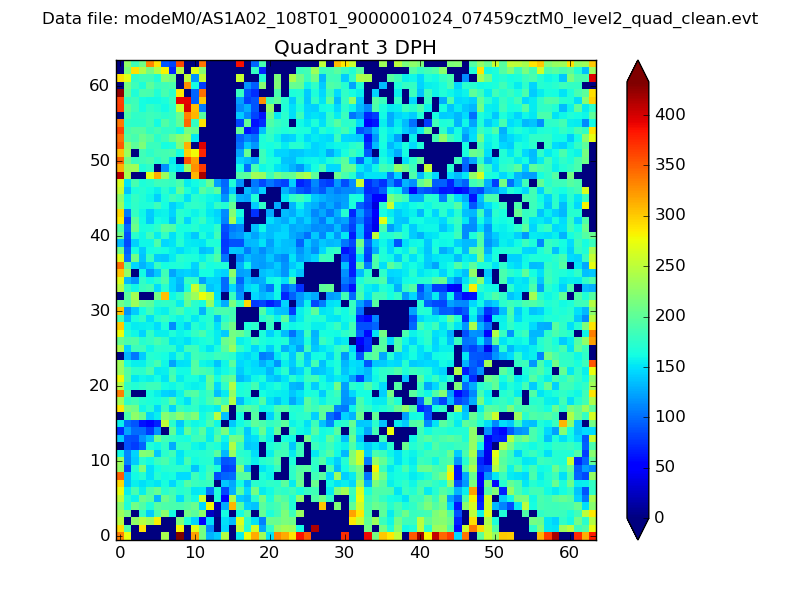 |
 |
Quadrant C |
| Plot type | Count rate plots | Images |
|---|---|---|
| Comparison with Poisson distribution Blue bars denote a histogram of data divided into 1 sec bins. Red curve is a Poisson curve with rate = median count rate of data. |
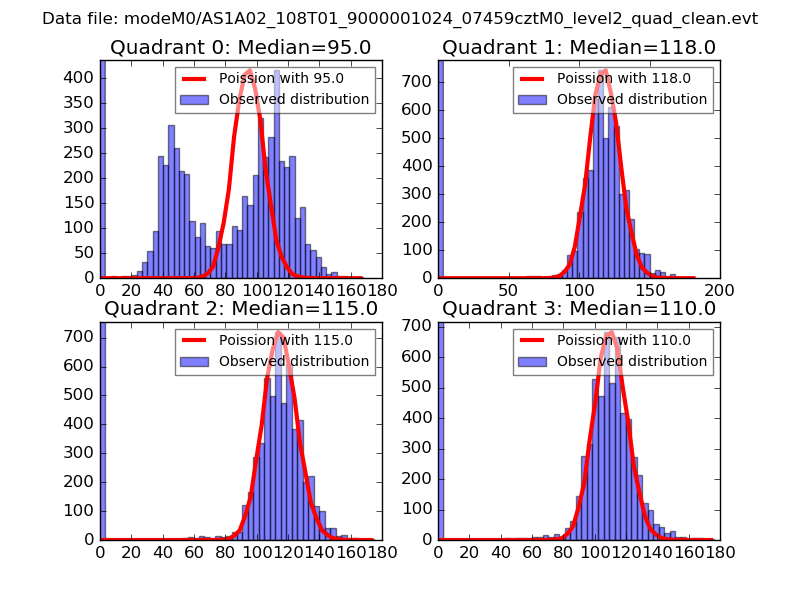 |
 |
| Quadrant-wise count rates Data is divided into 100 sec bins |
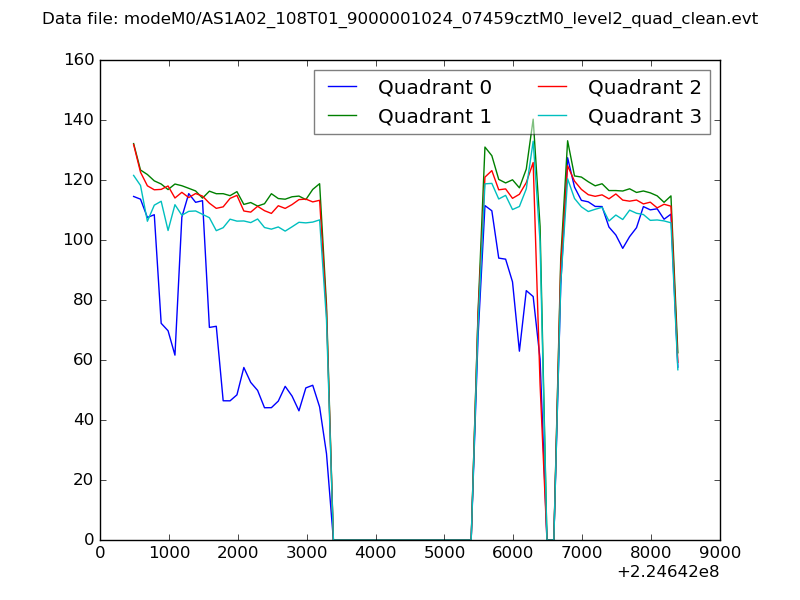 |
|
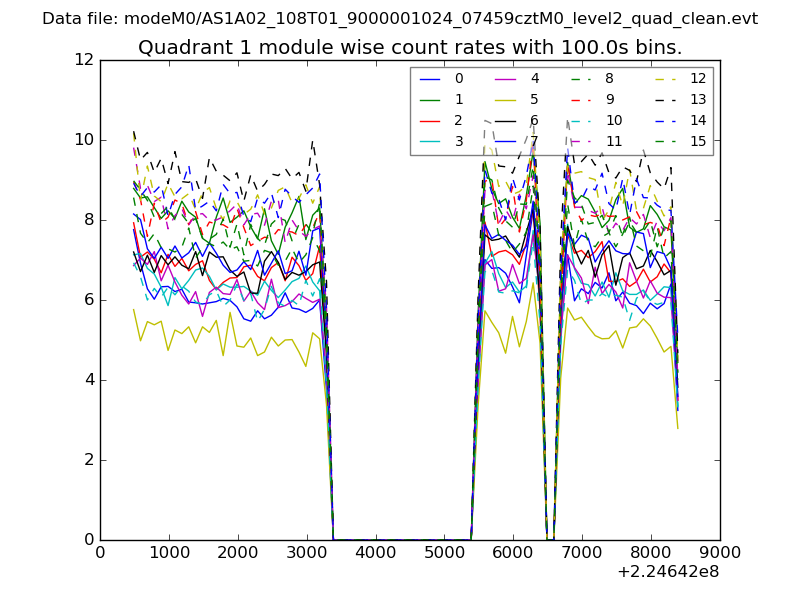
| Module-wise count rates for Quadrant A Data is divided into 100 sec bins |
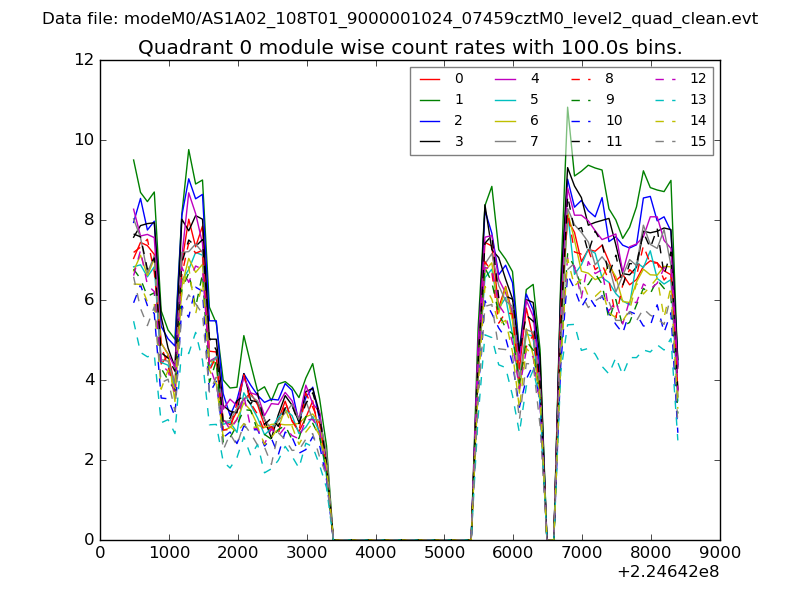 |
 |
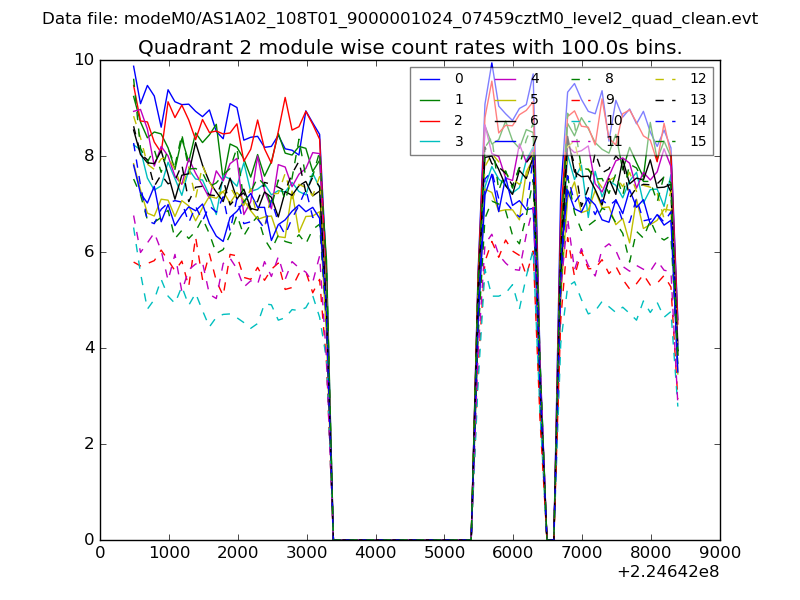
| Module-wise count rates for Quadrant B Data is divided into 100 sec bins |
 |
 |
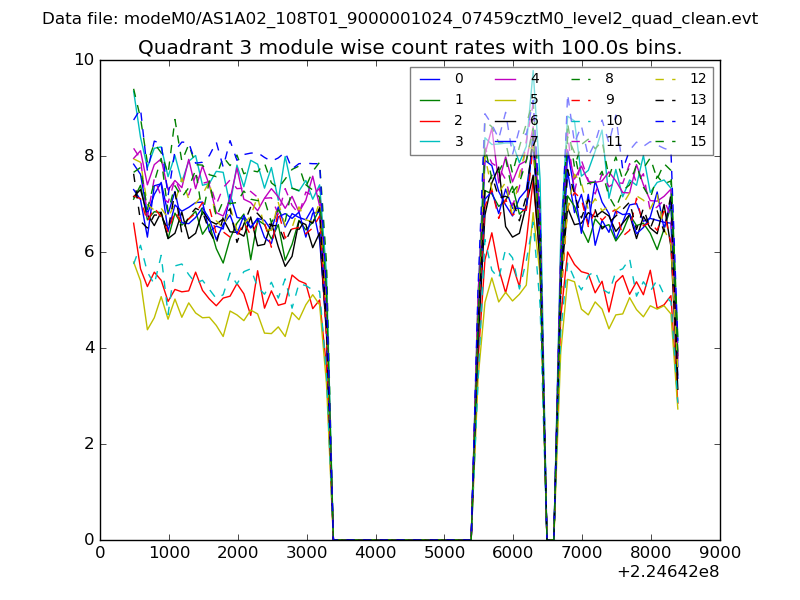
| Module-wise count rates for Quadrant C Data is divided into 100 sec bins |
 |
 |
| Module-wise count rates for Quadrant D Data is divided into 100 sec bins |
 |
 |
| Parameter | Plot |
|---|---|
| CZT HV Monitor | 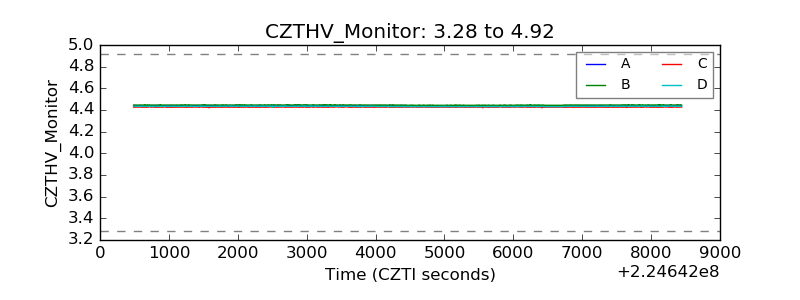 |
| D_VDD | 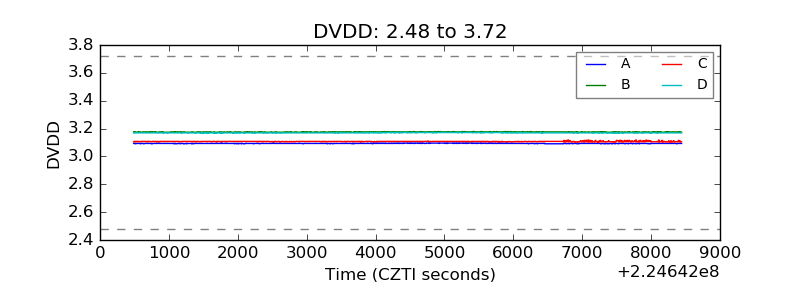 |
| Temperature 1 | 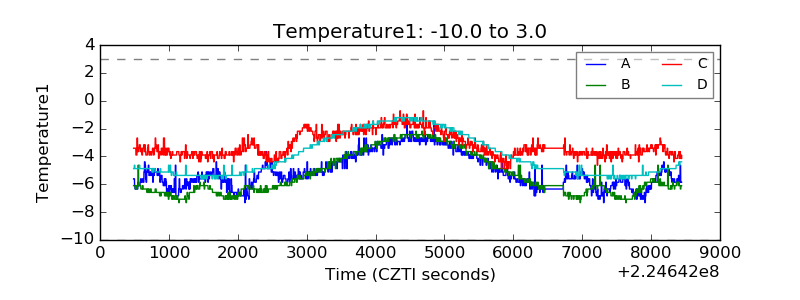 |
| Veto HV Monitor |  |
| Veto LLD | 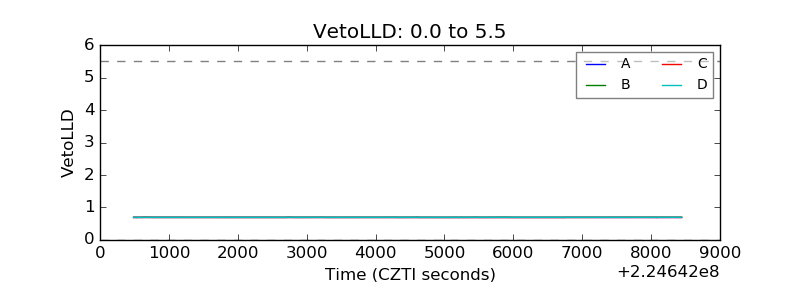 |
| Alpha Counter | 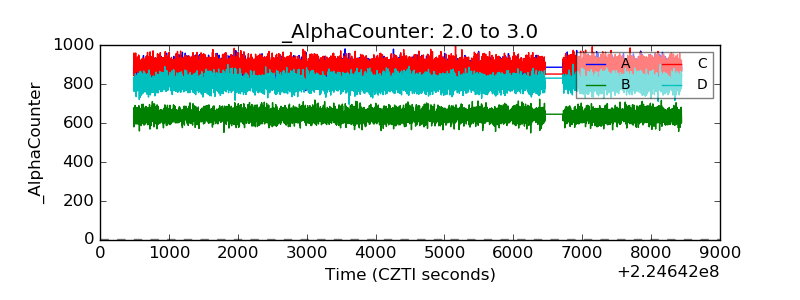 |
| _CPM_Rate | 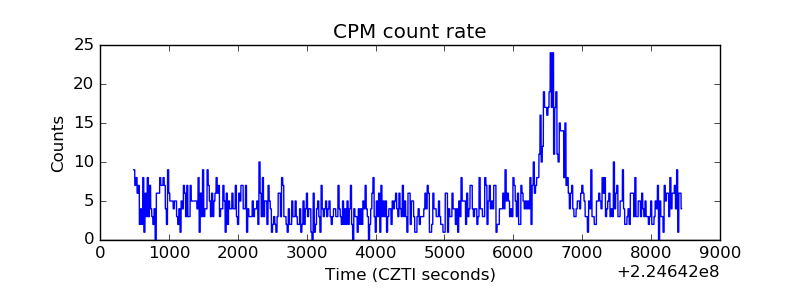 |
| CZT Counter |  |
| +2.5 Volts monitor |  |
| +5 Volts monitor |  |
| _ROLL_ROT | 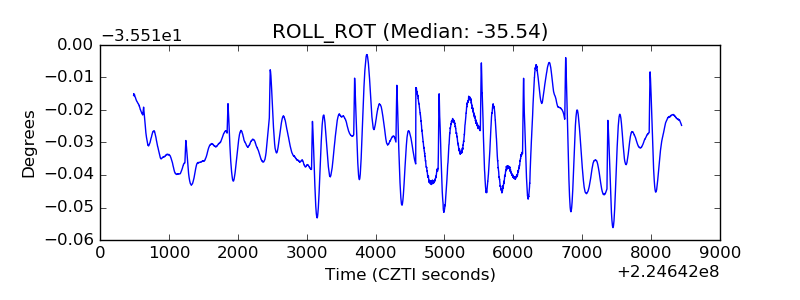 |
| _Roll_DEC | 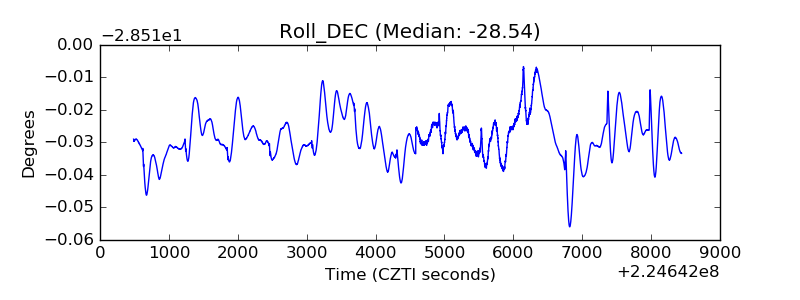 |
| _Roll_RA | 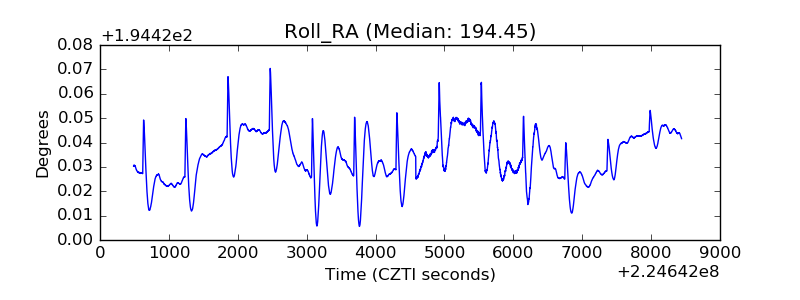 |
| Veto Counter | 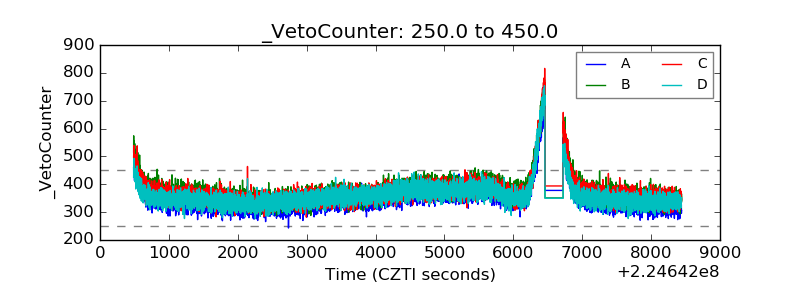 |