| Param | Original file | Final file |
|---|---|---|
| Filename | modeM0/AS1A02_108T01_9000001024_07462cztM0_level2.evt | modeM0/AS1A02_108T01_9000001024_07462cztM0_level2_quad_clean.evt |
| Size (bytes) | 661,668,480 | 88,087,680 |
| Size | 631.0 MB | 84.0 MB |
| Events in quadrant A | 9,738,587 | 505,296 |
| Events in quadrant B | 3,222,879 | 576,430 |
| Events in quadrant C | 3,215,974 | 561,618 |
| Events in quadrant D | 3,385,944 | 535,476 |
| Mode SS | |||
|---|---|---|---|
| Quadrant | BADHDUFLAG | Total packets | Discarded packets |
| A | 0 | 142 | 0 |
| B | 0 | 142 | 0 |
| C | 0 | 142 | 0 |
| D | 0 | 142 | 0 |
| Mode M9 | |||
|---|---|---|---|
| Quadrant | BADHDUFLAG | Total packets | Discarded packets |
| A | 0 | 4 | 0 |
| B | 0 | 4 | 0 |
| C | 0 | 4 | 0 |
| D | 0 | 4 | 0 |
| Mode M0 | |||
|---|---|---|---|
| Quadrant | BADHDUFLAG | Total packets | Discarded packets |
| A | 0 | 33822 | 2 |
| B | 0 | 14421 | 1 |
| C | 0 | 14485 | 1 |
| D | 0 | 14903 | 1 |
| Quadrant | Total seconds | Saturated seconds | Saturation percentage |
|---|---|---|---|
| A | 7013 | 2490 | 35.505490% |
| B | 7013 | 59 | 0.841295% |
| C | 7013 | 56 | 0.798517% |
| D | 7013 | 72 | 1.026665% |
Noise dominated data is calculated using 1-second bins in cleaned event files. If a bin has >2000 counts, and if more than 50% of those come from <1% of pixels, then it is considered to be noise-dominated and hence unusable.
| Quadrant | # 1 sec bins | Bins with >0 counts | Bins with >2000 counts | High rate bins dominated by noise | Noise dominated (total time) | Noise dominated (detector-on time) | Marked lightcurve |
|---|---|---|---|---|---|---|---|
| A | 7423 | 7014 | 2367 | 2367 | 31.89% | 33.75% | 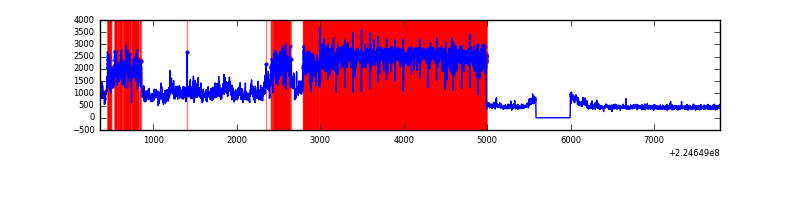 |
| B | 7423 | 7014 | 2 | 2 | 0.03% | 0.03% | 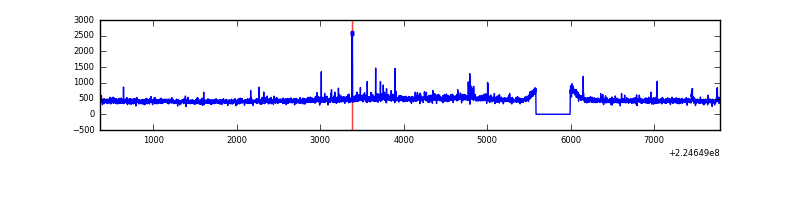 |
| C | 7423 | 7014 | 10 | 10 | 0.13% | 0.14% | 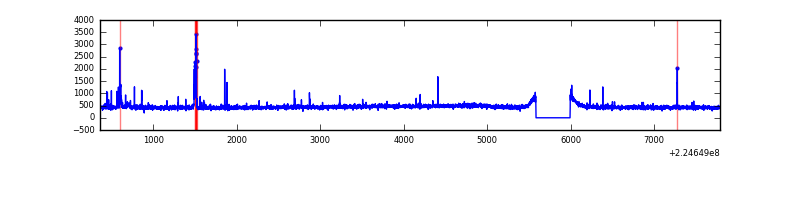 |
| D | 7423 | 7014 | 26 | 26 | 0.35% | 0.37% | 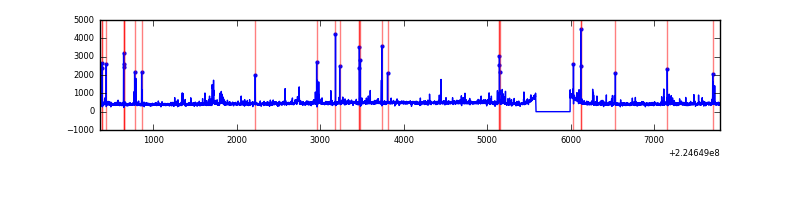 |
Top three noisy pixels from each quadrant. If the there are fewer than three noisy pixels in the level2.evt file, extra rows are filled as -1
| Pixel properties | Quadrant properties | ||||||
|---|---|---|---|---|---|---|---|
| Quadrant | DetID | PixID | Counts | Sigma | Mean | Median | Sigma |
| A | 15 | 239 | 6963257 | 51513.19 | 659 | 644 | 135.2 |
| A | 15 | 234 | 230463 | 1700.33 | 659 | 644 | 135.2 |
| A | 0 | 226 | 6191 | 41.04 | 659 | 644 | 135.2 |
| B | 0 | 214 | 58072 | 368.92 | 808 | 787 | 155.3 |
| B | 12 | 111 | 16430 | 100.74 | 808 | 787 | 155.3 |
| B | 4 | 81 | 15965 | 97.75 | 808 | 787 | 155.3 |
| C | 1 | 16 | 117997 | 633.5 | 788 | 790 | 185.0 |
| C | 8 | 128 | 14350 | 73.29 | 788 | 790 | 185.0 |
| C | 8 | 112 | 6307 | 29.82 | 788 | 790 | 185.0 |
| D | 12 | 221 | 146431 | 760.26 | 780 | 755 | 191.6 |
| D | 1 | 52 | 87519 | 452.81 | 780 | 755 | 191.6 |
| D | 5 | 233 | 81677 | 422.32 | 780 | 755 | 191.6 |
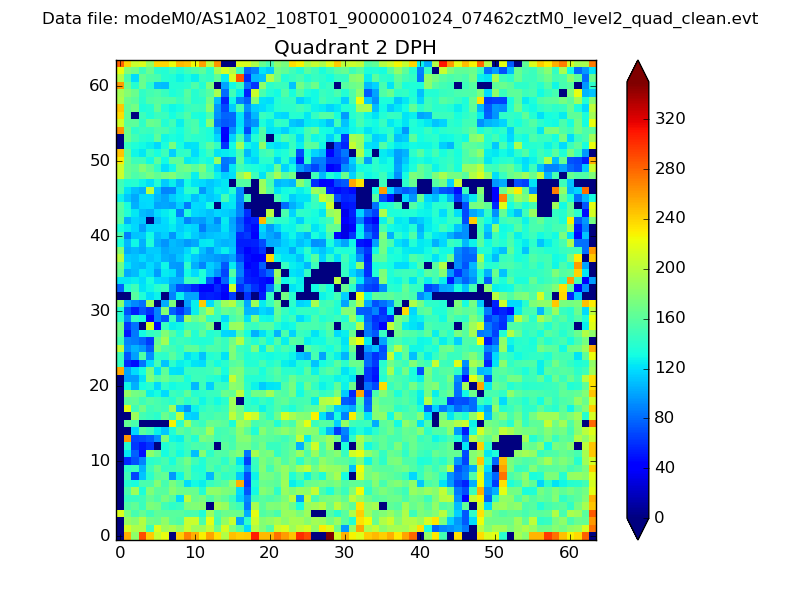
Histogram calculated using DETX and DETY for each event in the final _common_clean file
| Quadrant A | 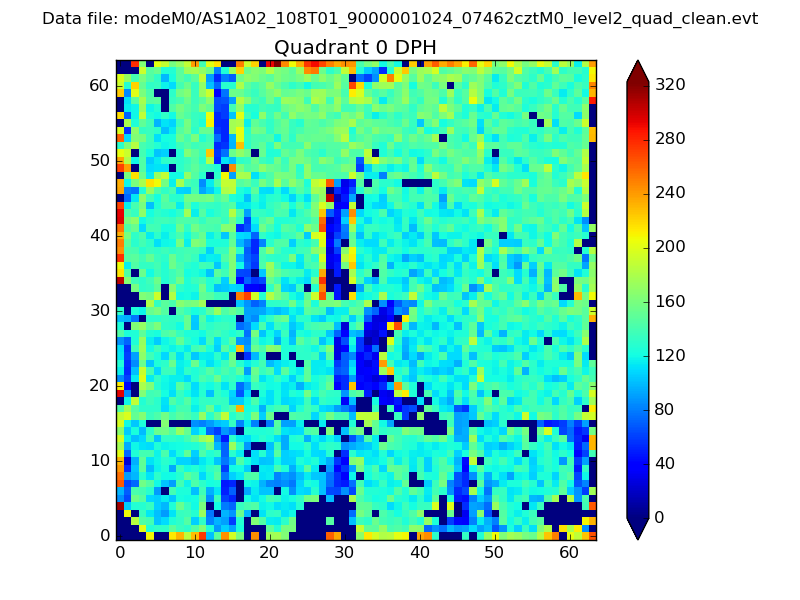 |
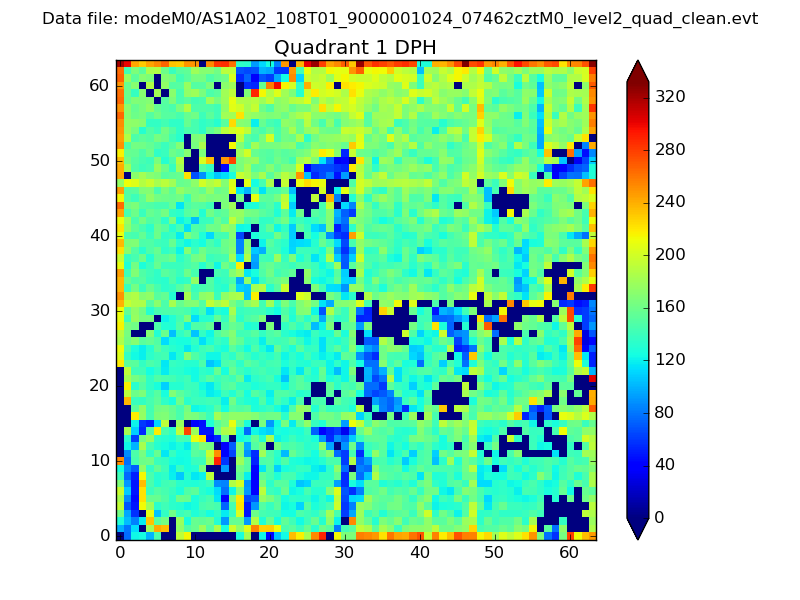 |
Quadrant B |
|---|---|---|---|
| Quadrant D | 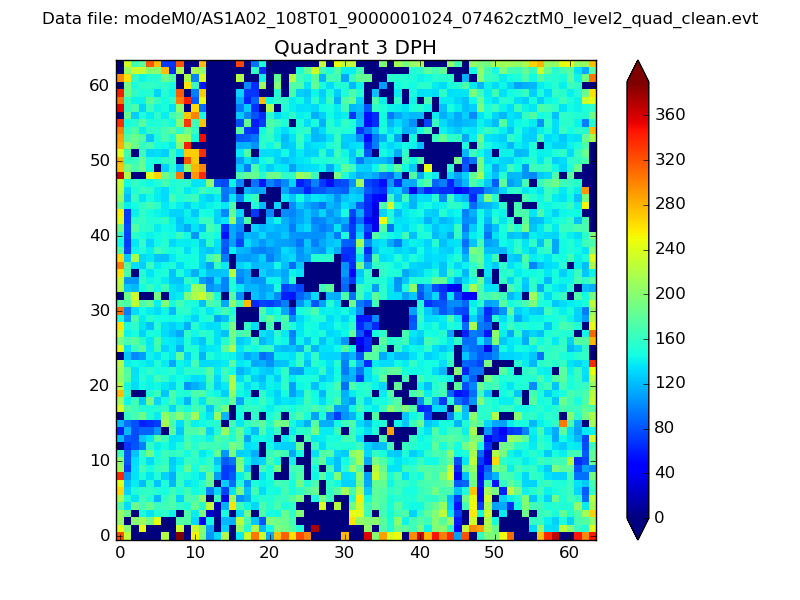 |
 |
Quadrant C |
| Plot type | Count rate plots | Images |
|---|---|---|
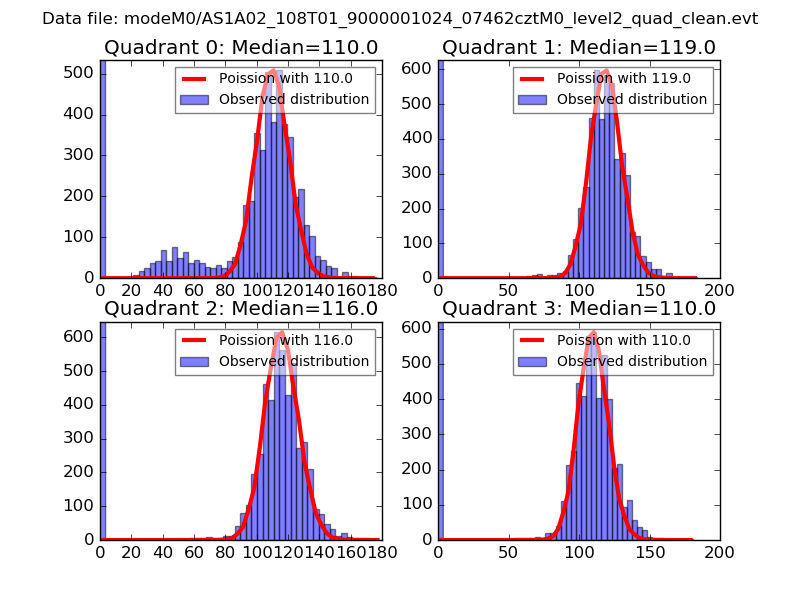
| Comparison with Poisson distribution Blue bars denote a histogram of data divided into 1 sec bins. Red curve is a Poisson curve with rate = median count rate of data. |
 |
 |
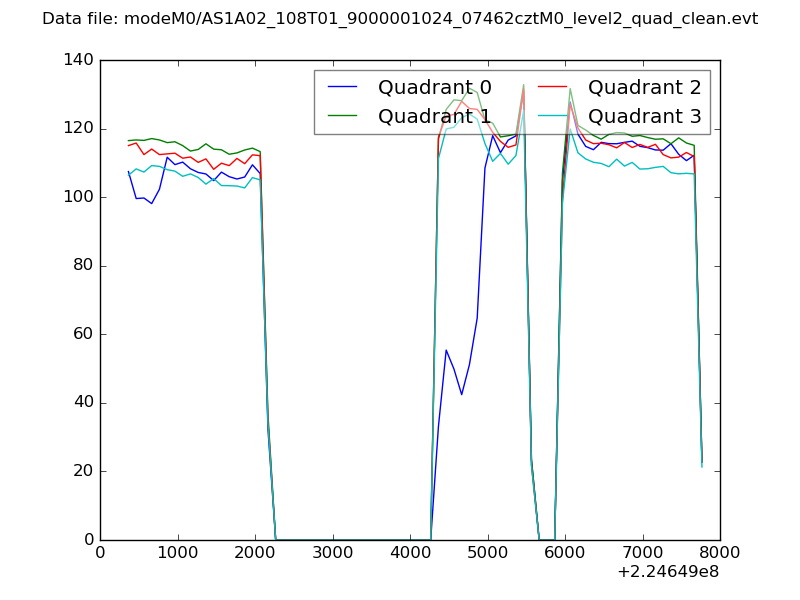
| Quadrant-wise count rates Data is divided into 100 sec bins |
 |
|
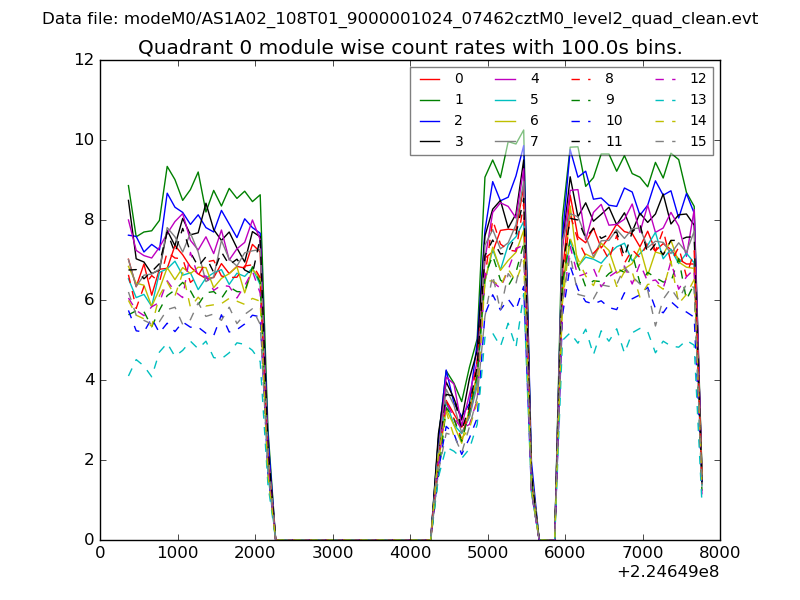
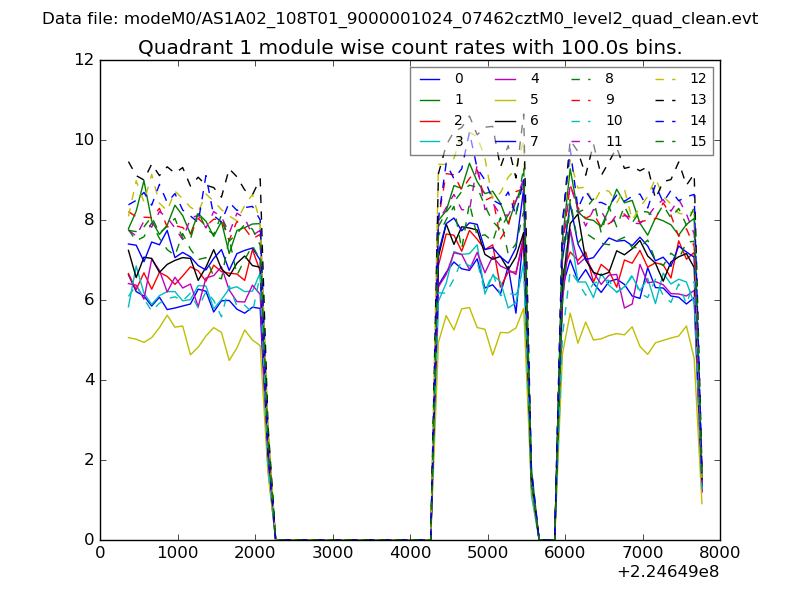
| Module-wise count rates for Quadrant A Data is divided into 100 sec bins |
 |
 |
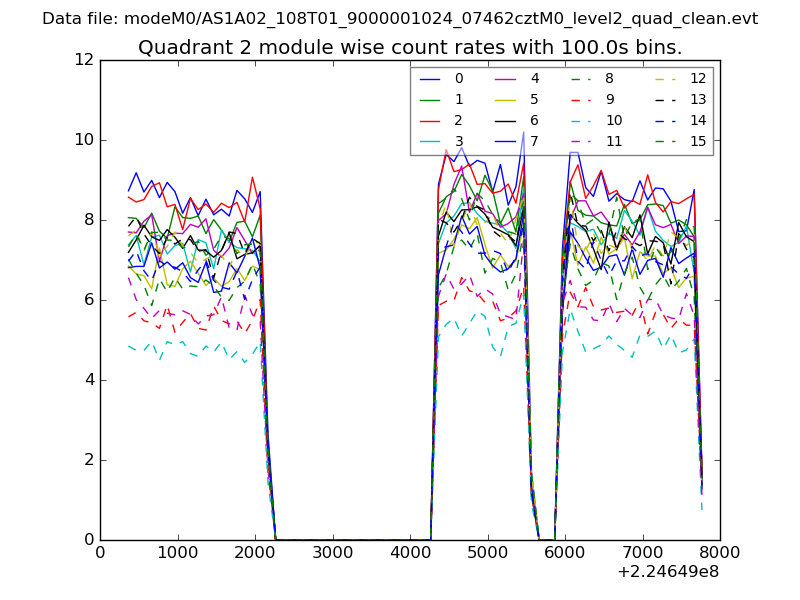
| Module-wise count rates for Quadrant B Data is divided into 100 sec bins |
 |
 |
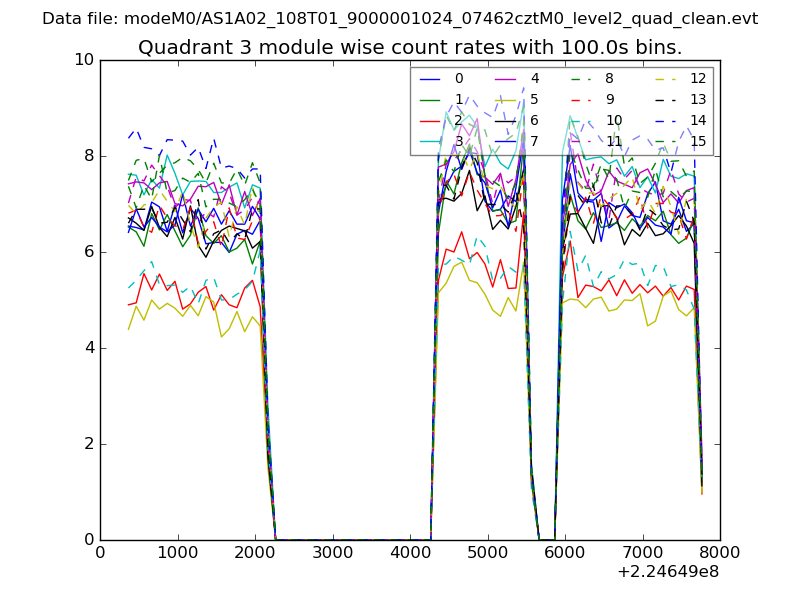
| Module-wise count rates for Quadrant C Data is divided into 100 sec bins |
 |
 |
| Module-wise count rates for Quadrant D Data is divided into 100 sec bins |
 |
 |
| Parameter | Plot |
|---|---|
| CZT HV Monitor | 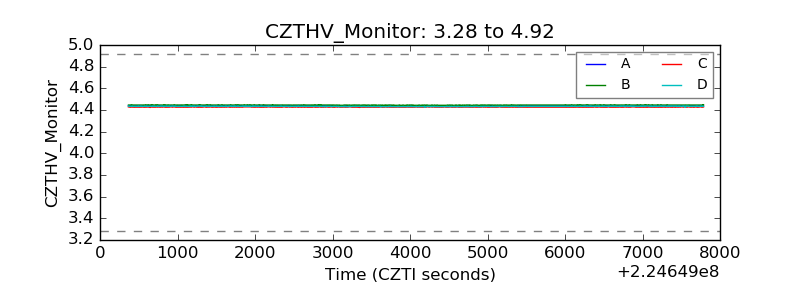 |
| D_VDD | 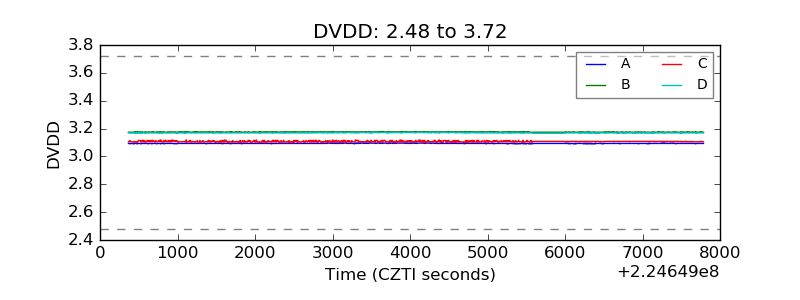 |
| Temperature 1 | 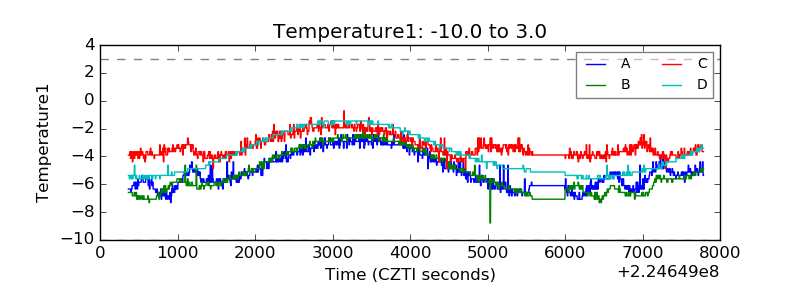 |
| Veto HV Monitor | 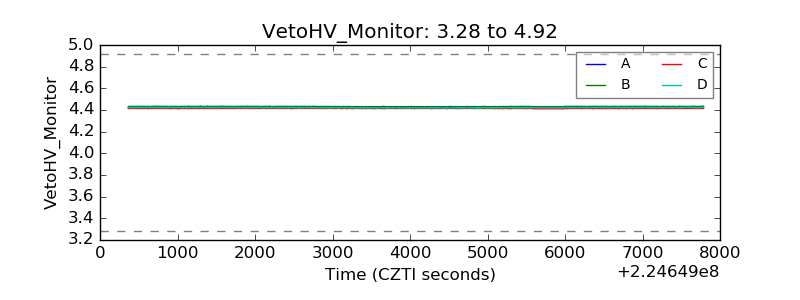 |
| Veto LLD | 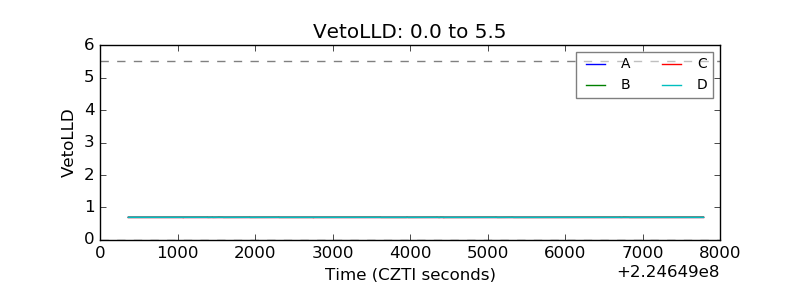 |
| Alpha Counter | 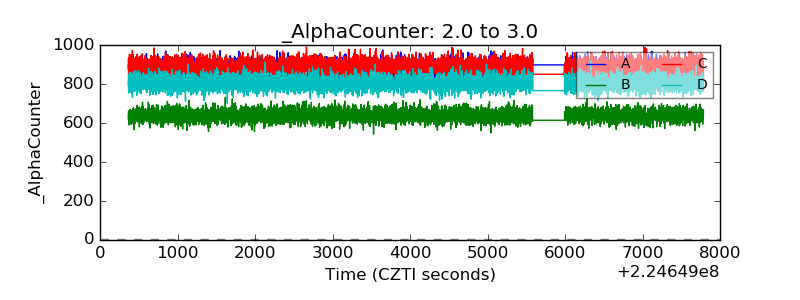 |
| _CPM_Rate | 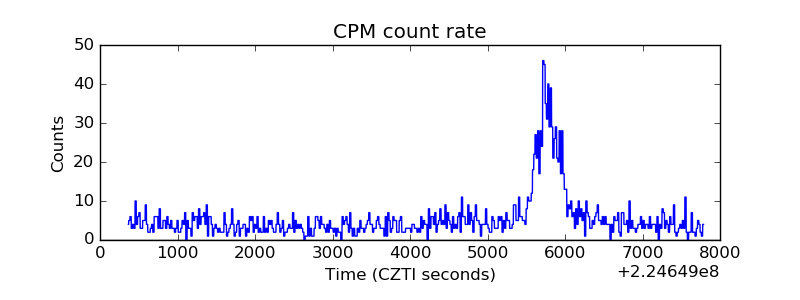 |
| CZT Counter | 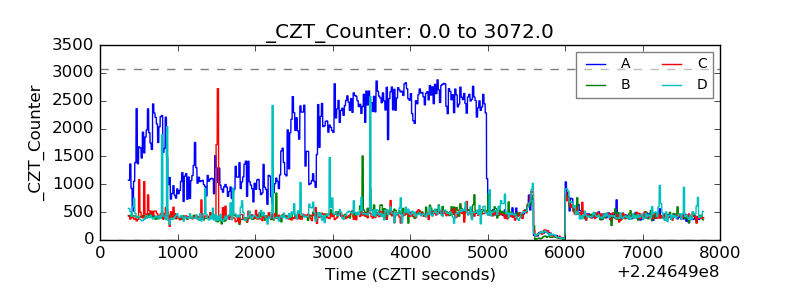 |
| +2.5 Volts monitor |  |
| +5 Volts monitor |  |
| _ROLL_ROT | 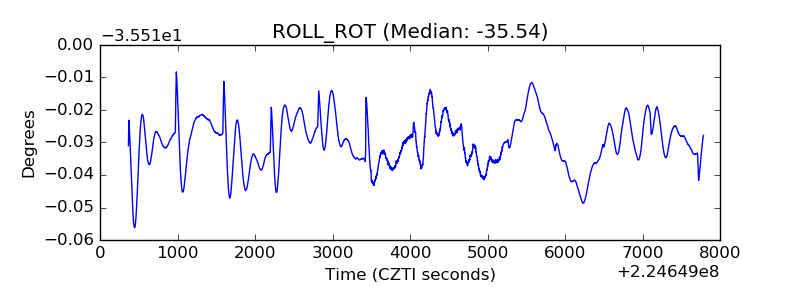 |
| _Roll_DEC | 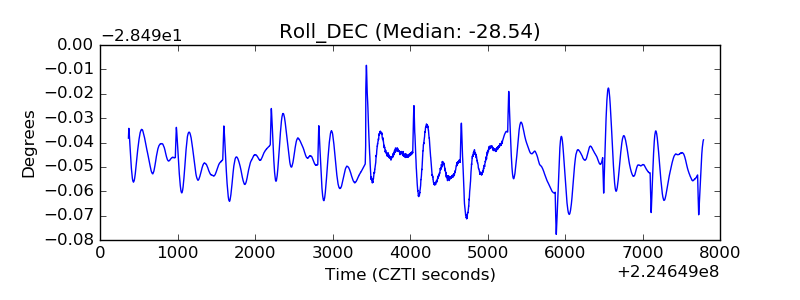 |
| _Roll_RA | 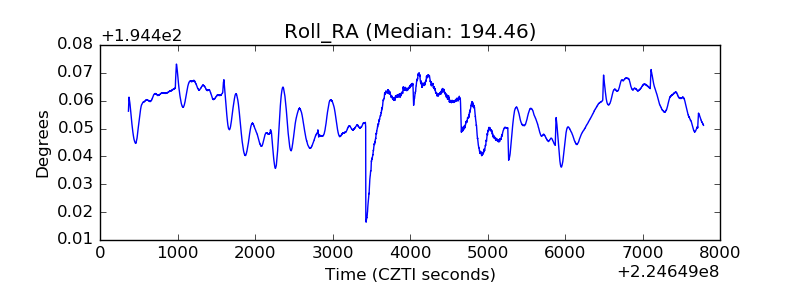 |
| Veto Counter | 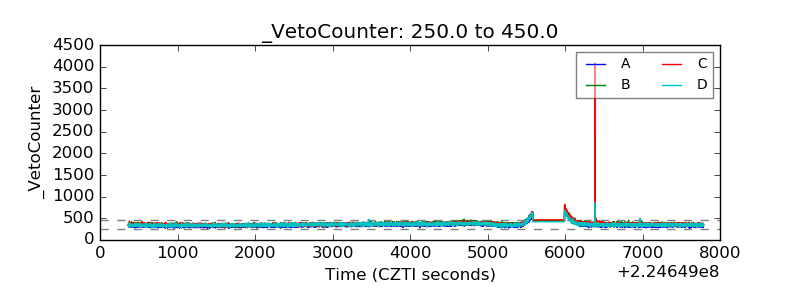 |