| Param | Original file | Final file |
|---|---|---|
| Filename | modeM0/AS1A02_108T01_9000001024_07463cztM0_level2.evt | modeM0/AS1A02_108T01_9000001024_07463cztM0_level2_quad_clean.evt |
| Size (bytes) | 1,025,078,400 | 182,030,400 |
| Size | 977.6 MB | 173.6 MB |
| Events in quadrant A | 7,252,563 | 1,115,333 |
| Events in quadrant B | 7,412,942 | 1,138,034 |
| Events in quadrant C | 7,067,214 | 1,112,103 |
| Events in quadrant D | 8,245,349 | 1,060,625 |
| Mode SS | |||
|---|---|---|---|
| Quadrant | BADHDUFLAG | Total packets | Discarded packets |
| A | 0 | 320 | 0 |
| B | 0 | 320 | 0 |
| C | 0 | 320 | 0 |
| D | 0 | 320 | 0 |
| Mode M9 | |||
|---|---|---|---|
| Quadrant | BADHDUFLAG | Total packets | Discarded packets |
| A | 0 | 23 | 0 |
| B | 0 | 23 | 0 |
| C | 0 | 23 | 0 |
| D | 0 | 23 | 0 |
| Mode M0 | |||
|---|---|---|---|
| Quadrant | BADHDUFLAG | Total packets | Discarded packets |
| A | 0 | 32193 | 4 |
| B | 0 | 32407 | 3 |
| C | 0 | 32008 | 3 |
| D | 0 | 34532 | 3 |
| Quadrant | Total seconds | Saturated seconds | Saturation percentage |
|---|---|---|---|
| A | 15758 | 134 | 0.850362% |
| B | 15758 | 126 | 0.799594% |
| C | 15758 | 115 | 0.729788% |
| D | 15758 | 287 | 1.821297% |
Noise dominated data is calculated using 1-second bins in cleaned event files. If a bin has >2000 counts, and if more than 50% of those come from <1% of pixels, then it is considered to be noise-dominated and hence unusable.
| Quadrant | # 1 sec bins | Bins with >0 counts | Bins with >2000 counts | High rate bins dominated by noise | Noise dominated (total time) | Noise dominated (detector-on time) | Marked lightcurve |
|---|---|---|---|---|---|---|---|
| A | 18033 | 15761 | 0 | 0 | 0.00% | 0.00% | 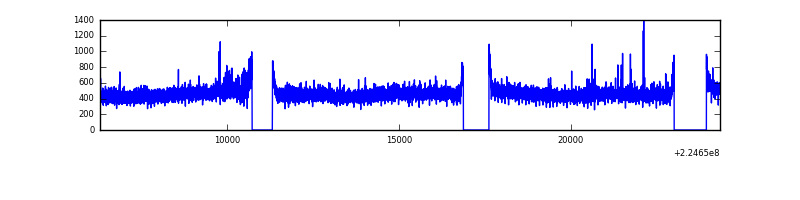 |
| B | 18033 | 15761 | 2 | 2 | 0.01% | 0.01% | 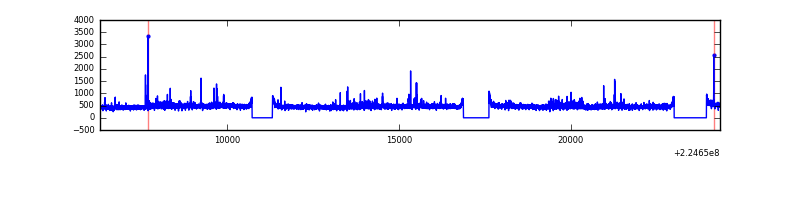 |
| C | 18033 | 15760 | 3 | 3 | 0.02% | 0.02% | 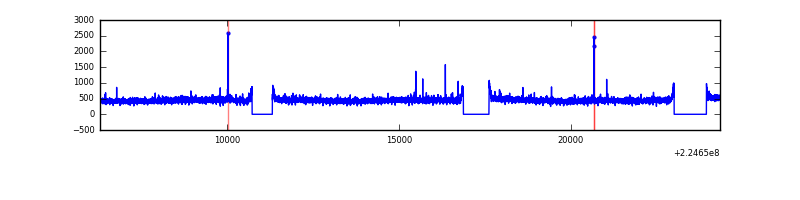 |
| D | 18033 | 15761 | 134 | 134 | 0.74% | 0.85% | 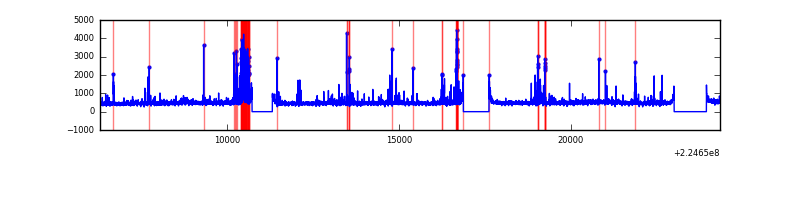 |
Top three noisy pixels from each quadrant. If the there are fewer than three noisy pixels in the level2.evt file, extra rows are filled as -1
| Pixel properties | Quadrant properties | ||||||
|---|---|---|---|---|---|---|---|
| Quadrant | DetID | PixID | Counts | Sigma | Mean | Median | Sigma |
| A | 15 | 239 | 171813 | 458.27 | 1827 | 1784 | 371.0 |
| A | 3 | 1 | 19878 | 48.77 | 1827 | 1784 | 371.0 |
| A | 0 | 226 | 17174 | 41.48 | 1827 | 1784 | 371.0 |
| B | 0 | 214 | 185040 | 523.51 | 1841 | 1796 | 350.0 |
| B | 12 | 111 | 37195 | 101.13 | 1841 | 1796 | 350.0 |
| B | 11 | 111 | 29950 | 80.43 | 1841 | 1796 | 350.0 |
| C | 1 | 16 | 35230 | 80.9 | 1787 | 1792 | 413.3 |
| C | 9 | 68 | 19714 | 43.36 | 1787 | 1792 | 413.3 |
| C | 8 | 128 | 16630 | 35.9 | 1787 | 1792 | 413.3 |
| D | 2 | 14 | 591899 | 1348.04 | 1775 | 1718 | 437.8 |
| D | 12 | 221 | 437531 | 995.45 | 1775 | 1718 | 437.8 |
| D | 8 | 195 | 175162 | 396.17 | 1775 | 1718 | 437.8 |
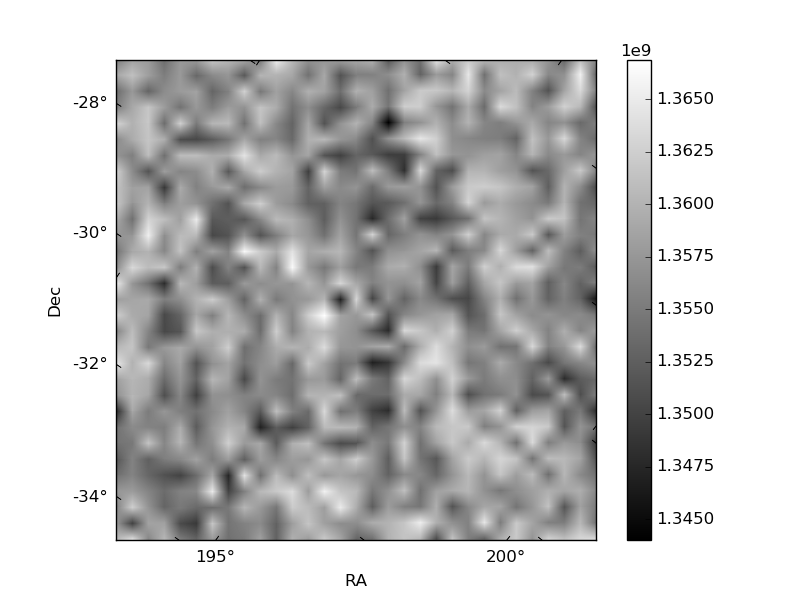
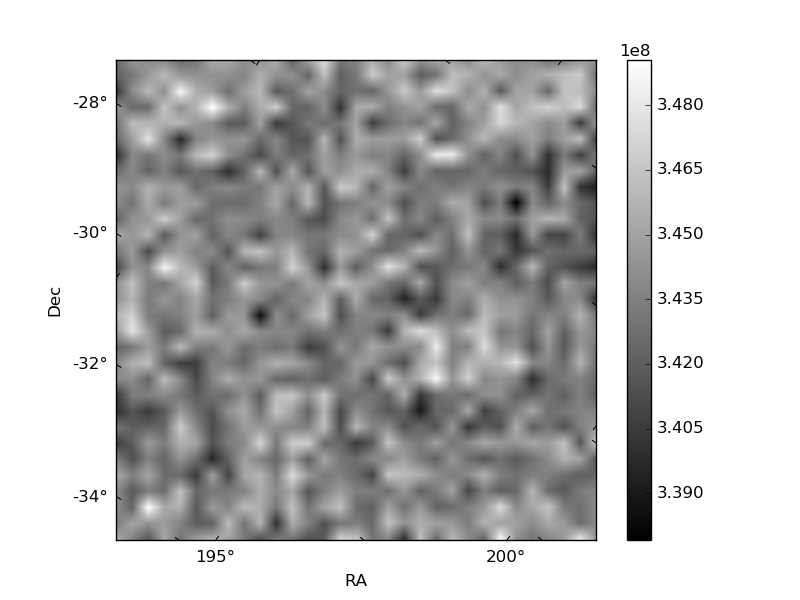
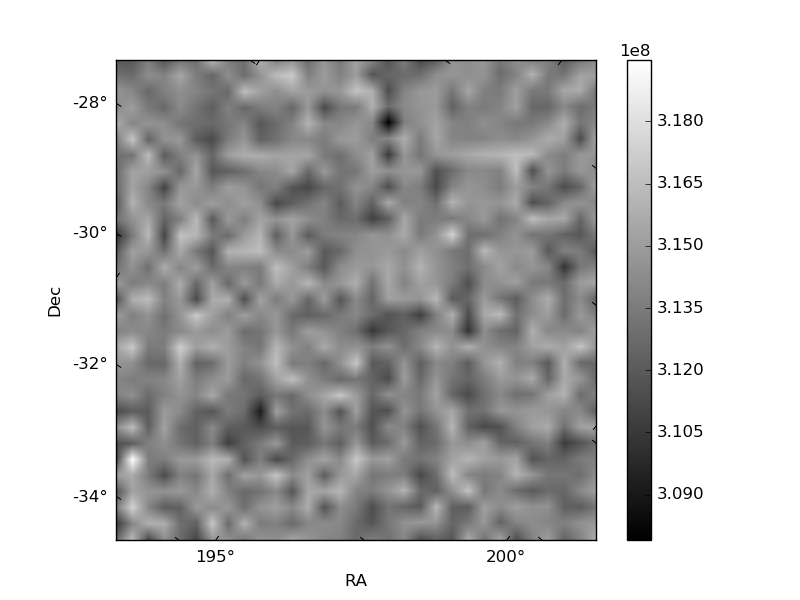
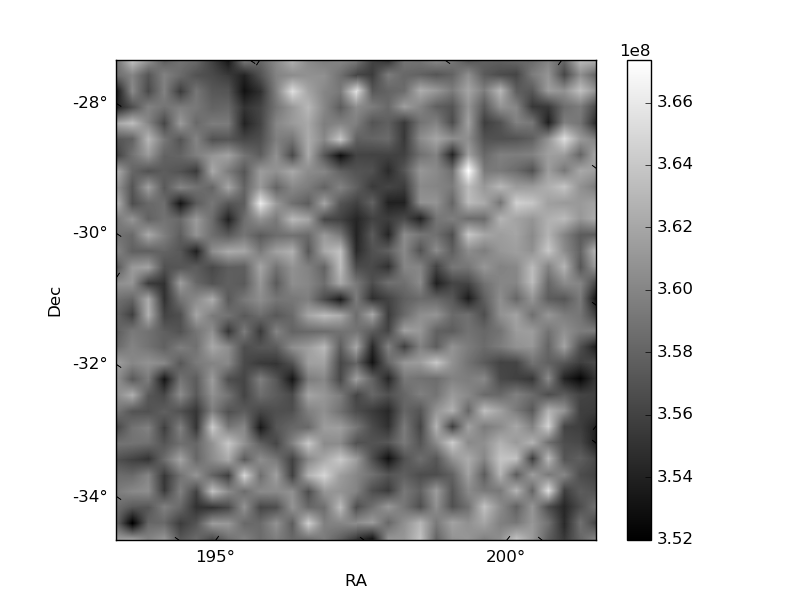
Histogram calculated using DETX and DETY for each event in the final _common_clean file
| Quadrant A | 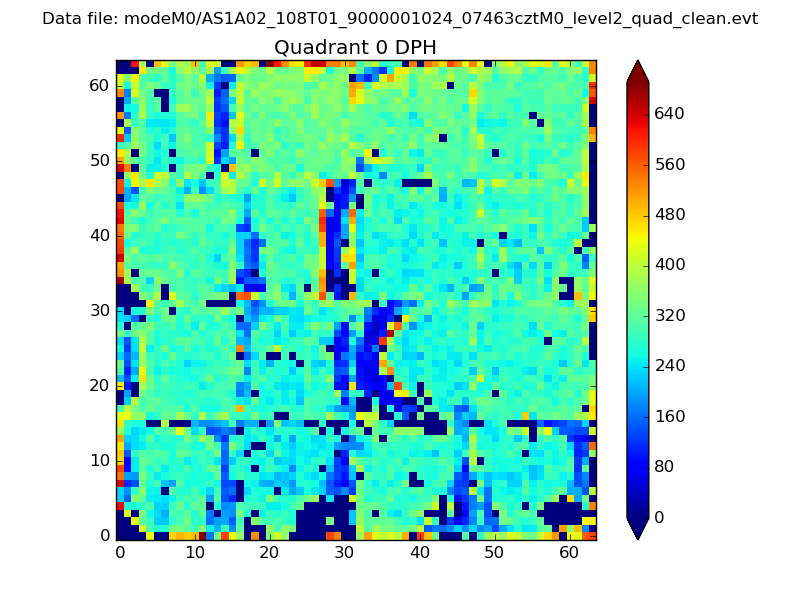 |
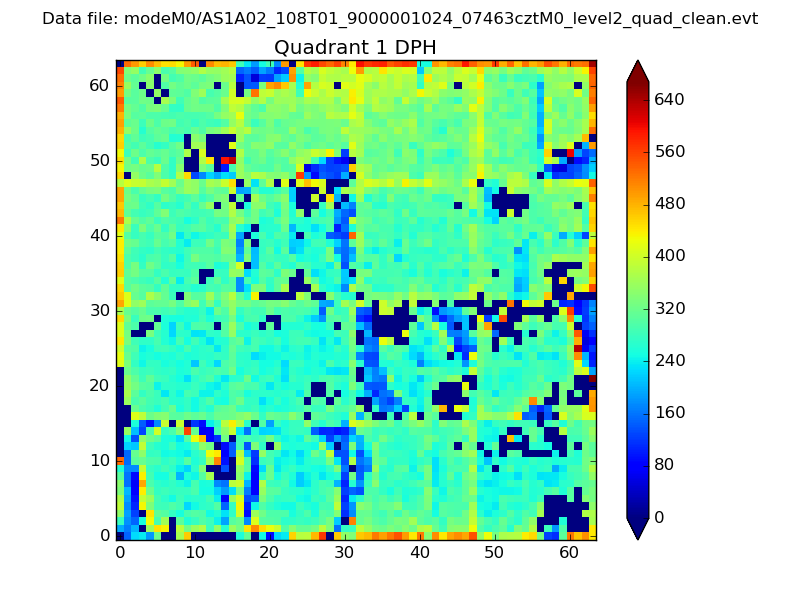 |
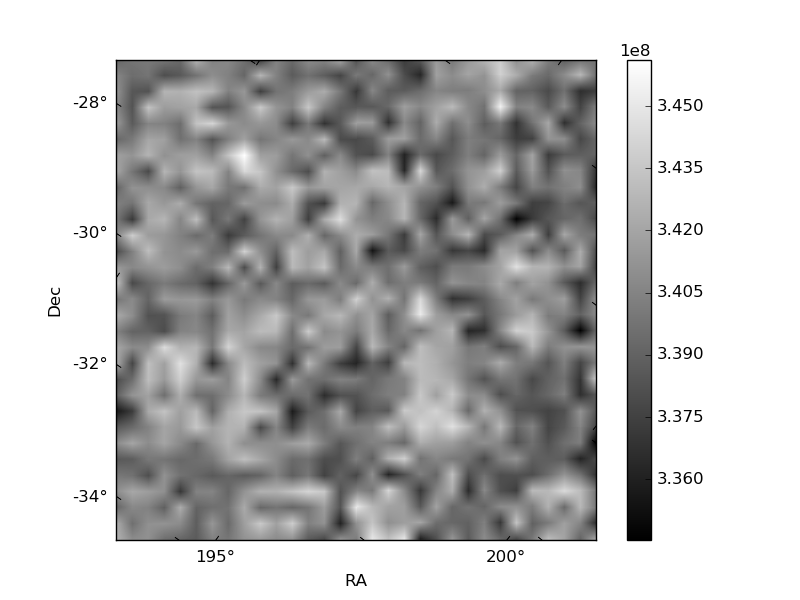
Quadrant B |
|---|---|---|---|
| Quadrant D | 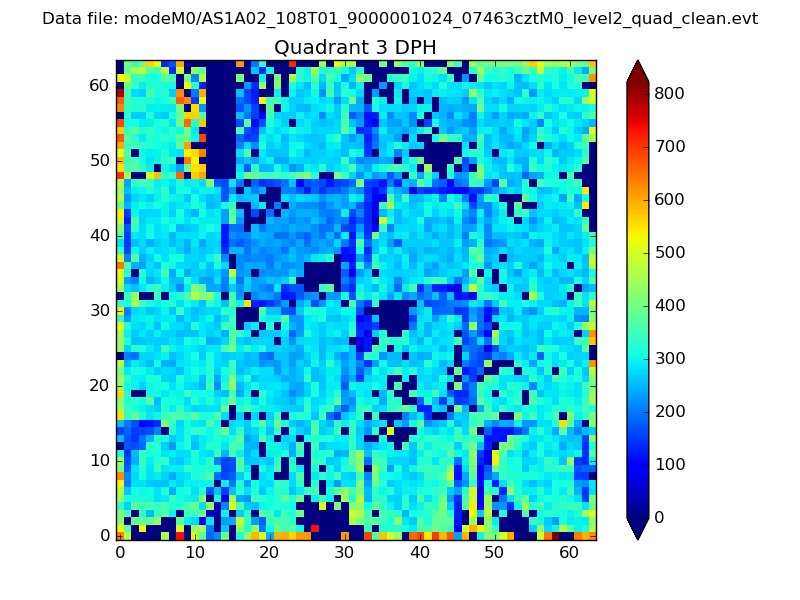 |
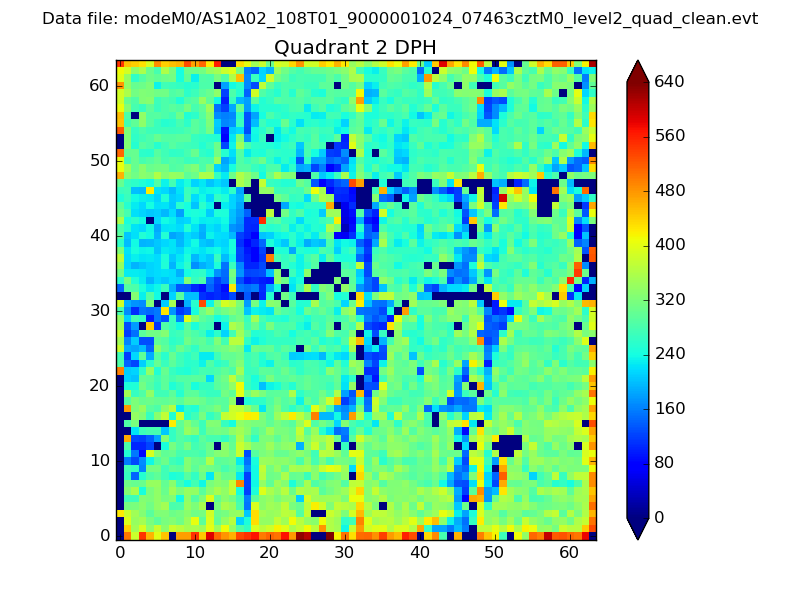 |
Quadrant C |
| Plot type | Count rate plots | Images |
|---|---|---|
| Comparison with Poisson distribution Blue bars denote a histogram of data divided into 1 sec bins. Red curve is a Poisson curve with rate = median count rate of data. |
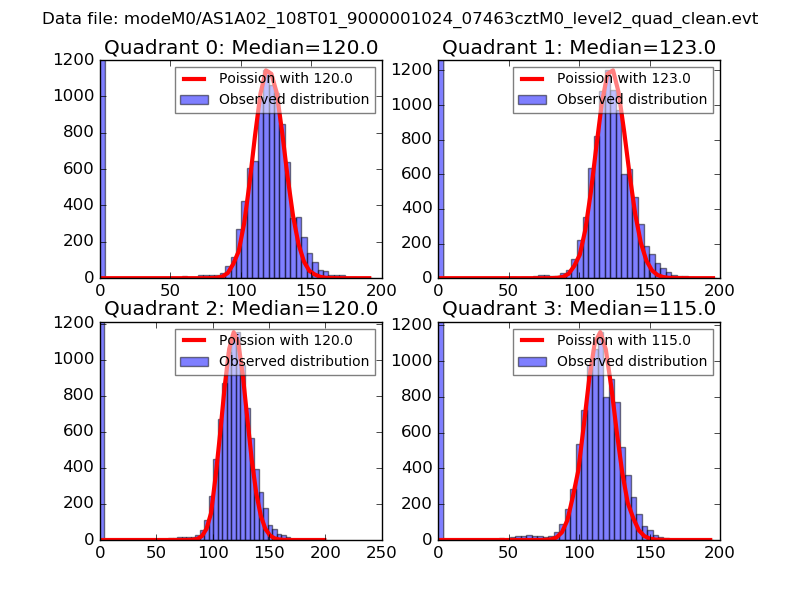 |
 |
| Quadrant-wise count rates Data is divided into 100 sec bins |
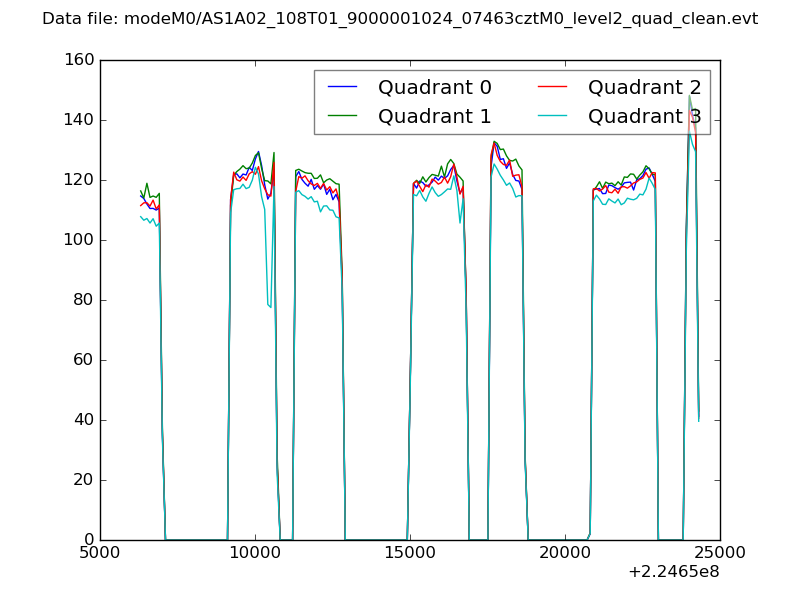 |
|
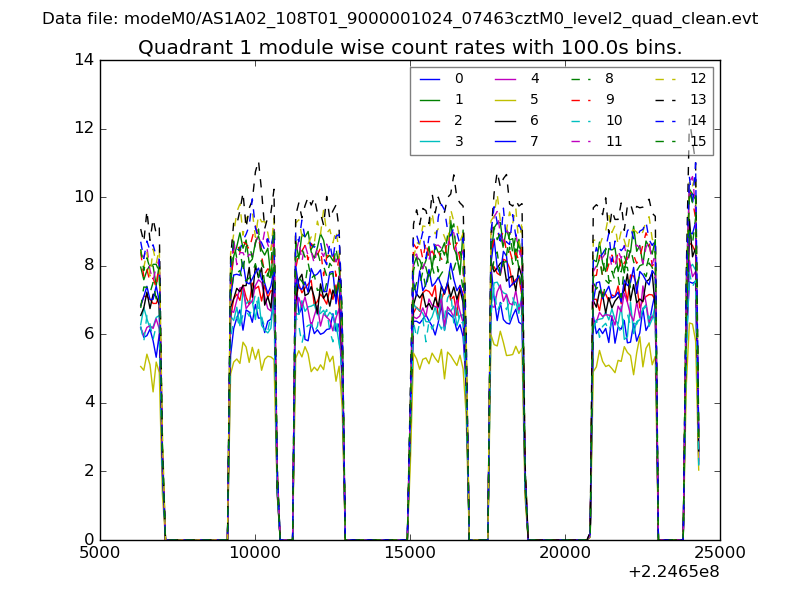
| Module-wise count rates for Quadrant A Data is divided into 100 sec bins |
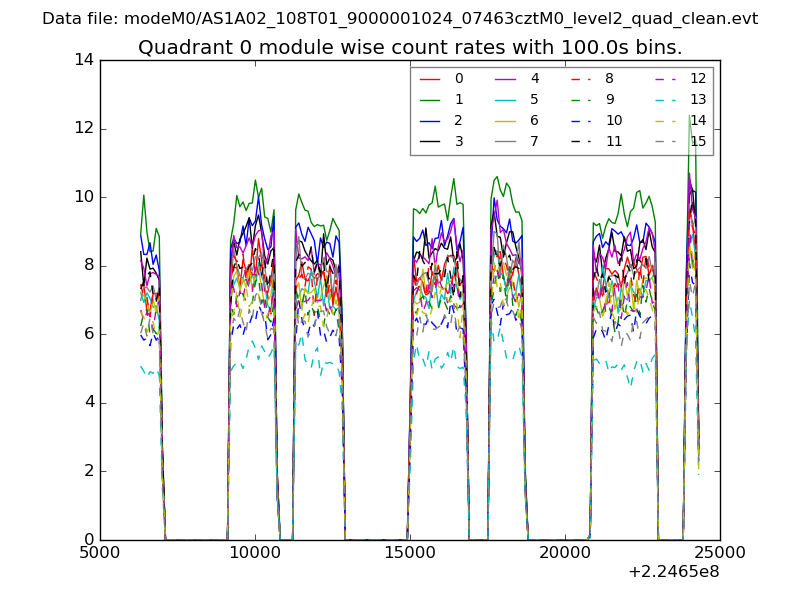 |
 |
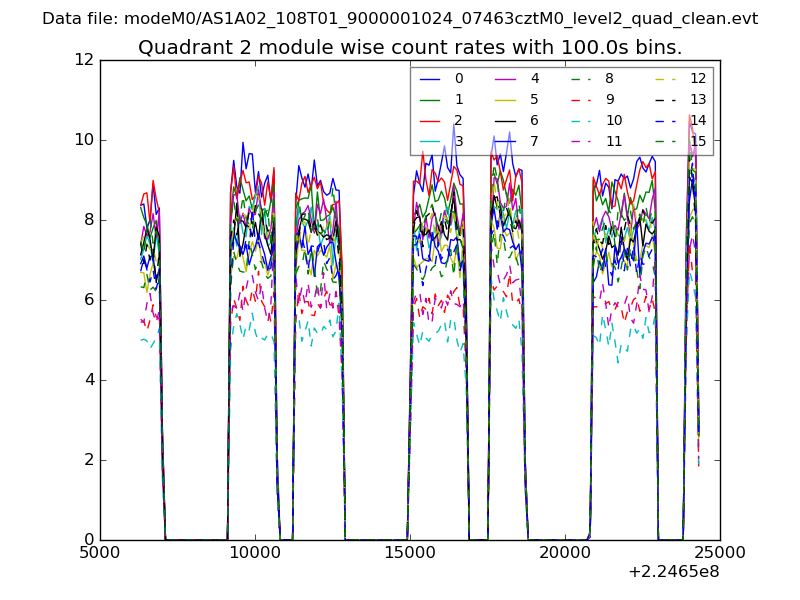
| Module-wise count rates for Quadrant B Data is divided into 100 sec bins |
 |
 |
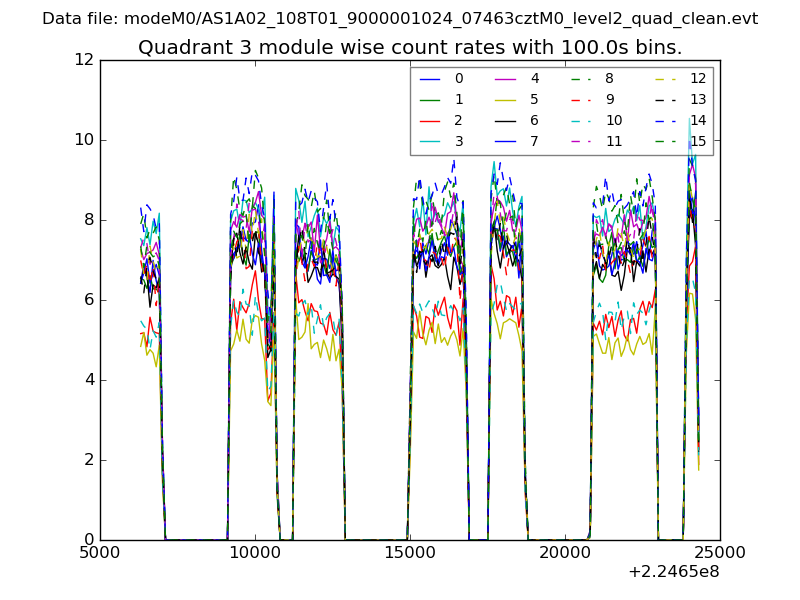
| Module-wise count rates for Quadrant C Data is divided into 100 sec bins |
 |
 |
| Module-wise count rates for Quadrant D Data is divided into 100 sec bins |
 |
 |
| Parameter | Plot |
|---|---|
| CZT HV Monitor | 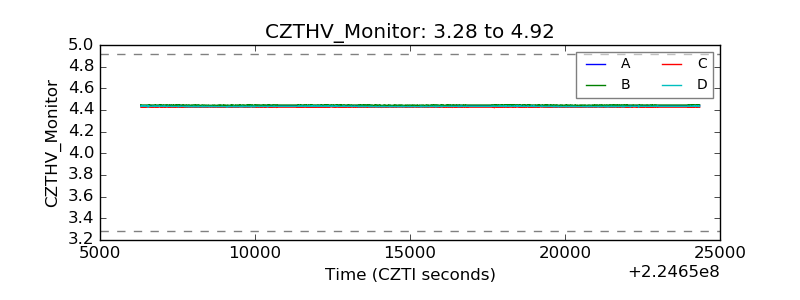 |
| D_VDD |  |
| Temperature 1 | 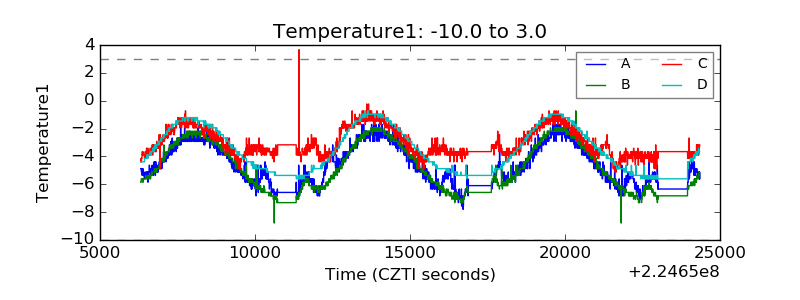 |
| Veto HV Monitor |  |
| Veto LLD | 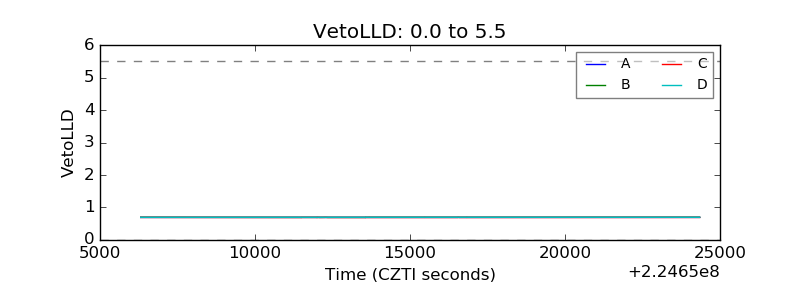 |
| Alpha Counter | 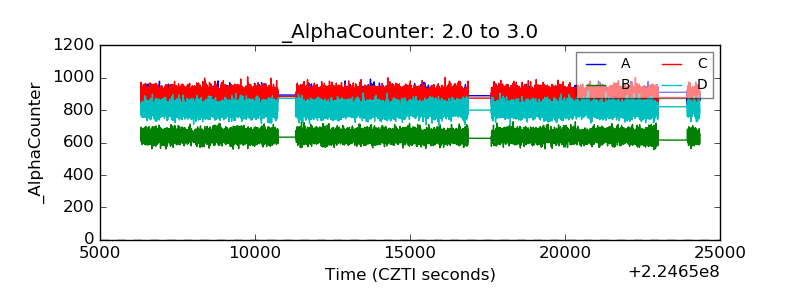 |
| _CPM_Rate | 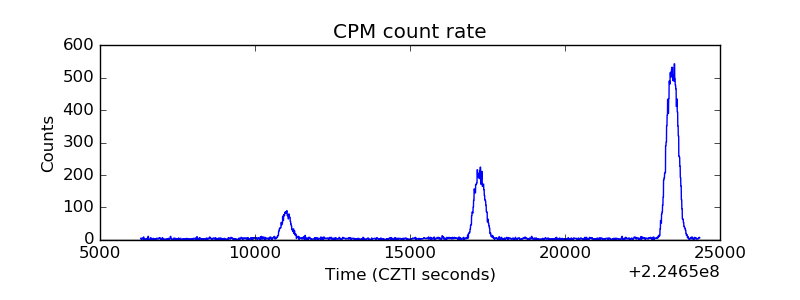 |
| CZT Counter | 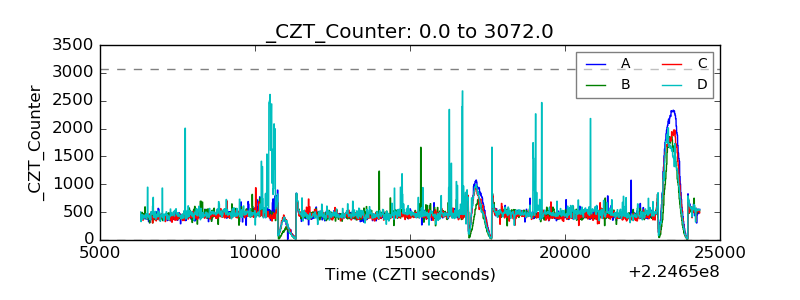 |
| +2.5 Volts monitor |  |
| +5 Volts monitor |  |
| _ROLL_ROT | 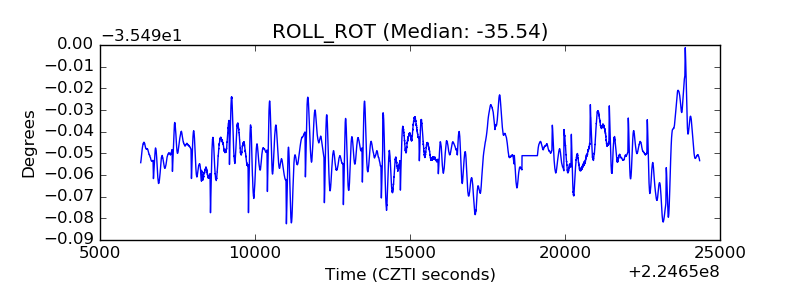 |
| _Roll_DEC | 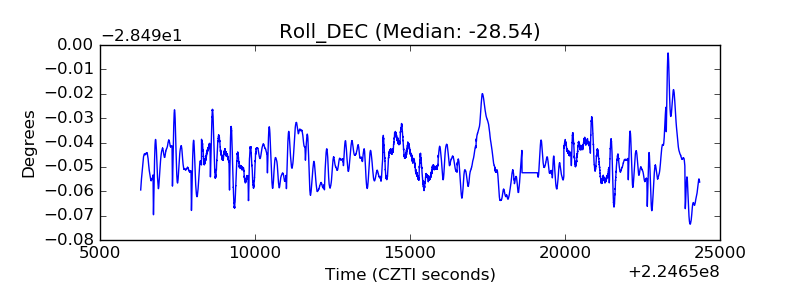 |
| _Roll_RA |  |
| Veto Counter | 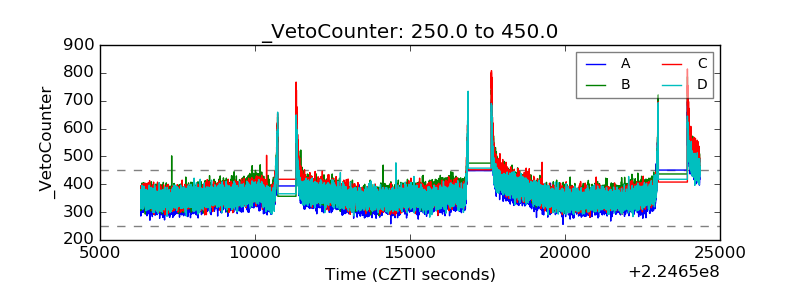 |