| Param | Original file | Final file |
|---|---|---|
| Filename | modeM0/AS1A02_108T01_9000001024_07465cztM0_level2.evt | modeM0/AS1A02_108T01_9000001024_07465cztM0_level2_quad_clean.evt |
| Size (bytes) | 233,628,480 | 30,588,480 |
| Size | 222.8 MB | 29.2 MB |
| Events in quadrant A | 1,635,486 | 170,811 |
| Events in quadrant B | 1,714,830 | 173,647 |
| Events in quadrant C | 1,605,918 | 169,263 |
| Events in quadrant D | 1,879,050 | 163,396 |
| Mode SS | |||
|---|---|---|---|
| Quadrant | BADHDUFLAG | Total packets | Discarded packets |
| A | 0 | 70 | 0 |
| B | 0 | 70 | 0 |
| C | 0 | 70 | 0 |
| D | 0 | 70 | 0 |
| Mode M0 | |||
|---|---|---|---|
| Quadrant | BADHDUFLAG | Total packets | Discarded packets |
| A | 0 | 7135 | 1 |
| B | 0 | 7283 | 1 |
| C | 0 | 7109 | 1 |
| D | 0 | 7621 | 1 |
| Quadrant | Total seconds | Saturated seconds | Saturation percentage |
|---|---|---|---|
| A | 3506 | 5 | 0.142613% |
| B | 3506 | 10 | 0.285225% |
| C | 3506 | 3 | 0.085568% |
| D | 3507 | 13 | 0.370687% |
Noise dominated data is calculated using 1-second bins in cleaned event files. If a bin has >2000 counts, and if more than 50% of those come from <1% of pixels, then it is considered to be noise-dominated and hence unusable.
| Quadrant | # 1 sec bins | Bins with >0 counts | Bins with >2000 counts | High rate bins dominated by noise | Noise dominated (total time) | Noise dominated (detector-on time) | Marked lightcurve |
|---|---|---|---|---|---|---|---|
| A | 3506 | 3506 | 0 | 0 | 0.00% | 0.00% |  |
| B | 3506 | 3506 | 2 | 2 | 0.06% | 0.06% |  |
| C | 3506 | 3506 | 1 | 1 | 0.03% | 0.03% |  |
| D | 3507 | 3507 | 8 | 8 | 0.23% | 0.23% |  |
Top three noisy pixels from each quadrant. If the there are fewer than three noisy pixels in the level2.evt file, extra rows are filled as -1
| Pixel properties | Quadrant properties | ||||||
|---|---|---|---|---|---|---|---|
| Quadrant | DetID | PixID | Counts | Sigma | Mean | Median | Sigma |
| A | 15 | 239 | 12402 | 140.41 | 416 | 406 | 85.4 |
| A | 3 | 1 | 10816 | 121.85 | 416 | 406 | 85.4 |
| A | 0 | 128 | 6069 | 66.28 | 416 | 406 | 85.4 |
| B | 0 | 214 | 72080 | 882.99 | 416 | 405 | 81.2 |
| B | 0 | 197 | 8285 | 97.08 | 416 | 405 | 81.2 |
| B | 12 | 111 | 7996 | 93.52 | 416 | 405 | 81.2 |
| C | 14 | 67 | 11696 | 119.56 | 404 | 406 | 94.4 |
| C | 9 | 68 | 10164 | 103.34 | 404 | 406 | 94.4 |
| C | 1 | 16 | 6905 | 68.83 | 404 | 406 | 94.4 |
| D | 8 | 195 | 114227 | 1136.77 | 406 | 393 | 100.1 |
| D | 12 | 221 | 102971 | 1024.37 | 406 | 393 | 100.1 |
| D | 1 | 52 | 53593 | 531.27 | 406 | 393 | 100.1 |
Histogram calculated using DETX and DETY for each event in the final _common_clean file
| Quadrant A | 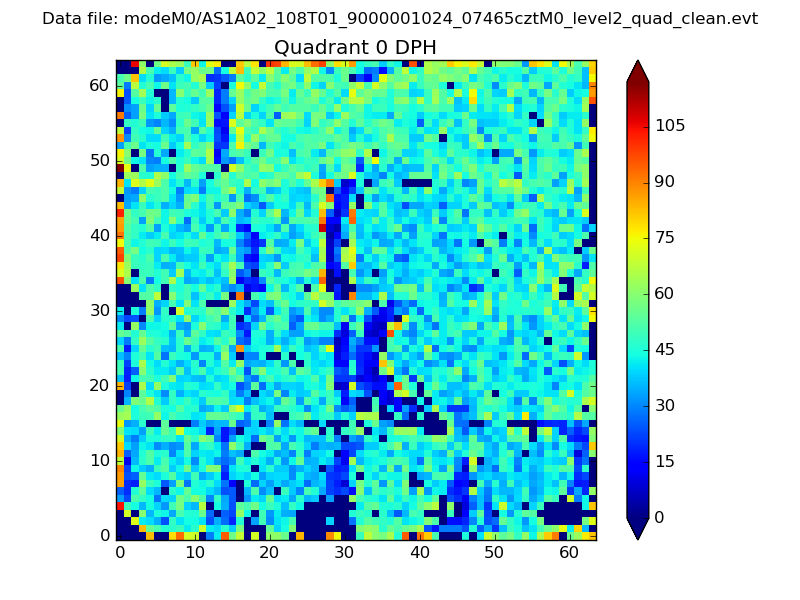 |
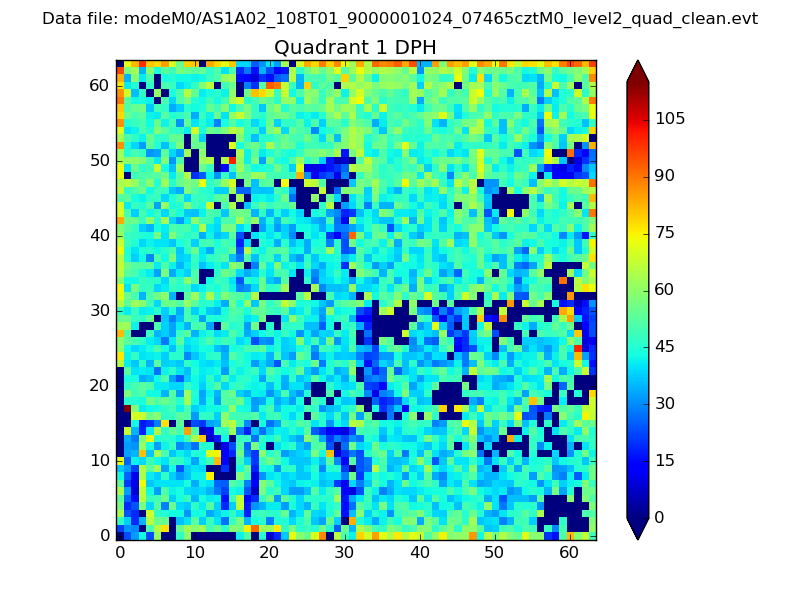 |
Quadrant B |
|---|---|---|---|
| Quadrant D | 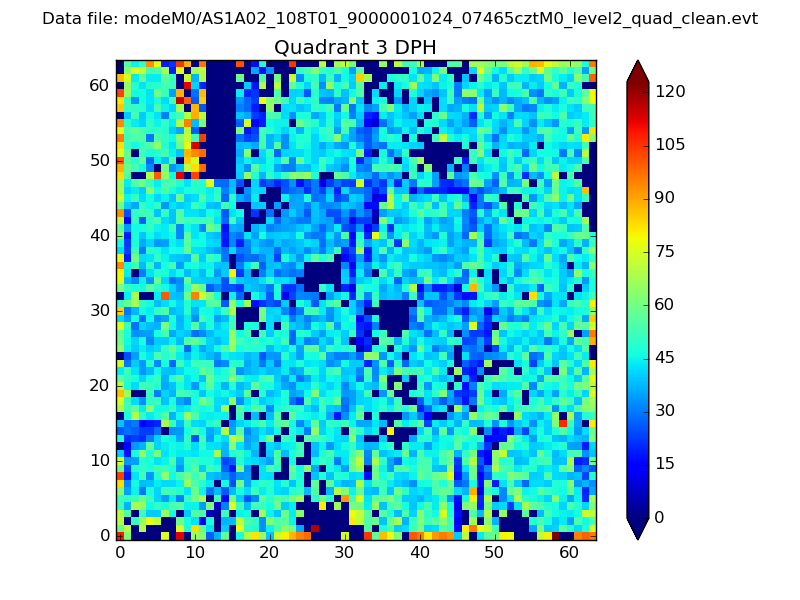 |
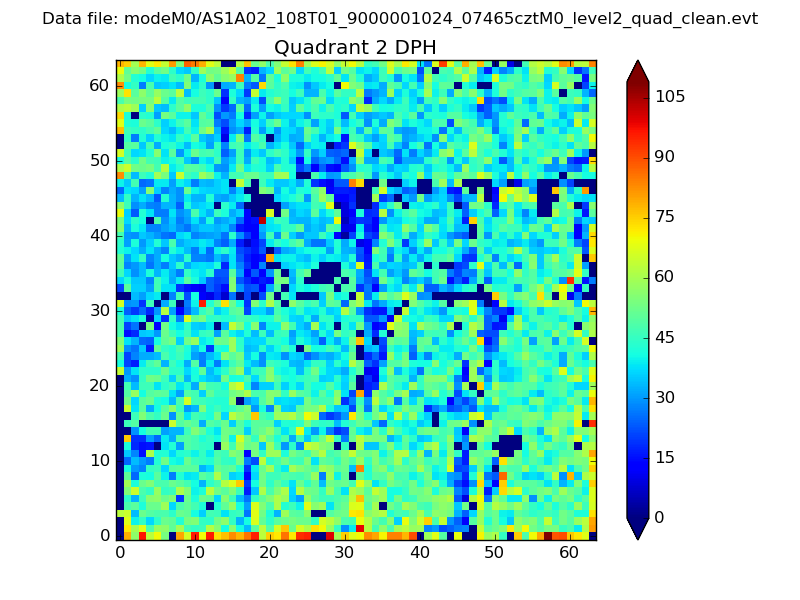 |
Quadrant C |
| Plot type | Count rate plots | Images |
|---|---|---|
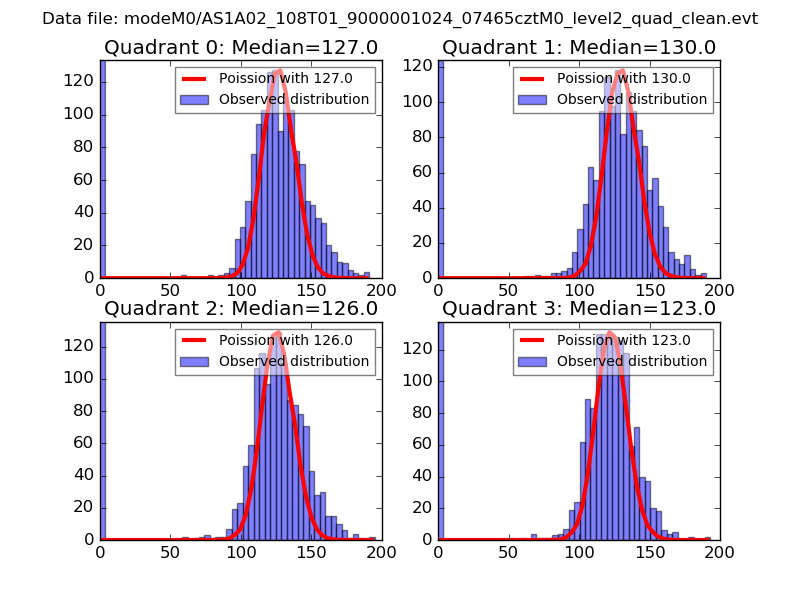
| Comparison with Poisson distribution Blue bars denote a histogram of data divided into 1 sec bins. Red curve is a Poisson curve with rate = median count rate of data. |
 |
 |
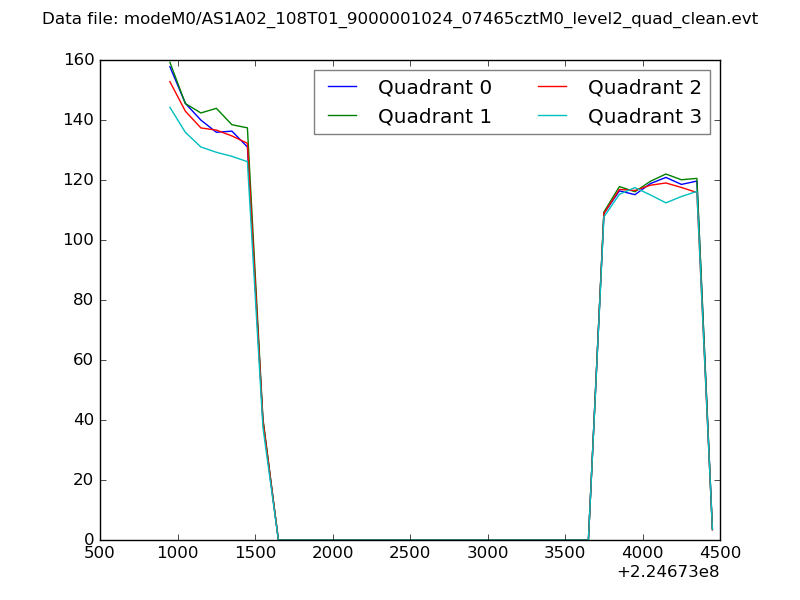
| Quadrant-wise count rates Data is divided into 100 sec bins |
 |
|
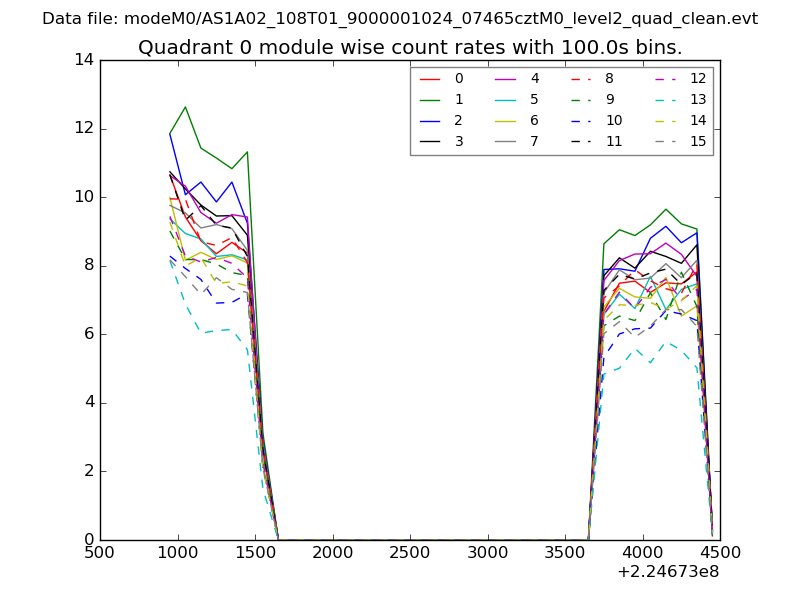
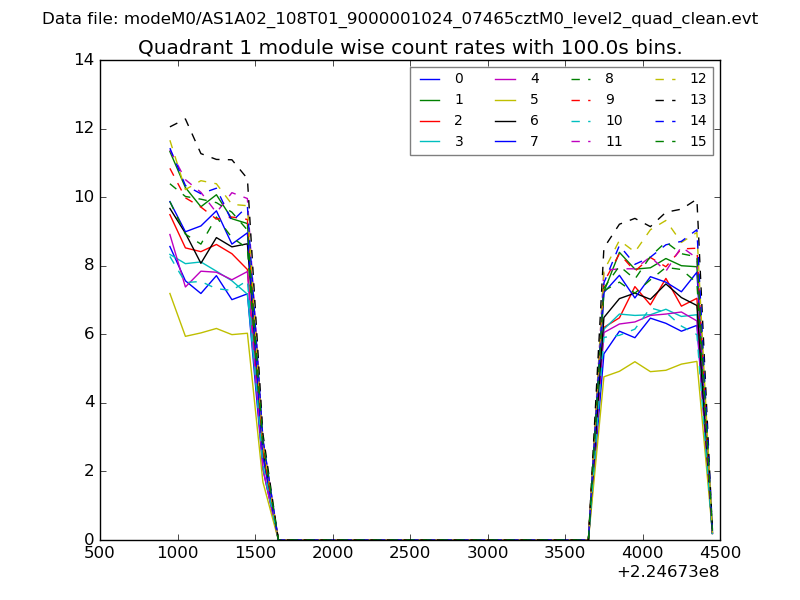
| Module-wise count rates for Quadrant A Data is divided into 100 sec bins |
 |
 |
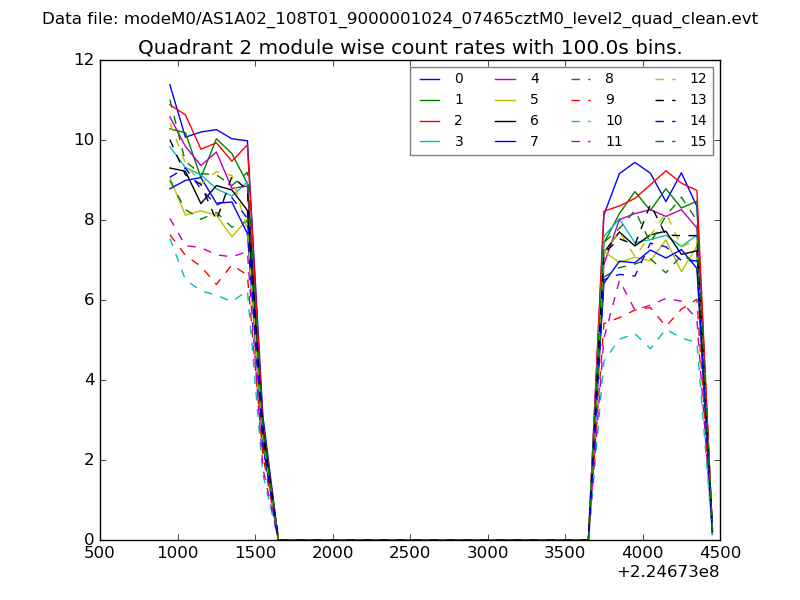
| Module-wise count rates for Quadrant B Data is divided into 100 sec bins |
 |
 |
| Module-wise count rates for Quadrant C Data is divided into 100 sec bins |
 |
 |
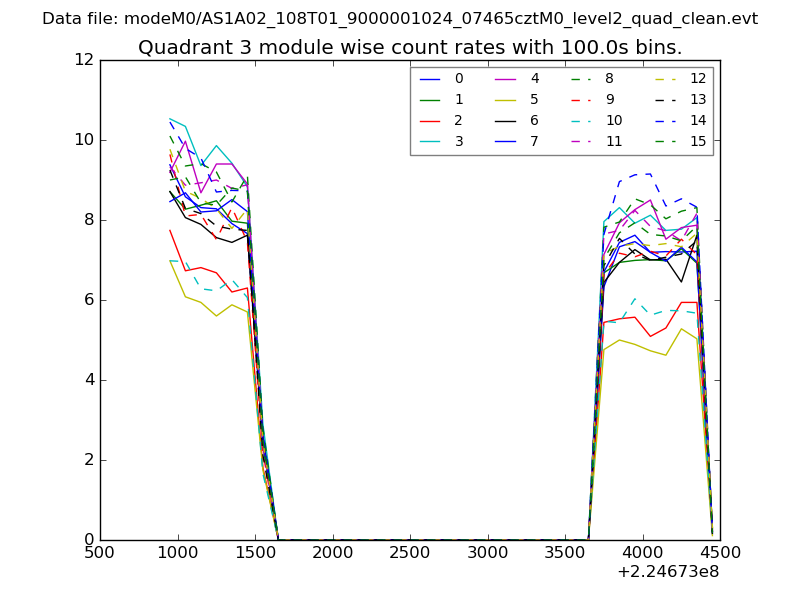
| Module-wise count rates for Quadrant D Data is divided into 100 sec bins |
 |
 |
| Parameter | Plot |
|---|---|
| CZT HV Monitor | 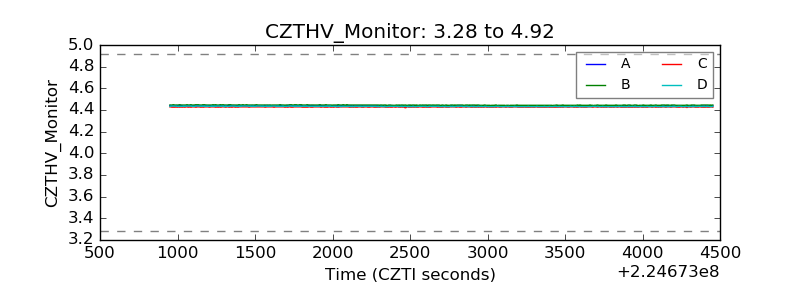 |
| D_VDD | 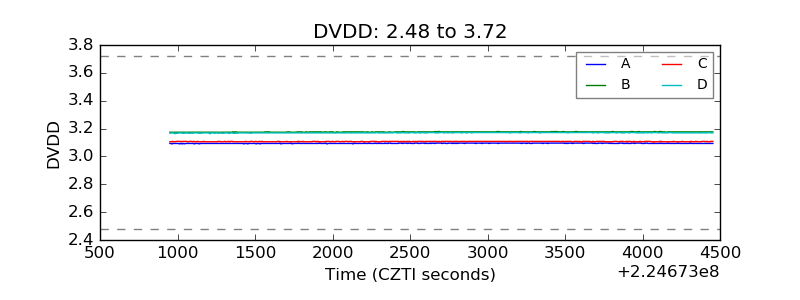 |
| Temperature 1 | 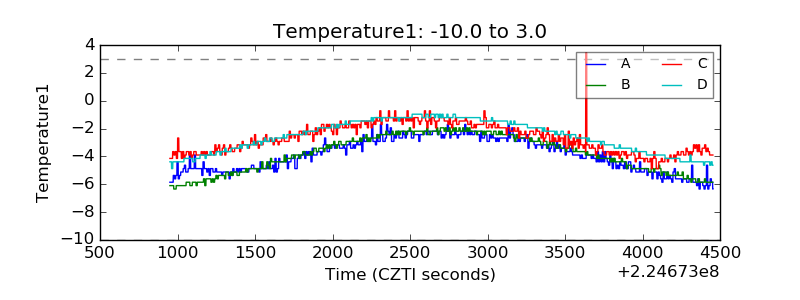 |
| Veto HV Monitor | 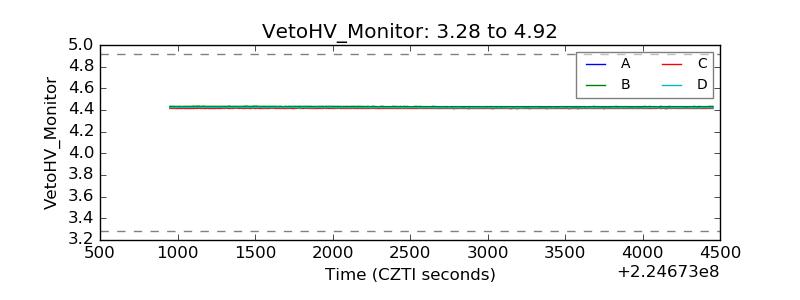 |
| Veto LLD | 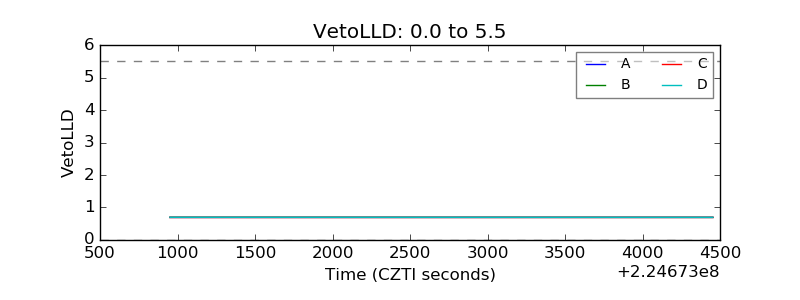 |
| Alpha Counter | 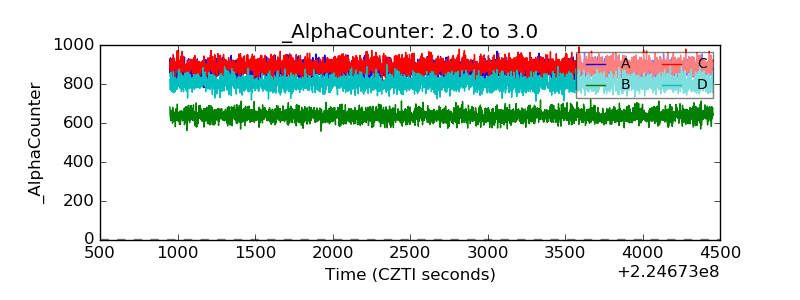 |
| _CPM_Rate | 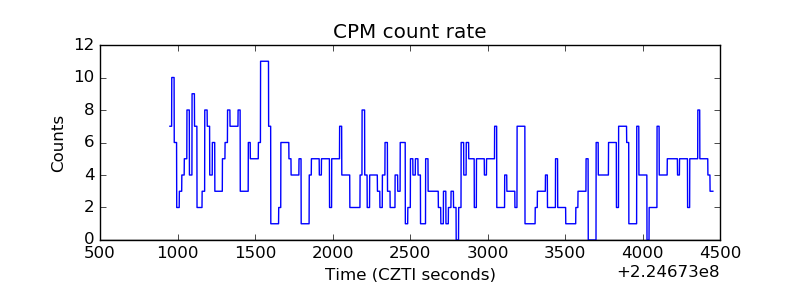 |
| CZT Counter | 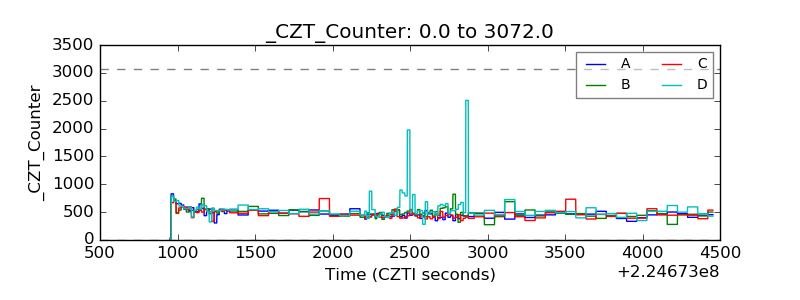 |
| +2.5 Volts monitor |  |
| +5 Volts monitor |  |
| _ROLL_ROT | 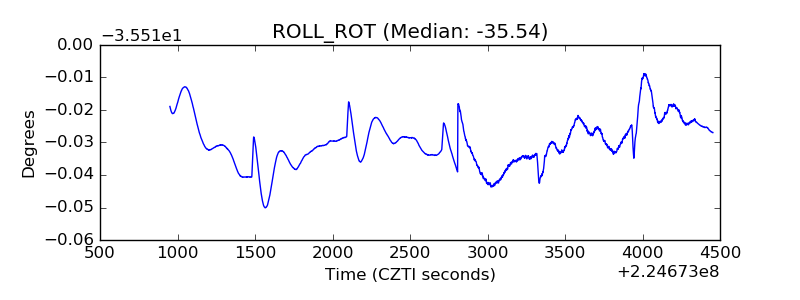 |
| _Roll_DEC | 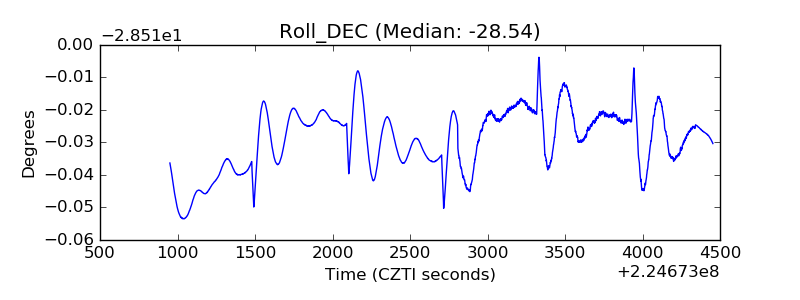 |
| _Roll_RA |  |
| Veto Counter | 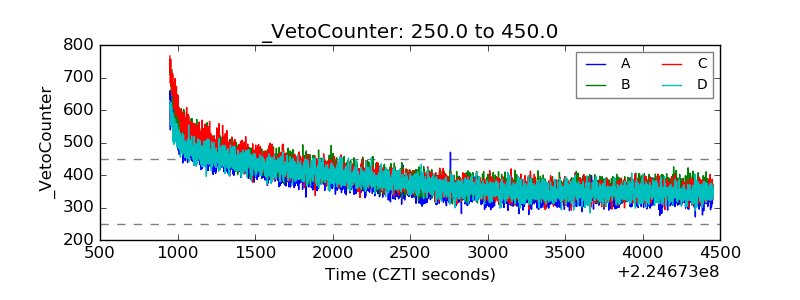 |