| Param | Original file | Final file |
|---|---|---|
| Filename | modeM0/AS1G06_116T01_9000001026_07465cztM0_level2.evt | modeM0/AS1G06_116T01_9000001026_07465cztM0_level2_quad_clean.evt |
| Size (bytes) | 141,068,160 | 39,346,560 |
| Size | 134.5 MB | 37.5 MB |
| Events in quadrant A | 989,821 | 263,145 |
| Events in quadrant B | 997,837 | 267,652 |
| Events in quadrant C | 973,361 | 263,676 |
| Events in quadrant D | 1,173,968 | 252,609 |
| Mode M0 | |||
|---|---|---|---|
| Quadrant | BADHDUFLAG | Total packets | Discarded packets |
| A | 0 | 4145 | 2 |
| B | 0 | 4127 | 1 |
| C | 0 | 4126 | 1 |
| D | 0 | 4707 | 1 |
| Mode SS | |||
|---|---|---|---|
| Quadrant | BADHDUFLAG | Total packets | Discarded packets |
| A | 0 | 42 | 0 |
| B | 0 | 42 | 0 |
| C | 0 | 42 | 0 |
| D | 0 | 42 | 0 |
| Mode M9 | |||
|---|---|---|---|
| Quadrant | BADHDUFLAG | Total packets | Discarded packets |
| A | 0 | 11 | 0 |
| B | 0 | 11 | 0 |
| C | 0 | 11 | 0 |
| D | 0 | 11 | 0 |
| Quadrant | Total seconds | Saturated seconds | Saturation percentage |
|---|---|---|---|
| A | 1979 | 50 | 2.526529% |
| B | 1979 | 42 | 2.122284% |
| C | 1979 | 39 | 1.970692% |
| D | 1979 | 62 | 3.132895% |
Noise dominated data is calculated using 1-second bins in cleaned event files. If a bin has >2000 counts, and if more than 50% of those come from <1% of pixels, then it is considered to be noise-dominated and hence unusable.
| Quadrant | # 1 sec bins | Bins with >0 counts | Bins with >2000 counts | High rate bins dominated by noise | Noise dominated (total time) | Noise dominated (detector-on time) | Marked lightcurve |
|---|---|---|---|---|---|---|---|
| A | 3019 | 1979 | 0 | 0 | 0.00% | 0.00% | 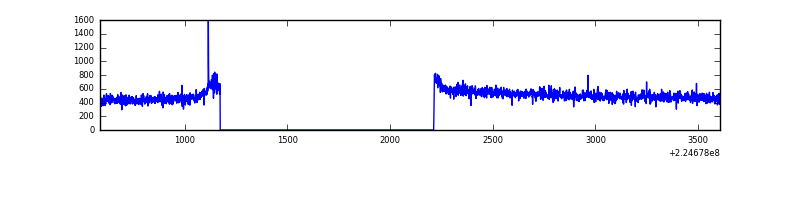 |
| B | 3019 | 1979 | 0 | 0 | 0.00% | 0.00% | 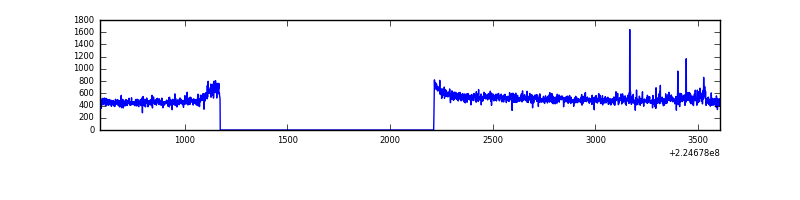 |
| C | 3019 | 1980 | 0 | 0 | 0.00% | 0.00% | 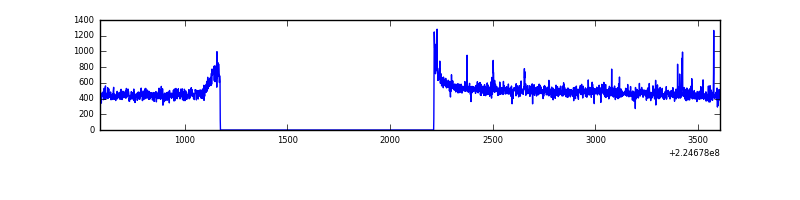 |
| D | 3019 | 1979 | 22 | 22 | 0.73% | 1.11% | 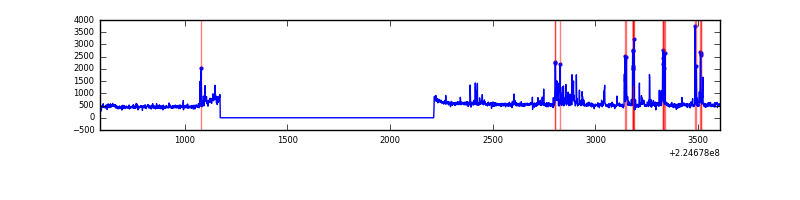 |
Top three noisy pixels from each quadrant. If the there are fewer than three noisy pixels in the level2.evt file, extra rows are filled as -1
| Pixel properties | Quadrant properties | ||||||
|---|---|---|---|---|---|---|---|
| Quadrant | DetID | PixID | Counts | Sigma | Mean | Median | Sigma |
| A | 15 | 239 | 6960 | 126.93 | 254 | 248 | 52.9 |
| A | 3 | 1 | 3891 | 68.89 | 254 | 248 | 52.9 |
| A | 0 | 226 | 2491 | 42.42 | 254 | 248 | 52.9 |
| B | 0 | 214 | 11463 | 222.6 | 252 | 246 | 50.4 |
| B | 12 | 111 | 5069 | 95.71 | 252 | 246 | 50.4 |
| B | 11 | 111 | 4154 | 77.55 | 252 | 246 | 50.4 |
| C | 9 | 68 | 14937 | 258.02 | 242 | 243 | 56.9 |
| C | 1 | 16 | 7803 | 132.75 | 242 | 243 | 56.9 |
| C | 14 | 67 | 3164 | 51.29 | 242 | 243 | 56.9 |
| D | 1 | 52 | 81085 | 1327.45 | 242 | 234 | 60.9 |
| D | 12 | 221 | 45295 | 739.83 | 242 | 234 | 60.9 |
| D | 8 | 195 | 40674 | 663.96 | 242 | 234 | 60.9 |
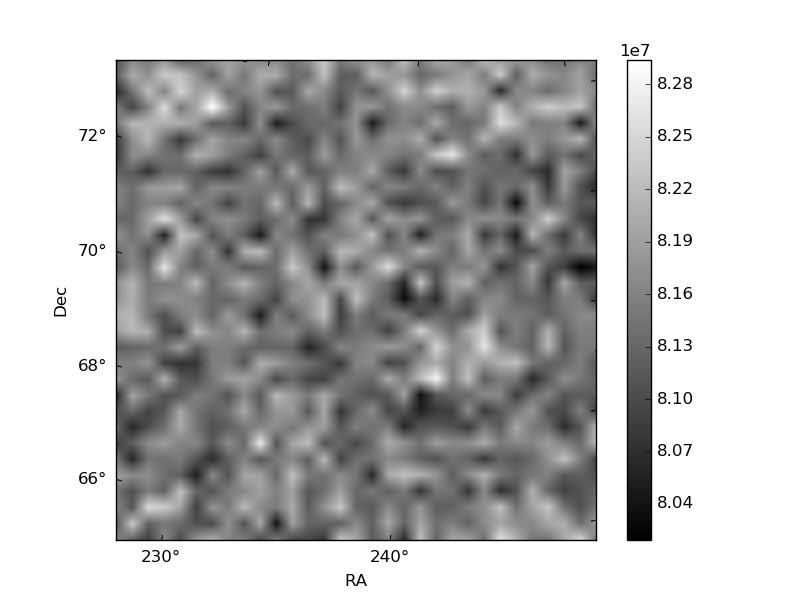
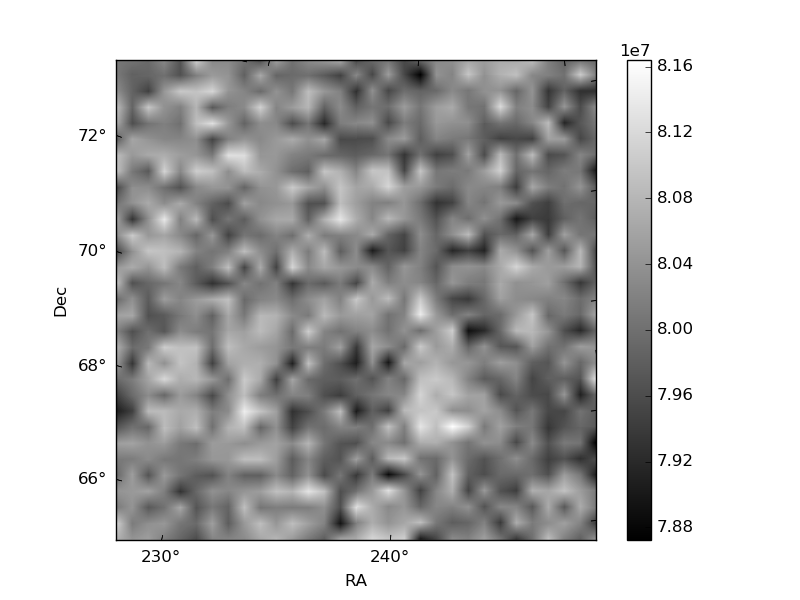
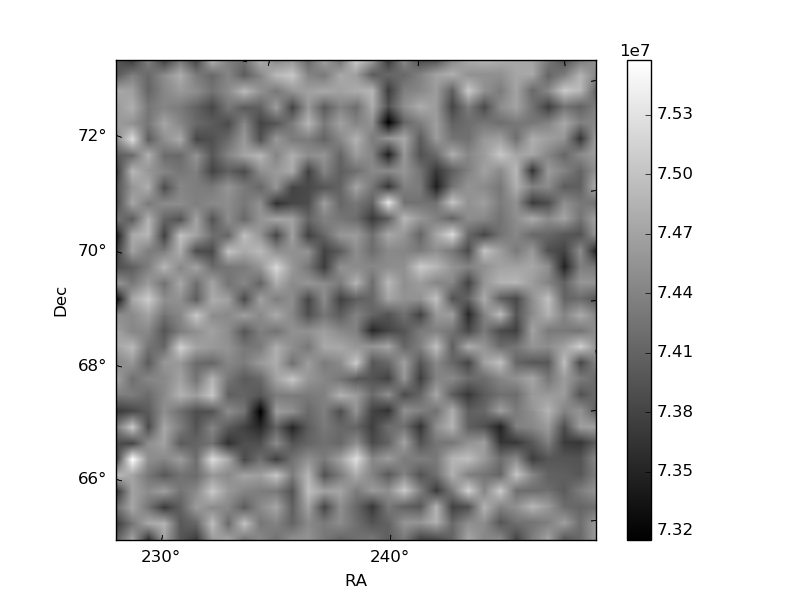
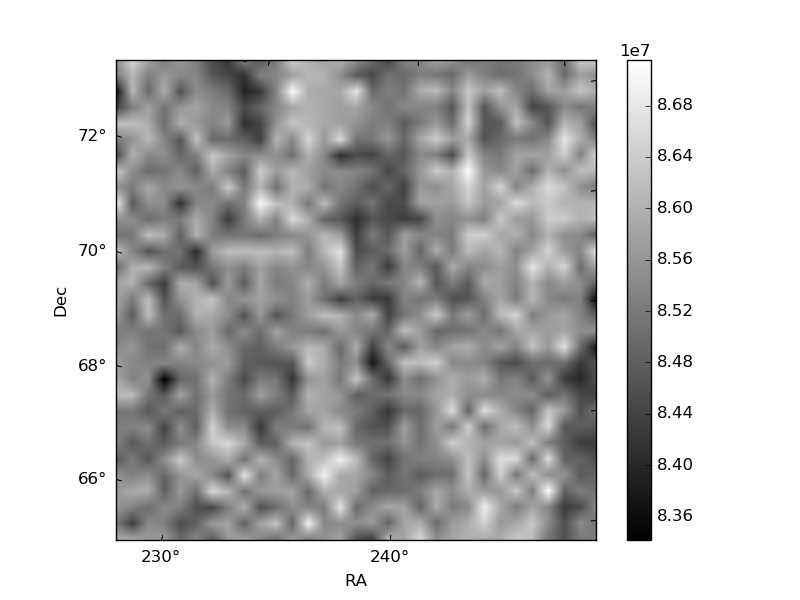
Histogram calculated using DETX and DETY for each event in the final _common_clean file
| Quadrant A | 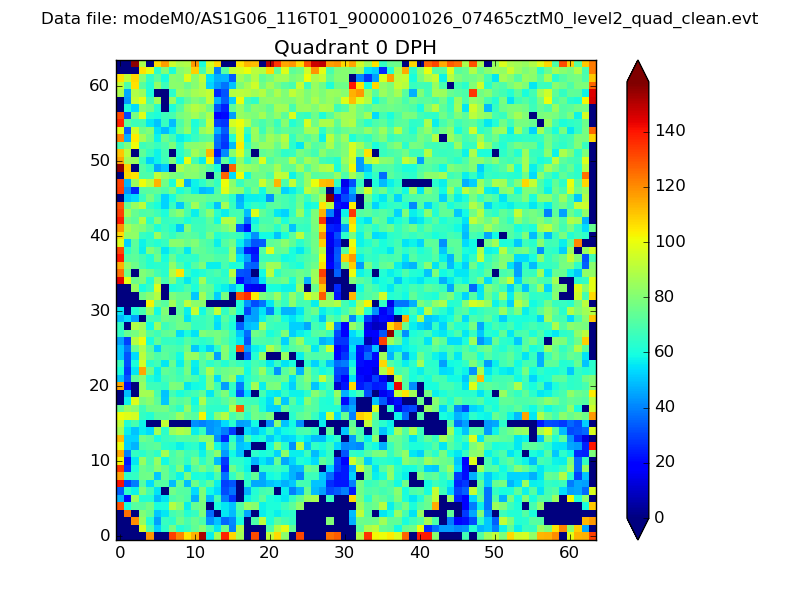 |
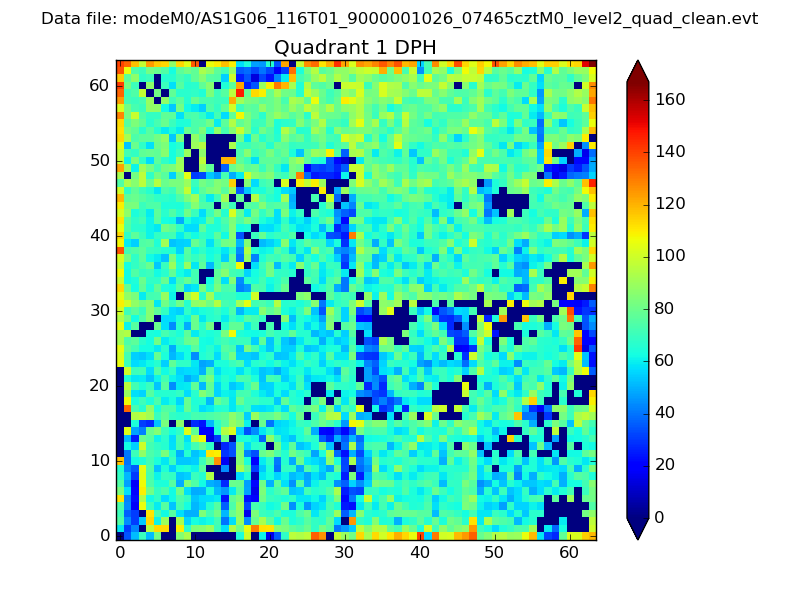 |
Quadrant B |
|---|---|---|---|
| Quadrant D | 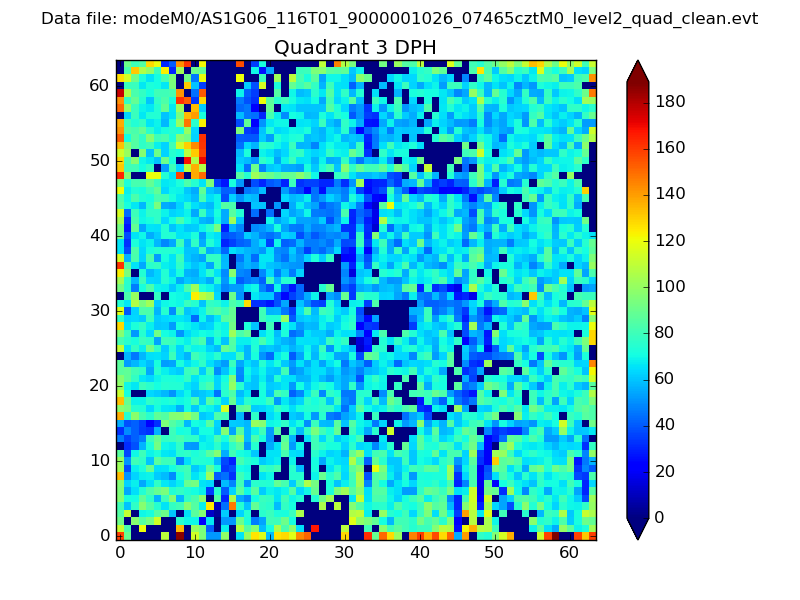 |
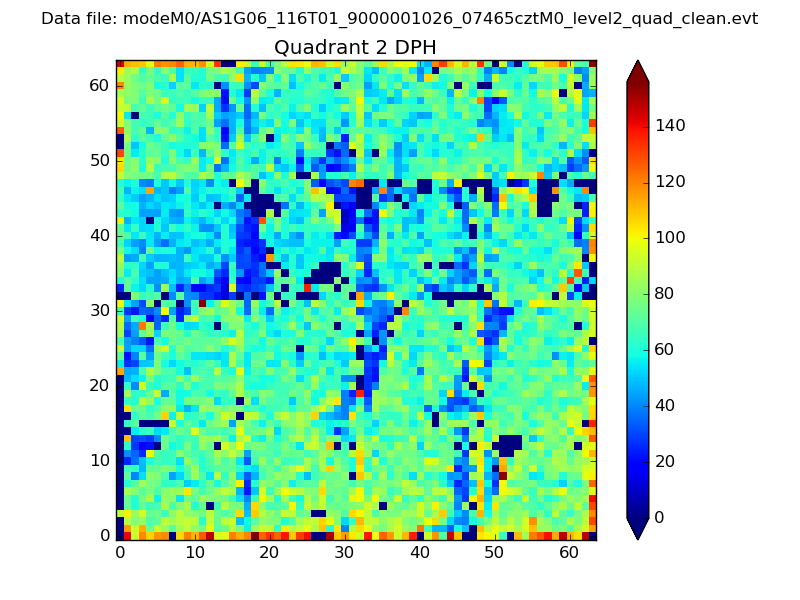 |
Quadrant C |
| Plot type | Count rate plots | Images |
|---|---|---|
| Comparison with Poisson distribution Blue bars denote a histogram of data divided into 1 sec bins. Red curve is a Poisson curve with rate = median count rate of data. |
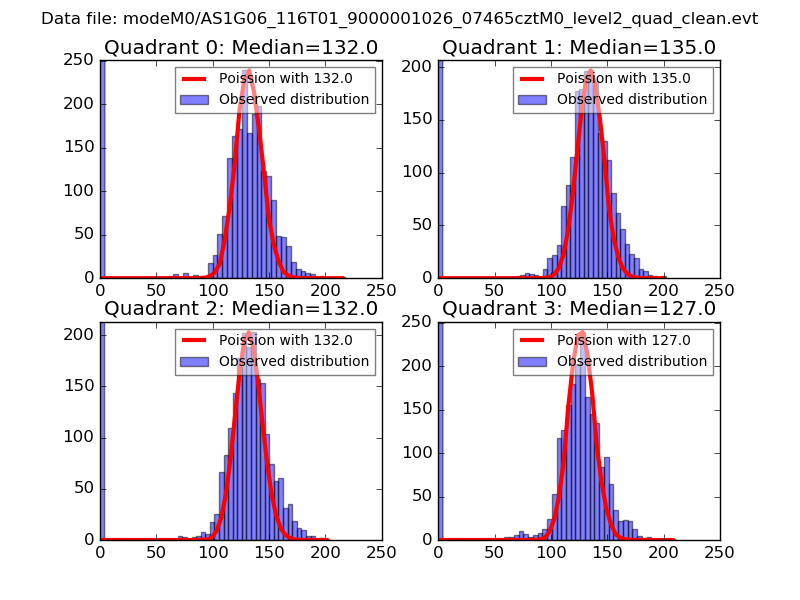 |
 |
| Quadrant-wise count rates Data is divided into 100 sec bins |
 |
|
| Module-wise count rates for Quadrant A Data is divided into 100 sec bins |
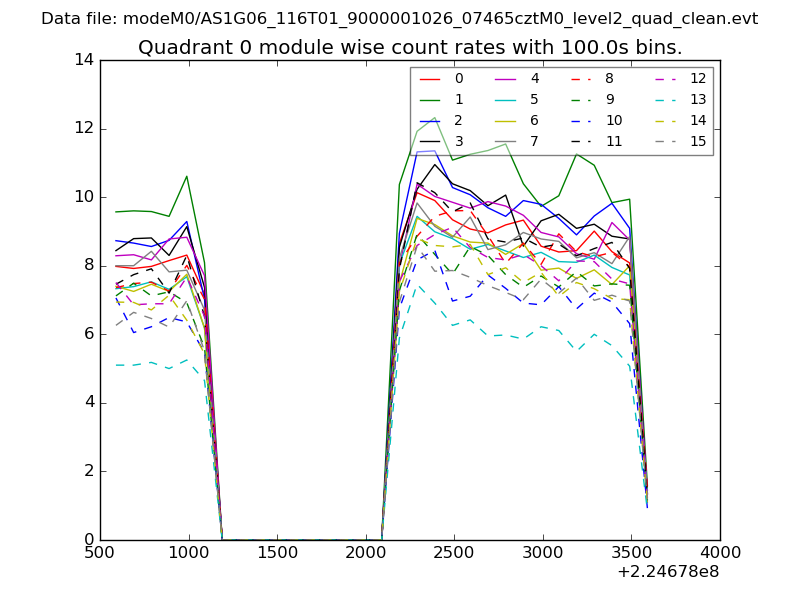 |
 |
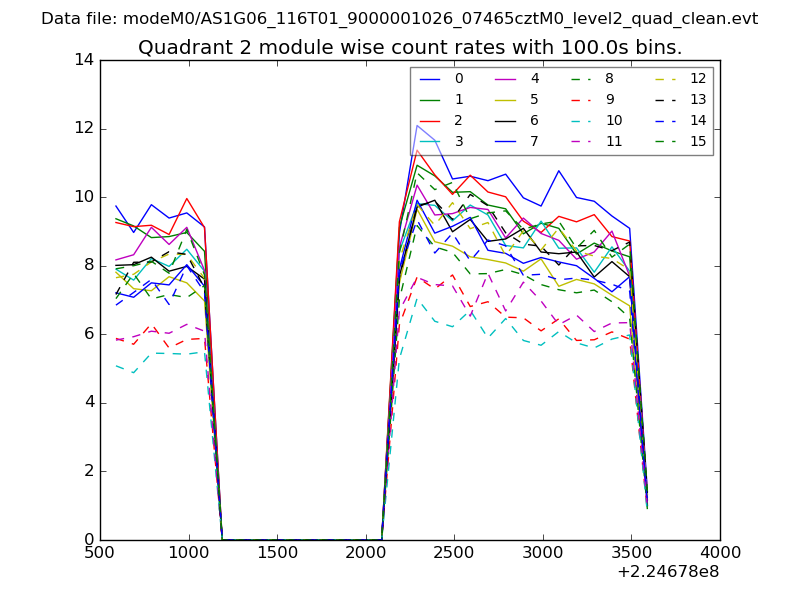
| Module-wise count rates for Quadrant B Data is divided into 100 sec bins |
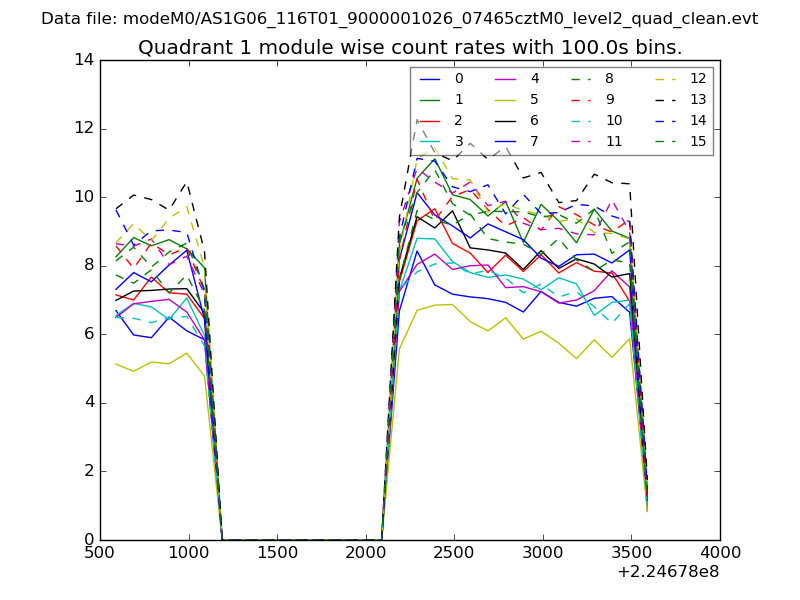 |
 |
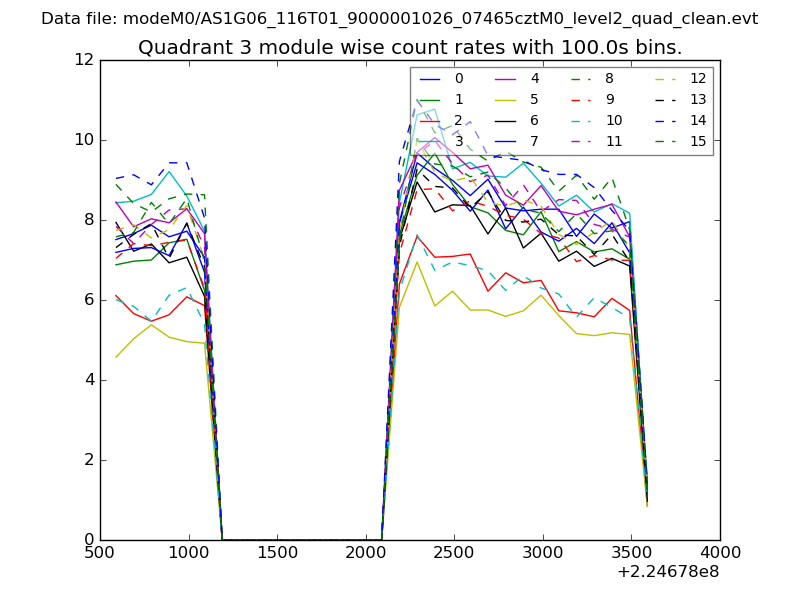
| Module-wise count rates for Quadrant C Data is divided into 100 sec bins |
 |
 |
| Module-wise count rates for Quadrant D Data is divided into 100 sec bins |
 |
 |
| Parameter | Plot |
|---|---|
| CZT HV Monitor | 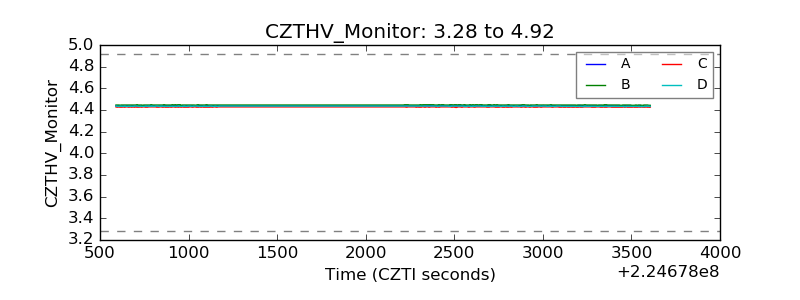 |
| D_VDD | 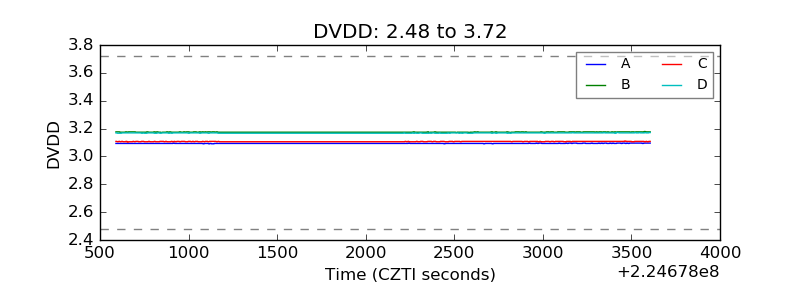 |
| Temperature 1 | 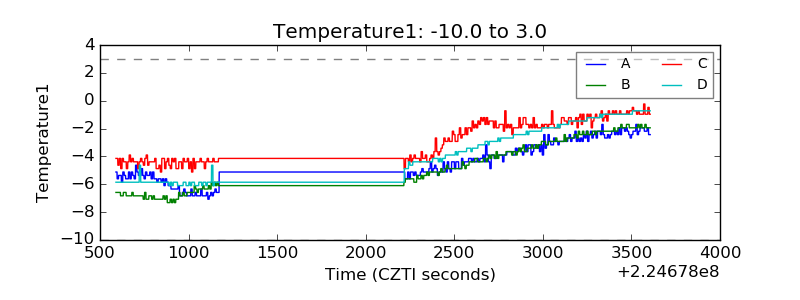 |
| Veto HV Monitor | 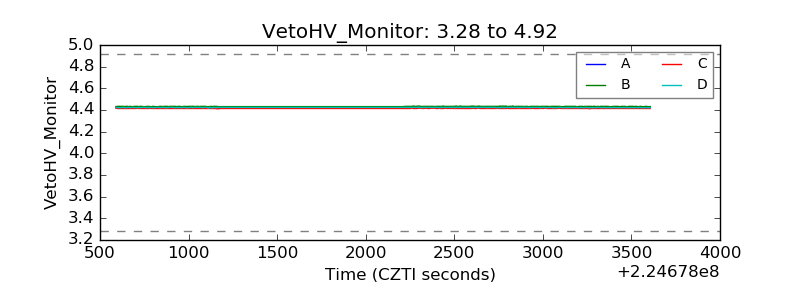 |
| Veto LLD | 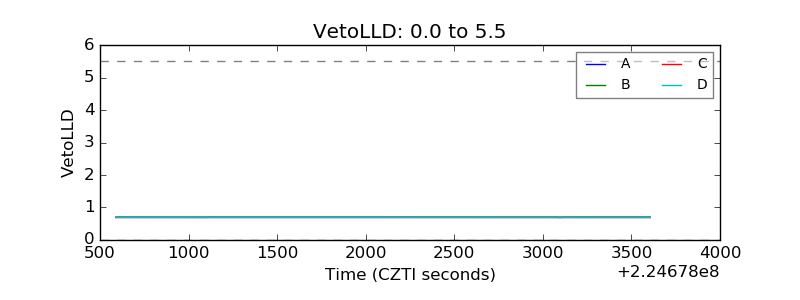 |
| Alpha Counter | 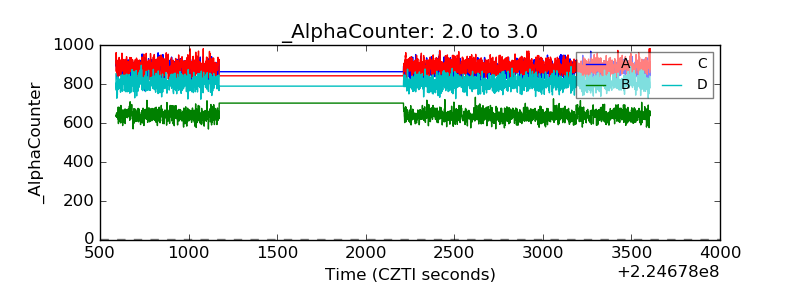 |
| _CPM_Rate | 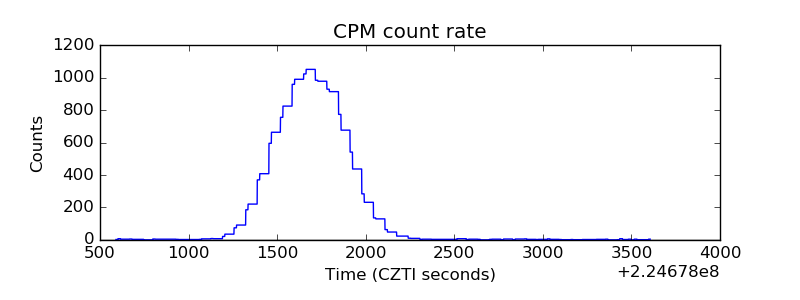 |
| CZT Counter |  |
| +2.5 Volts monitor |  |
| +5 Volts monitor |  |
| _ROLL_ROT | 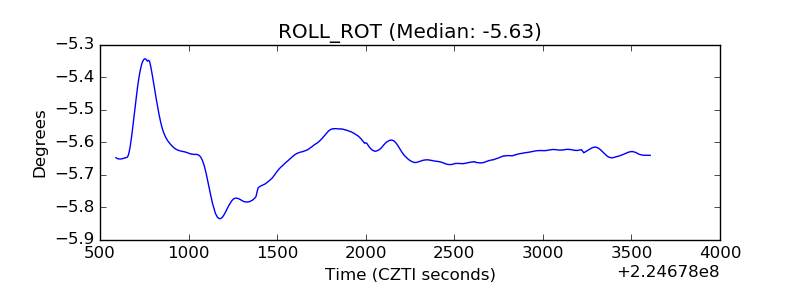 |
| _Roll_DEC | 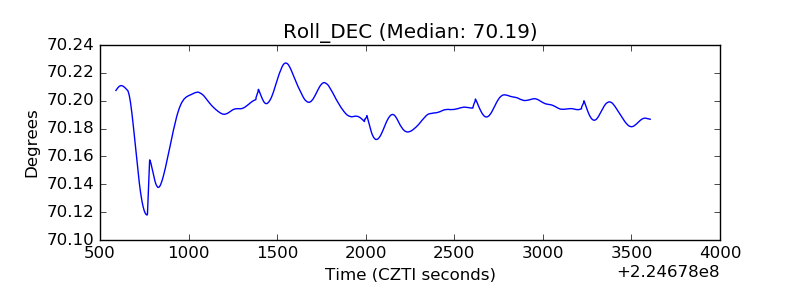 |
| _Roll_RA |  |
| Veto Counter | 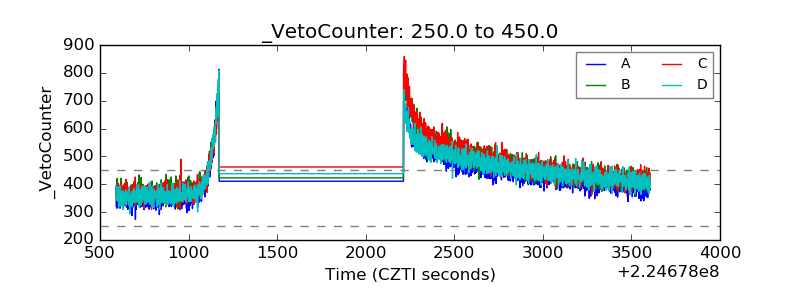 |