| Param | Original file | Final file |
|---|---|---|
| Filename | modeM0/AS1G06_116T01_9000001026_07467cztM0_level2.evt | modeM0/AS1G06_116T01_9000001026_07467cztM0_level2_quad_clean.evt |
| Size (bytes) | 447,808,320 | 126,288,000 |
| Size | 427.1 MB | 120.4 MB |
| Events in quadrant A | 3,048,948 | 856,801 |
| Events in quadrant B | 3,352,207 | 866,371 |
| Events in quadrant C | 2,973,450 | 850,372 |
| Events in quadrant D | 3,755,706 | 808,364 |
| Mode M0 | |||
|---|---|---|---|
| Quadrant | BADHDUFLAG | Total packets | Discarded packets |
| A | 0 | 13152 | 2 |
| B | 0 | 14258 | 1 |
| C | 0 | 13006 | 1 |
| D | 0 | 15147 | 1 |
| Mode SS | |||
|---|---|---|---|
| Quadrant | BADHDUFLAG | Total packets | Discarded packets |
| A | 0 | 130 | 0 |
| B | 0 | 130 | 0 |
| C | 0 | 130 | 0 |
| D | 0 | 130 | 0 |
| Mode M9 | |||
|---|---|---|---|
| Quadrant | BADHDUFLAG | Total packets | Discarded packets |
| A | 0 | 12 | 0 |
| B | 0 | 12 | 0 |
| C | 0 | 12 | 0 |
| D | 0 | 12 | 0 |
| Quadrant | Total seconds | Saturated seconds | Saturation percentage |
|---|---|---|---|
| A | 6347 | 67 | 1.055617% |
| B | 6347 | 105 | 1.654325% |
| C | 6347 | 51 | 0.803529% |
| D | 6347 | 120 | 1.890657% |
Noise dominated data is calculated using 1-second bins in cleaned event files. If a bin has >2000 counts, and if more than 50% of those come from <1% of pixels, then it is considered to be noise-dominated and hence unusable.
| Quadrant | # 1 sec bins | Bins with >0 counts | Bins with >2000 counts | High rate bins dominated by noise | Noise dominated (total time) | Noise dominated (detector-on time) | Marked lightcurve |
|---|---|---|---|---|---|---|---|
| A | 7602 | 6348 | 0 | 0 | 0.00% | 0.00% | 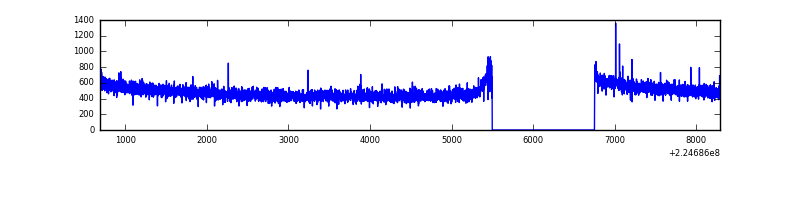 |
| B | 7602 | 6348 | 22 | 22 | 0.29% | 0.35% | 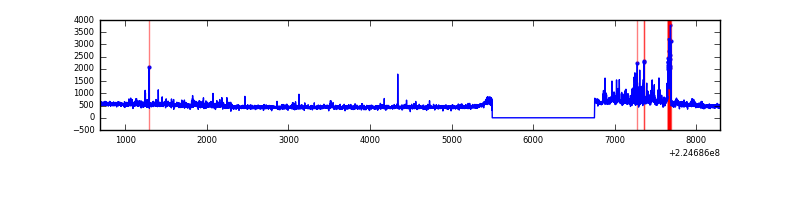 |
| C | 7602 | 6347 | 0 | 0 | 0.00% | 0.00% | 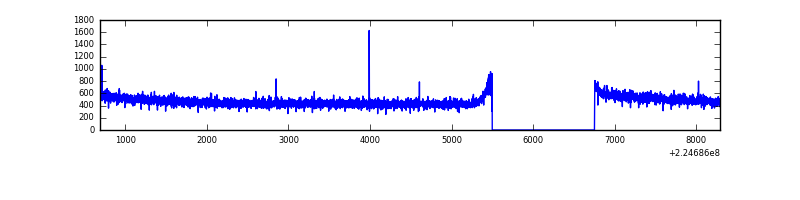 |
| D | 7602 | 6348 | 46 | 46 | 0.61% | 0.72% | 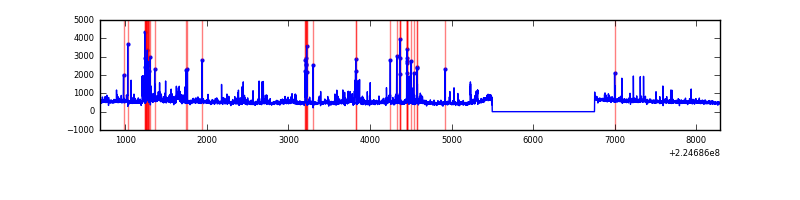 |
Top three noisy pixels from each quadrant. If the there are fewer than three noisy pixels in the level2.evt file, extra rows are filled as -1
| Pixel properties | Quadrant properties | ||||||
|---|---|---|---|---|---|---|---|
| Quadrant | DetID | PixID | Counts | Sigma | Mean | Median | Sigma |
| A | 8 | 15 | 25951 | 161.29 | 777 | 763 | 156.2 |
| A | 15 | 239 | 17397 | 106.51 | 777 | 763 | 156.2 |
| A | 0 | 226 | 7481 | 43.02 | 777 | 763 | 156.2 |
| B | 4 | 173 | 187599 | 1298.16 | 779 | 760 | 143.9 |
| B | 0 | 214 | 125041 | 863.51 | 779 | 760 | 143.9 |
| B | 12 | 111 | 13864 | 91.05 | 779 | 760 | 143.9 |
| C | 13 | 61 | 5981 | 30.2 | 759 | 762 | 172.8 |
| C | 12 | 4 | 4165 | 19.69 | 759 | 762 | 172.8 |
| C | 9 | 68 | 3656 | 16.74 | 759 | 762 | 172.8 |
| D | 12 | 221 | 181430 | 992.87 | 757 | 734 | 182.0 |
| D | 8 | 195 | 158047 | 864.39 | 757 | 734 | 182.0 |
| D | 2 | 14 | 119553 | 652.88 | 757 | 734 | 182.0 |
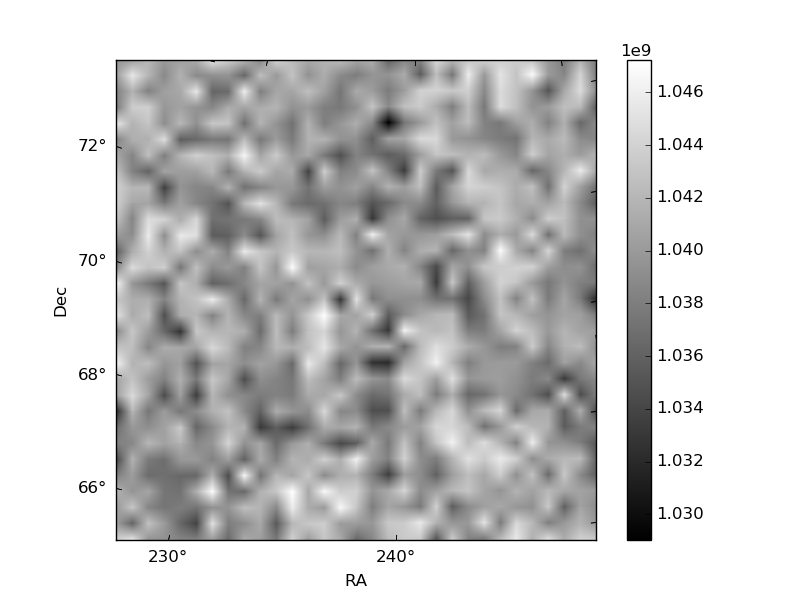
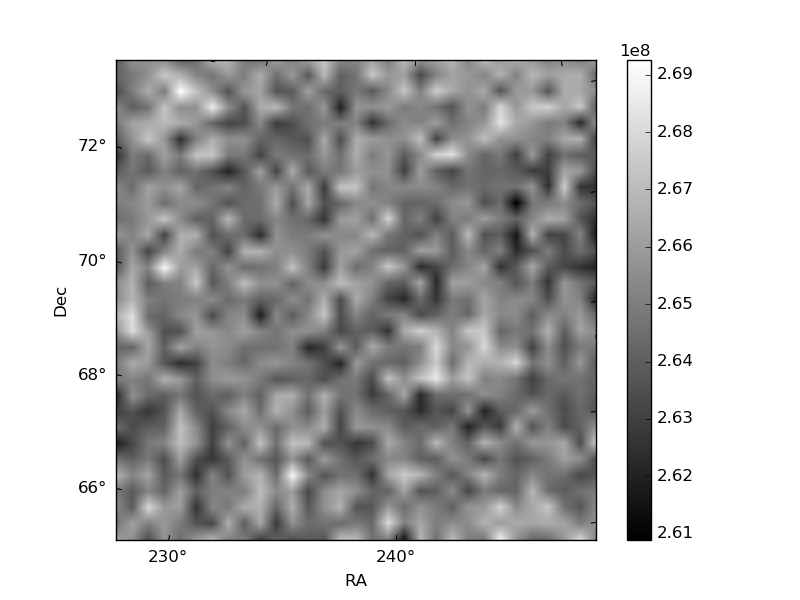
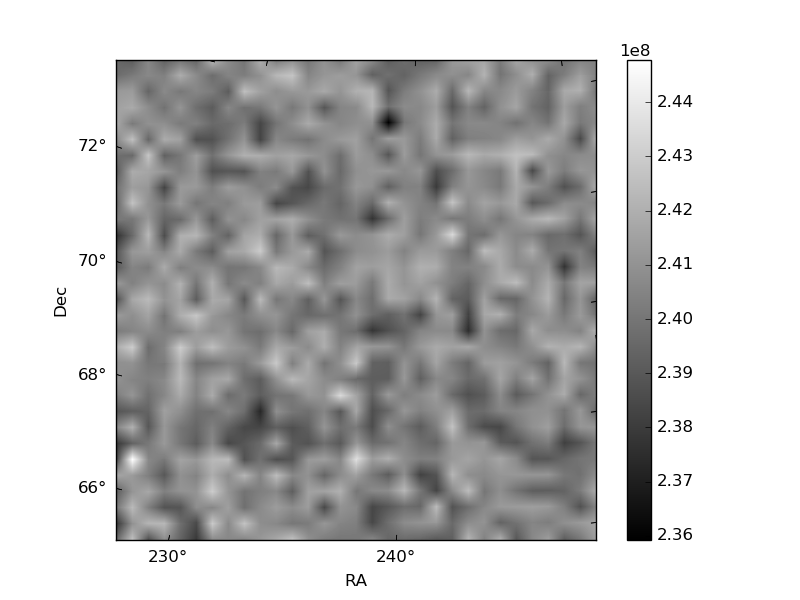
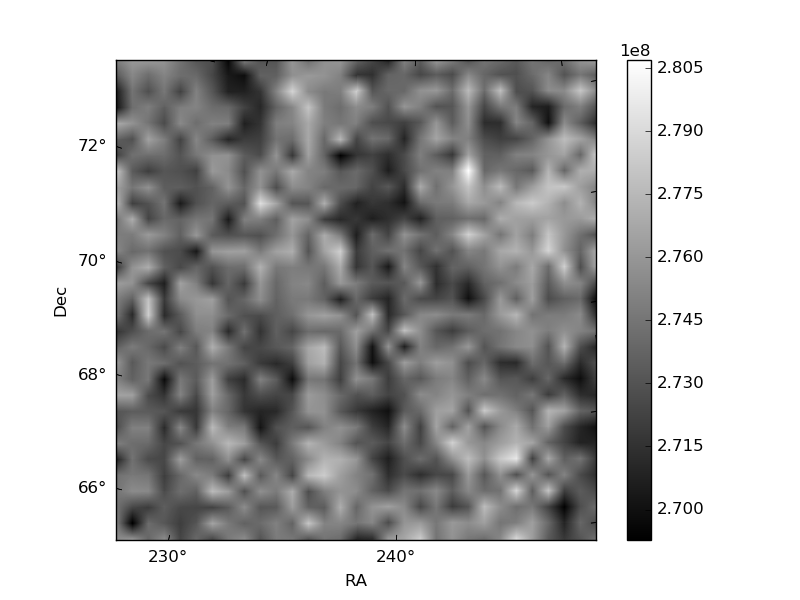
Histogram calculated using DETX and DETY for each event in the final _common_clean file
| Quadrant A | 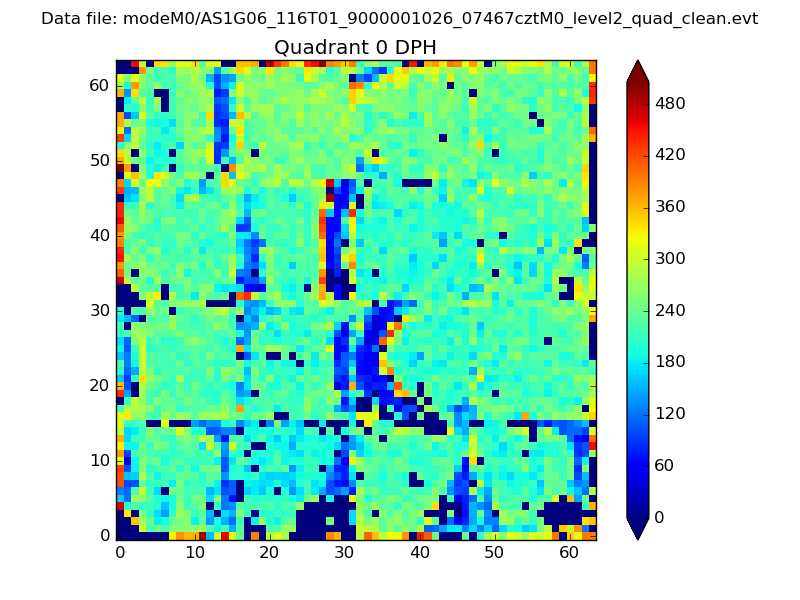 |
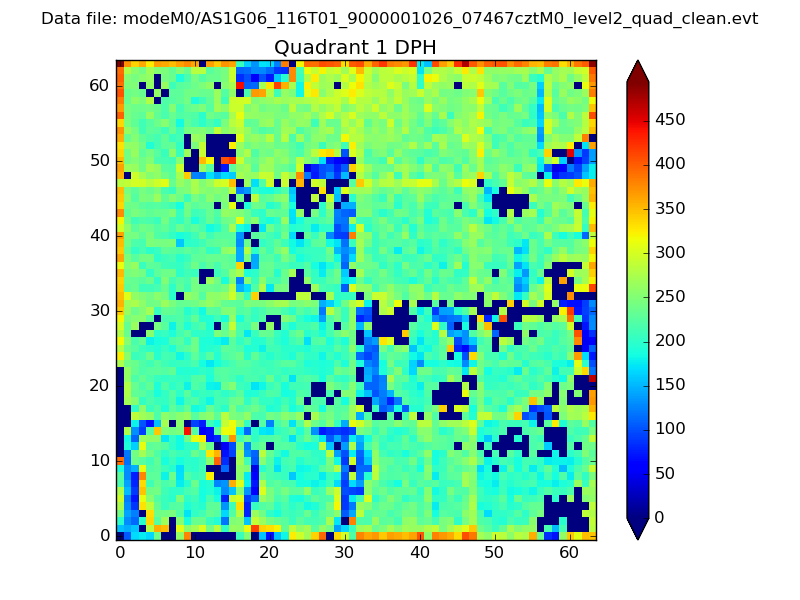 |
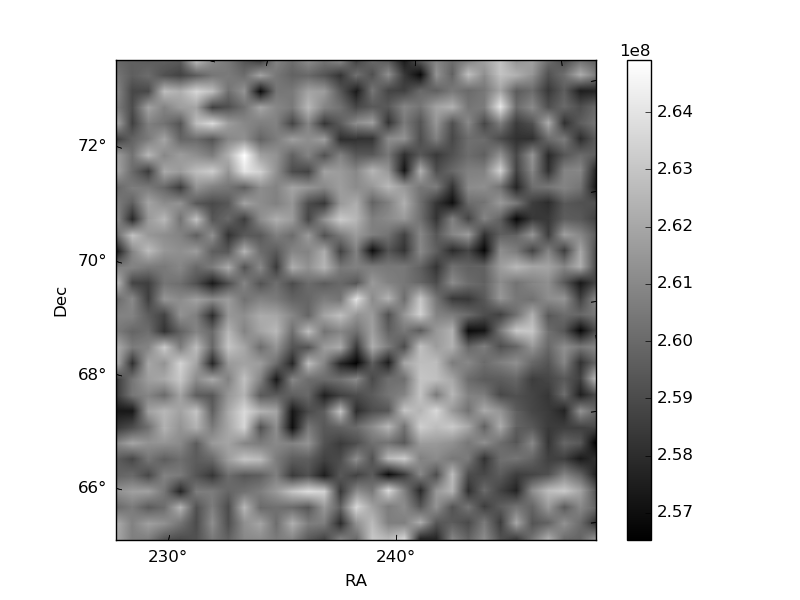
Quadrant B |
|---|---|---|---|
| Quadrant D | 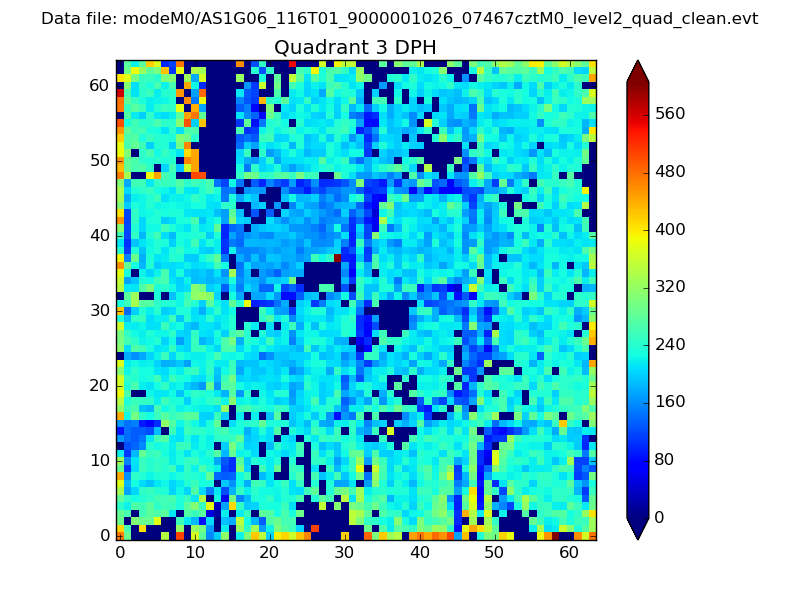 |
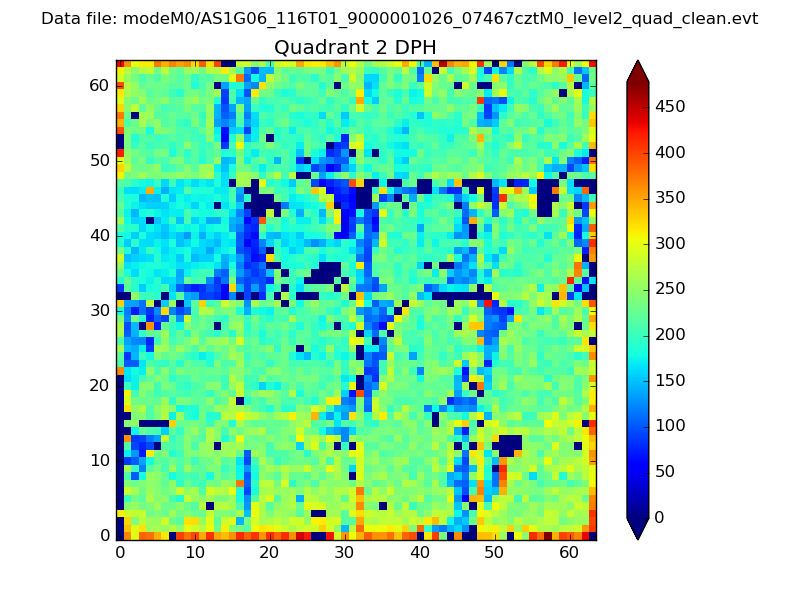 |
Quadrant C |
| Plot type | Count rate plots | Images |
|---|---|---|
| Comparison with Poisson distribution Blue bars denote a histogram of data divided into 1 sec bins. Red curve is a Poisson curve with rate = median count rate of data. |
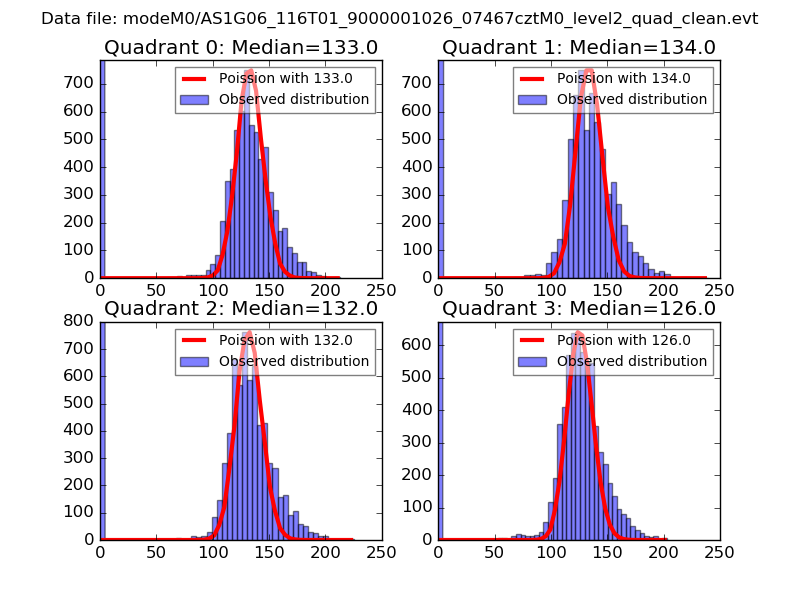 |
 |
| Quadrant-wise count rates Data is divided into 100 sec bins |
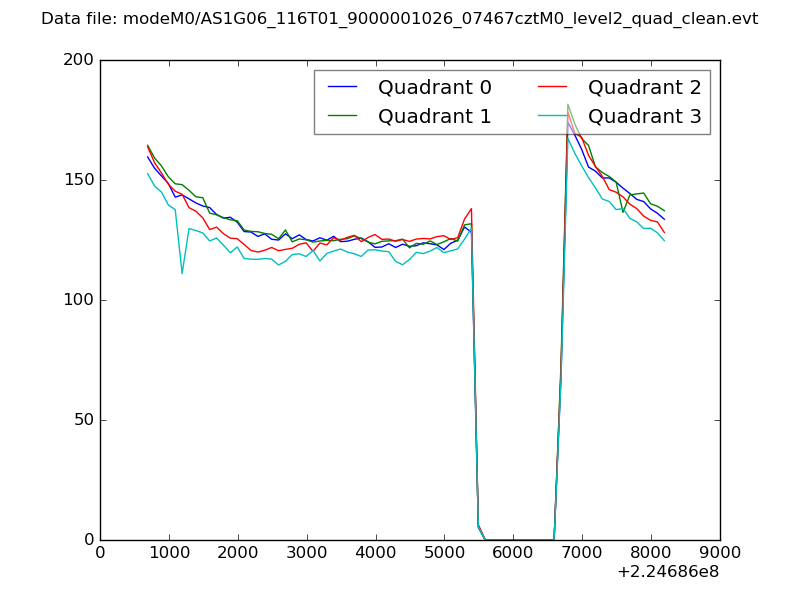 |
|
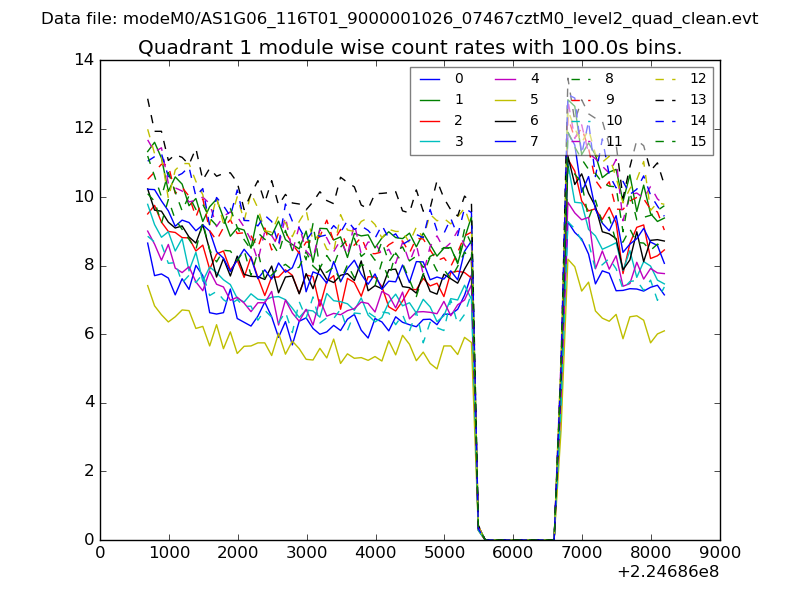
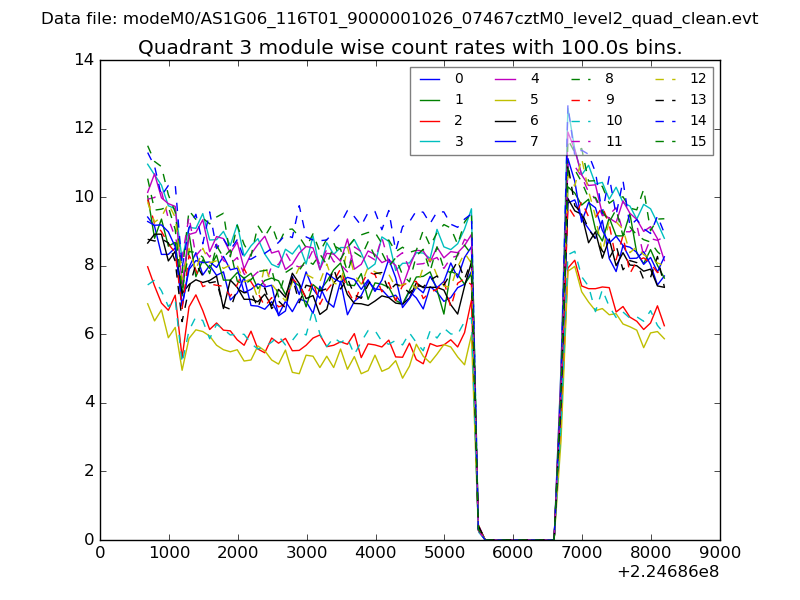
| Module-wise count rates for Quadrant A Data is divided into 100 sec bins |
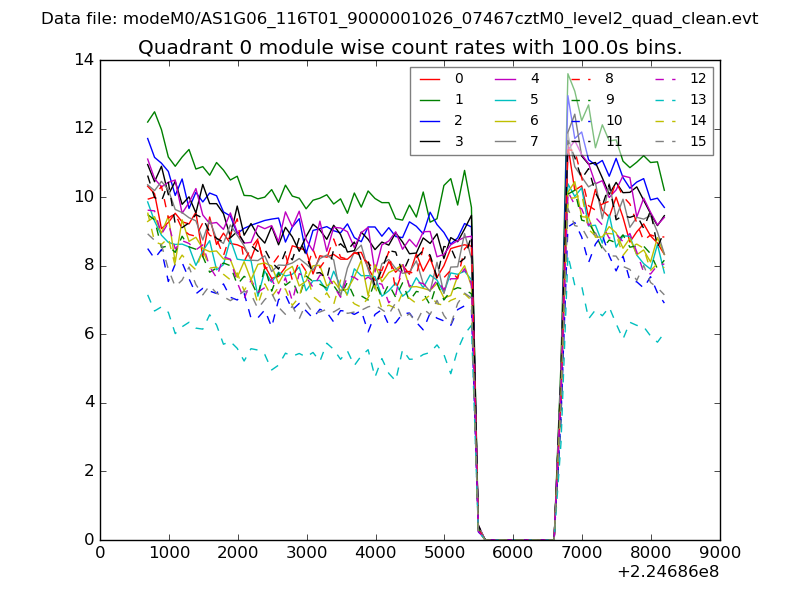 |
 |
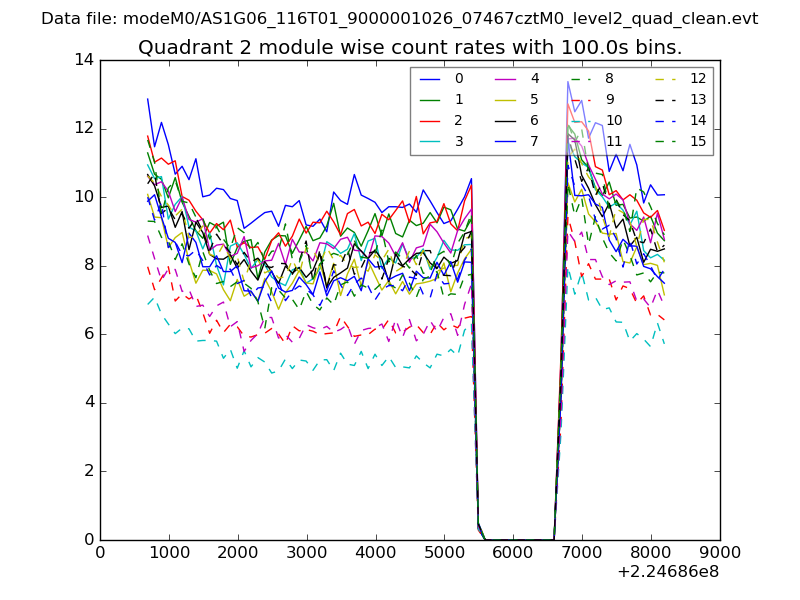
| Module-wise count rates for Quadrant B Data is divided into 100 sec bins |
 |
 |
| Module-wise count rates for Quadrant C Data is divided into 100 sec bins |
 |
 |
| Module-wise count rates for Quadrant D Data is divided into 100 sec bins |
 |
 |
| Parameter | Plot |
|---|---|
| CZT HV Monitor | 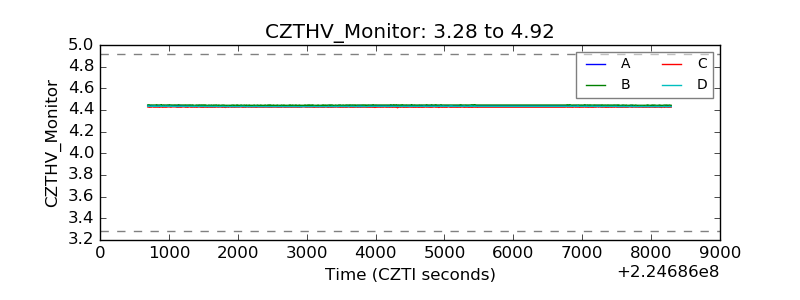 |
| D_VDD | 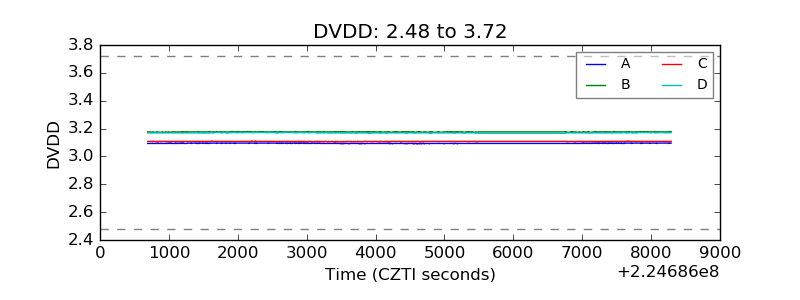 |
| Temperature 1 | 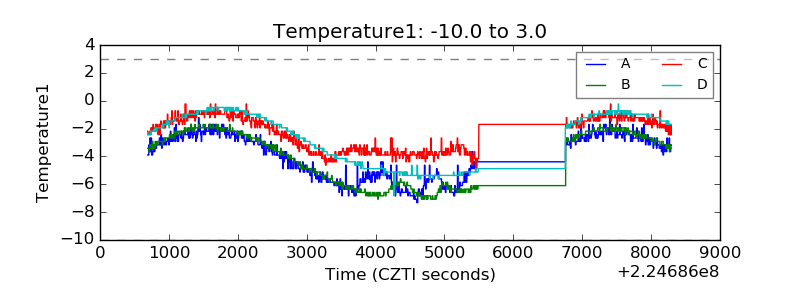 |
| Veto HV Monitor | 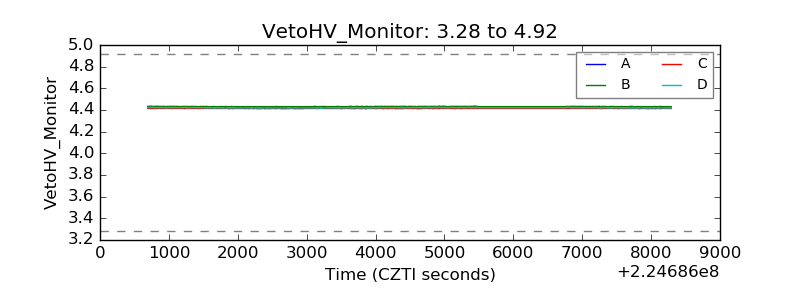 |
| Veto LLD | 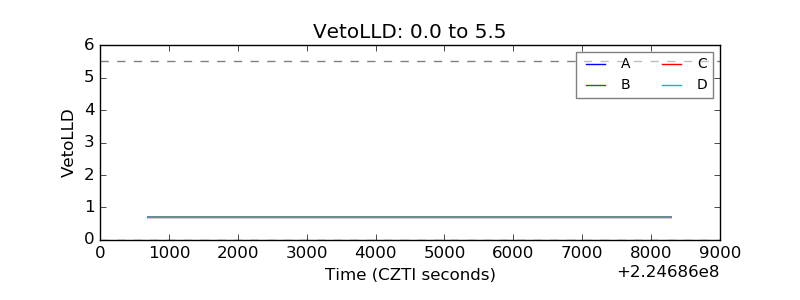 |
| Alpha Counter | 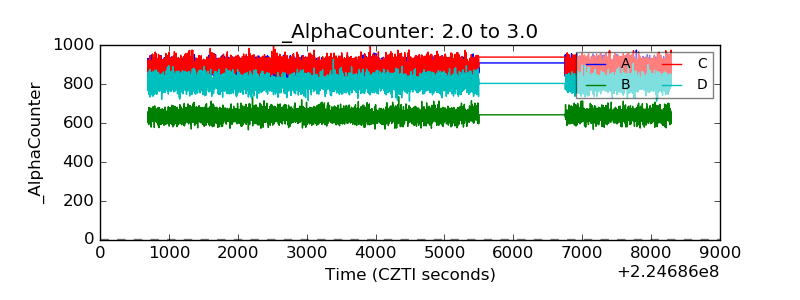 |
| _CPM_Rate | 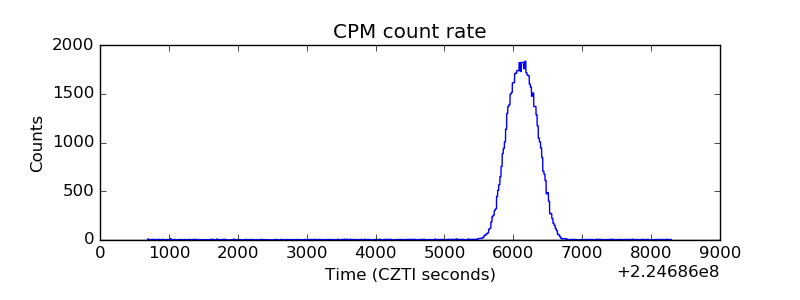 |
| CZT Counter | 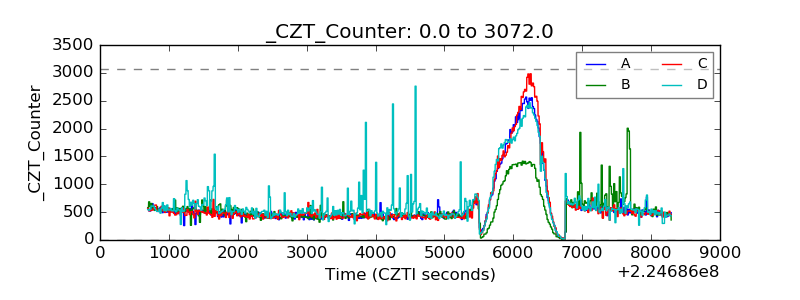 |
| +2.5 Volts monitor |  |
| +5 Volts monitor | 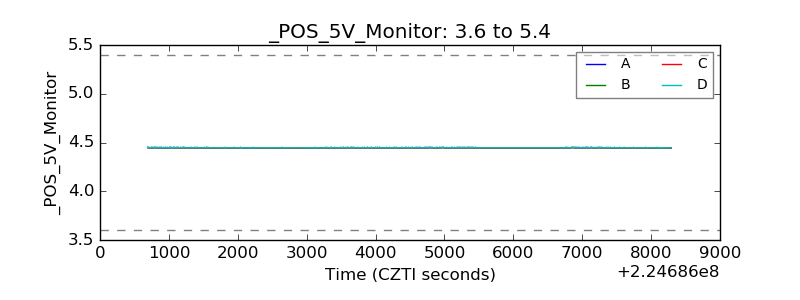 |
| _ROLL_ROT | 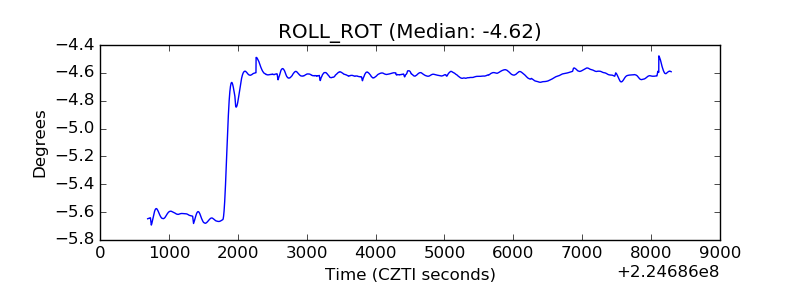 |
| _Roll_DEC | 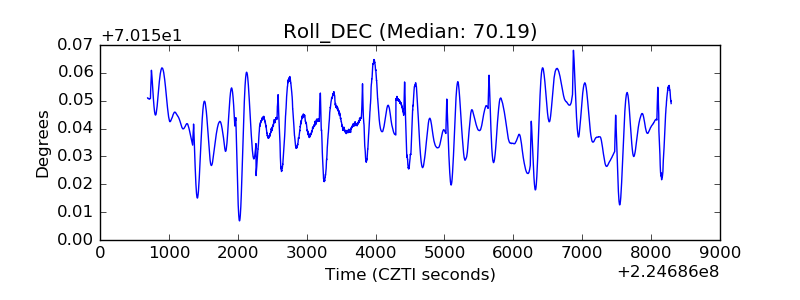 |
| _Roll_RA | 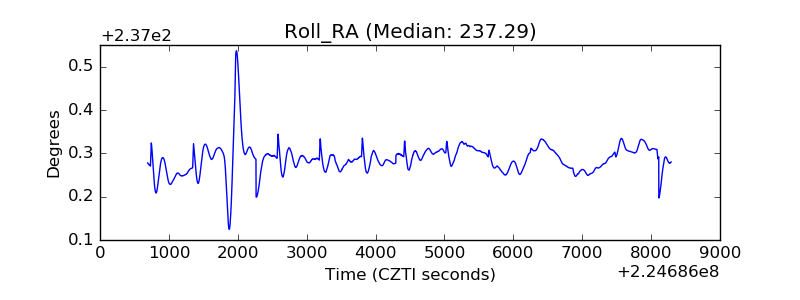 |
| Veto Counter | 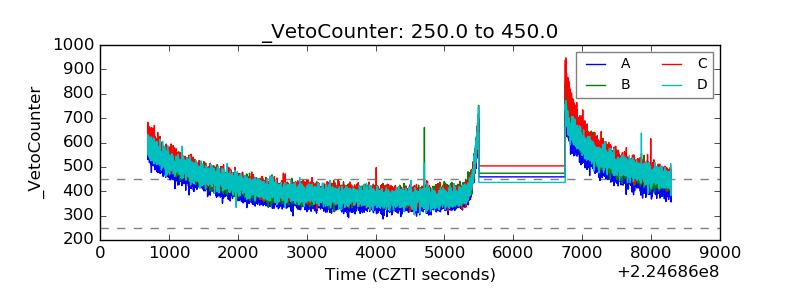 |