| Param | Original file | Final file |
|---|---|---|
| Filename | modeM0/AS1G06_116T01_9000001026_07468cztM0_level2.evt | modeM0/AS1G06_116T01_9000001026_07468cztM0_level2_quad_clean.evt |
| Size (bytes) | 426,934,080 | 122,120,640 |
| Size | 407.2 MB | 116.5 MB |
| Events in quadrant A | 2,914,978 | 822,690 |
| Events in quadrant B | 3,233,325 | 839,967 |
| Events in quadrant C | 2,888,262 | 826,868 |
| Events in quadrant D | 3,479,827 | 784,798 |
| Mode M0 | |||
|---|---|---|---|
| Quadrant | BADHDUFLAG | Total packets | Discarded packets |
| A | 0 | 12663 | 2 |
| B | 0 | 13810 | 1 |
| C | 0 | 12540 | 1 |
| D | 0 | 14084 | 1 |
| Mode SS | |||
|---|---|---|---|
| Quadrant | BADHDUFLAG | Total packets | Discarded packets |
| A | 0 | 124 | 0 |
| B | 0 | 124 | 0 |
| C | 0 | 124 | 0 |
| D | 0 | 124 | 0 |
| Mode M9 | |||
|---|---|---|---|
| Quadrant | BADHDUFLAG | Total packets | Discarded packets |
| A | 0 | 12 | 0 |
| B | 0 | 12 | 0 |
| C | 0 | 12 | 0 |
| D | 0 | 12 | 0 |
| Quadrant | Total seconds | Saturated seconds | Saturation percentage |
|---|---|---|---|
| A | 6076 | 92 | 1.514154% |
| B | 6076 | 132 | 2.172482% |
| C | 6076 | 85 | 1.398947% |
| D | 6076 | 139 | 2.287689% |
Noise dominated data is calculated using 1-second bins in cleaned event files. If a bin has >2000 counts, and if more than 50% of those come from <1% of pixels, then it is considered to be noise-dominated and hence unusable.
| Quadrant | # 1 sec bins | Bins with >0 counts | Bins with >2000 counts | High rate bins dominated by noise | Noise dominated (total time) | Noise dominated (detector-on time) | Marked lightcurve |
|---|---|---|---|---|---|---|---|
| A | 7336 | 6076 | 0 | 0 | 0.00% | 0.00% | 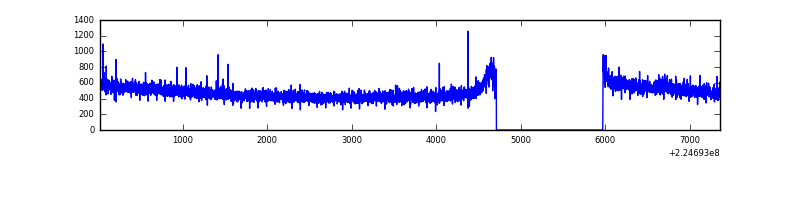 |
| B | 7336 | 6077 | 25 | 25 | 0.34% | 0.41% | 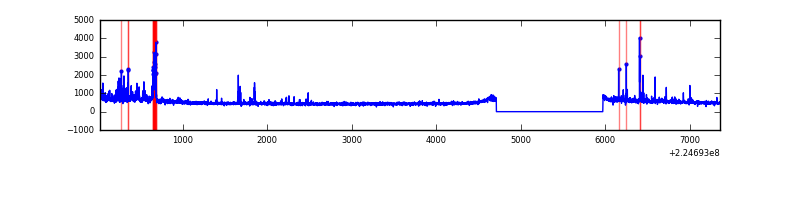 |
| C | 7336 | 6077 | 1 | 1 | 0.01% | 0.02% | 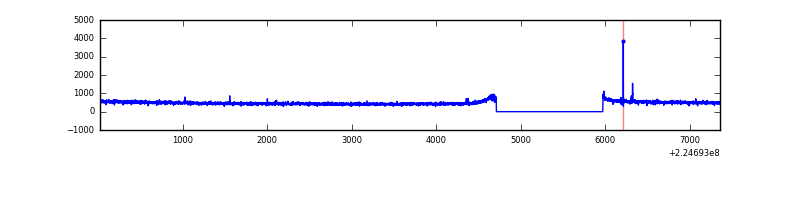 |
| D | 7336 | 6076 | 61 | 61 | 0.83% | 1.00% | 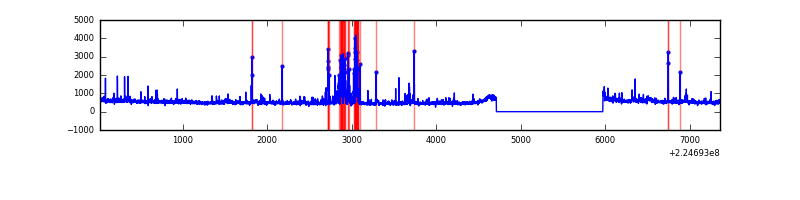 |
Top three noisy pixels from each quadrant. If the there are fewer than three noisy pixels in the level2.evt file, extra rows are filled as -1
| Pixel properties | Quadrant properties | ||||||
|---|---|---|---|---|---|---|---|
| Quadrant | DetID | PixID | Counts | Sigma | Mean | Median | Sigma |
| A | 8 | 15 | 20524 | 132.57 | 748 | 733 | 149.3 |
| A | 15 | 239 | 11258 | 70.5 | 748 | 733 | 149.3 |
| A | 0 | 226 | 7194 | 43.28 | 748 | 733 | 149.3 |
| B | 4 | 173 | 159329 | 1139.34 | 753 | 734 | 139.2 |
| B | 0 | 214 | 116197 | 829.48 | 753 | 734 | 139.2 |
| B | 11 | 51 | 34307 | 241.19 | 753 | 734 | 139.2 |
| C | 1 | 16 | 11306 | 63.11 | 736 | 740 | 167.4 |
| C | 13 | 61 | 5762 | 29.99 | 736 | 740 | 167.4 |
| C | 14 | 67 | 2327 | 9.48 | 736 | 740 | 167.4 |
| D | 12 | 221 | 191715 | 1097.61 | 731 | 710 | 174.0 |
| D | 14 | 34 | 160538 | 918.46 | 731 | 710 | 174.0 |
| D | 2 | 14 | 113172 | 646.27 | 731 | 710 | 174.0 |
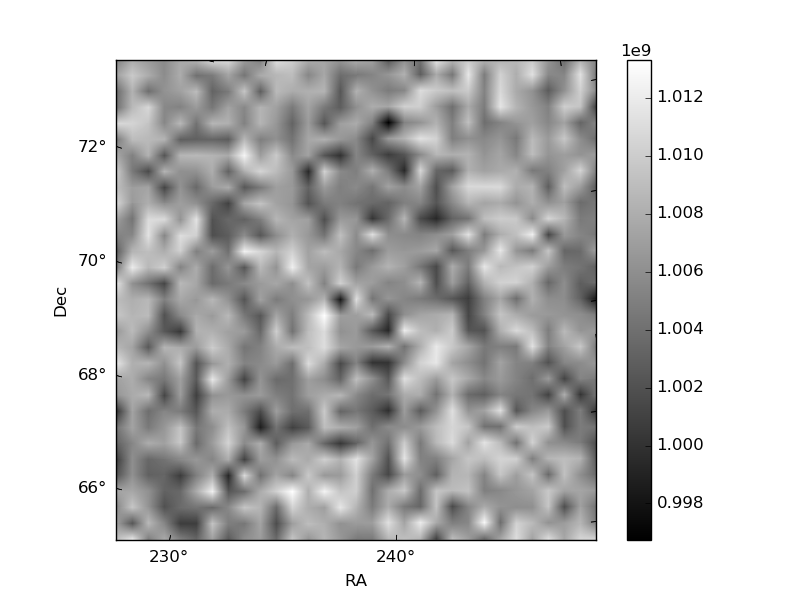
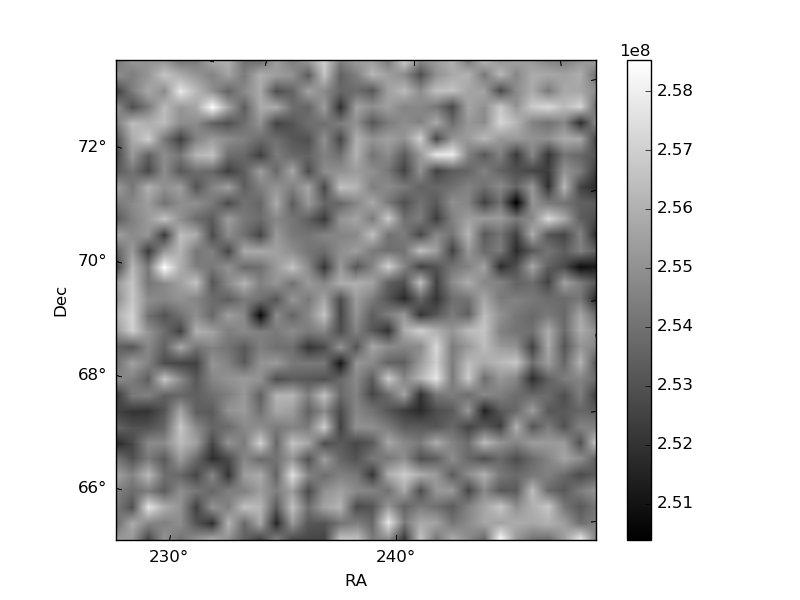
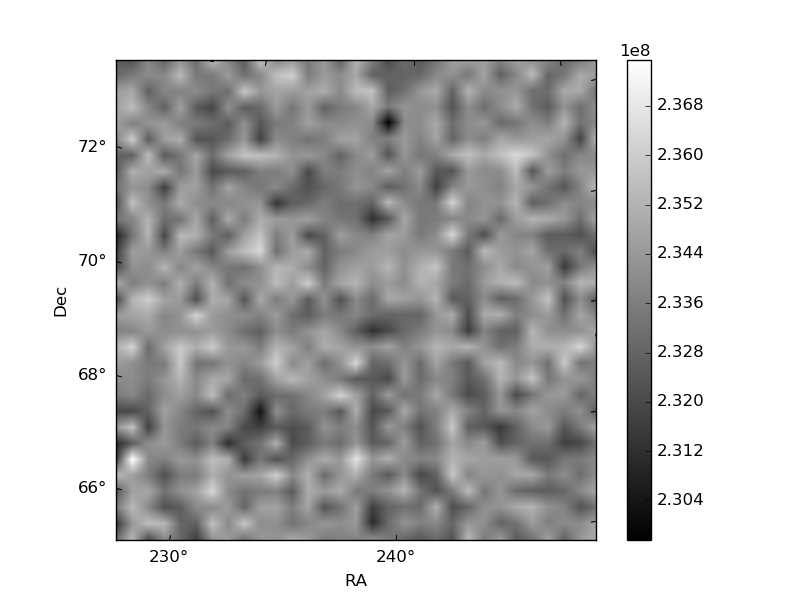
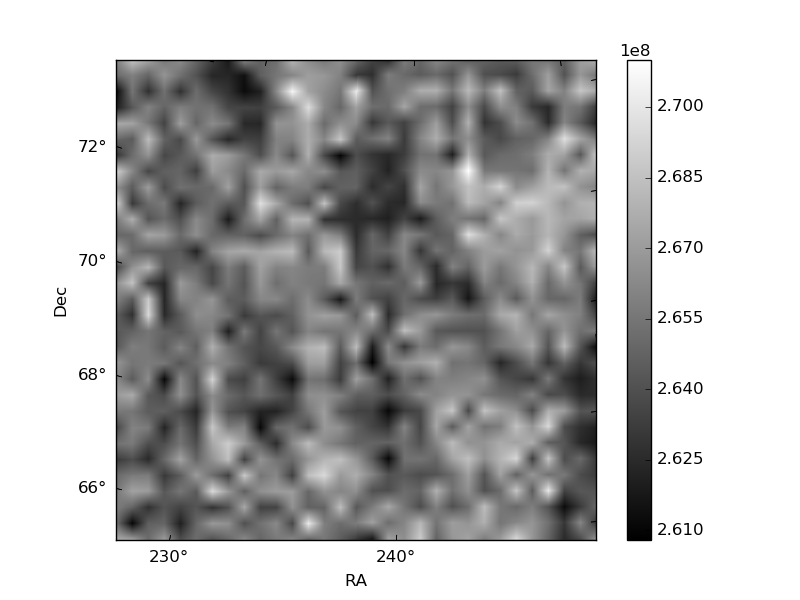
Histogram calculated using DETX and DETY for each event in the final _common_clean file
| Quadrant A | 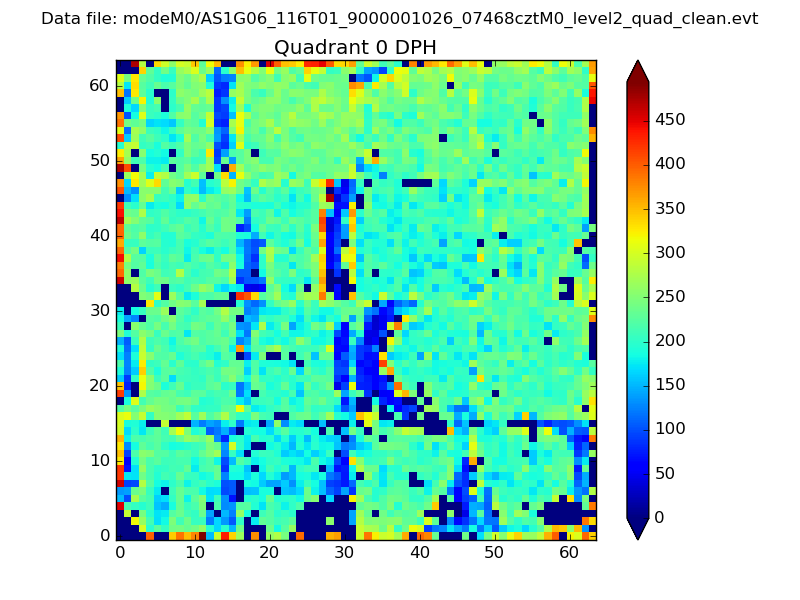 |
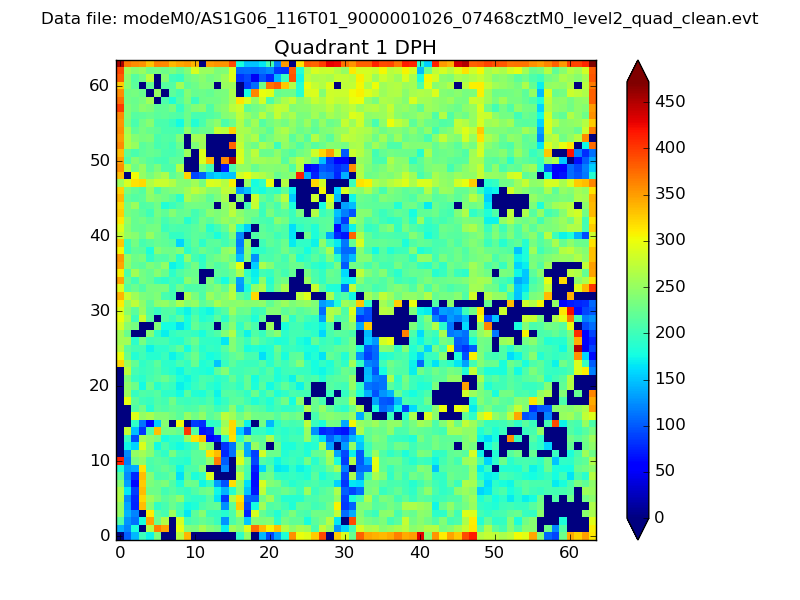 |
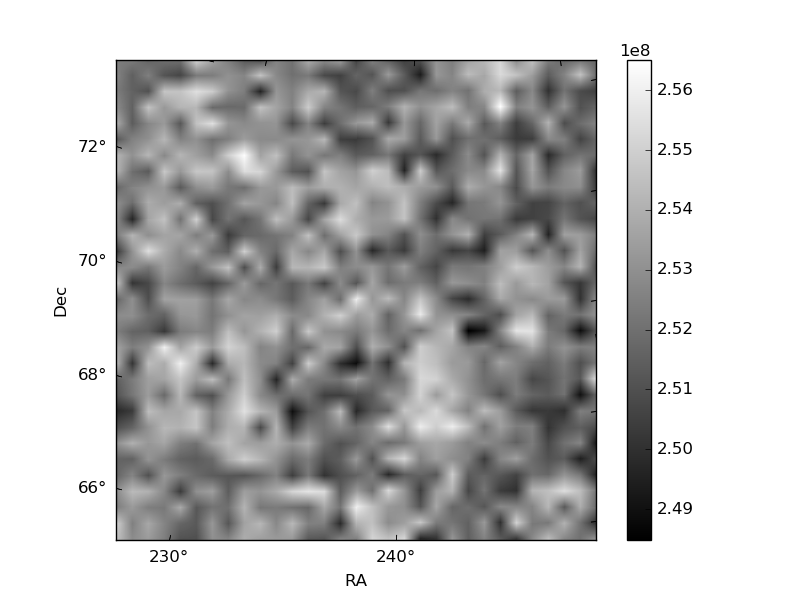
Quadrant B |
|---|---|---|---|
| Quadrant D | 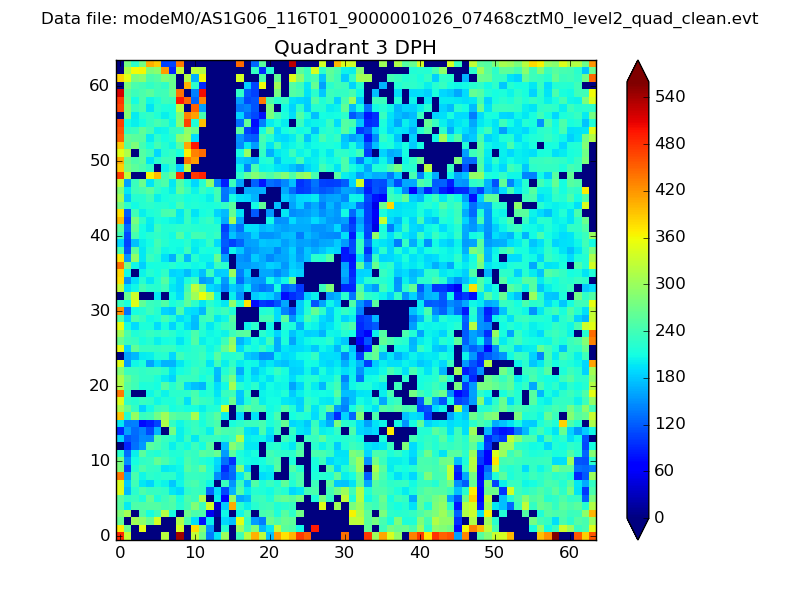 |
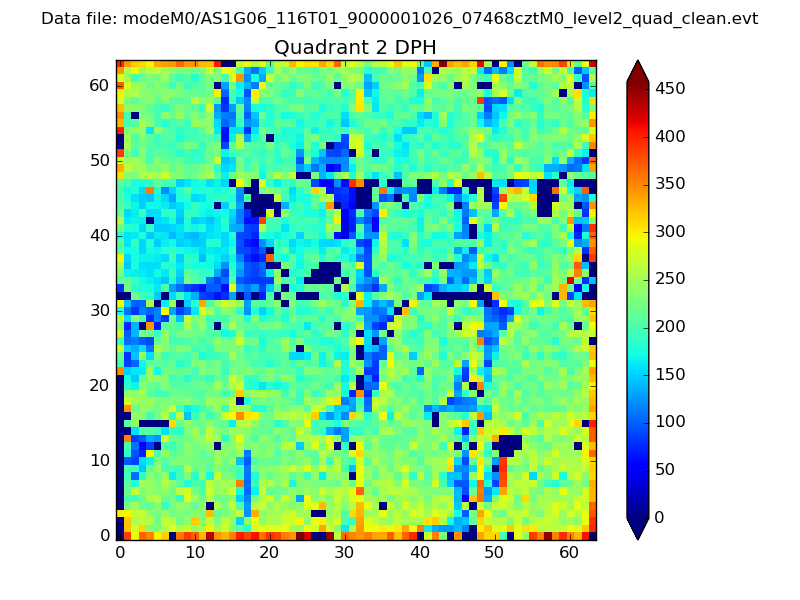 |
Quadrant C |
| Plot type | Count rate plots | Images |
|---|---|---|
| Comparison with Poisson distribution Blue bars denote a histogram of data divided into 1 sec bins. Red curve is a Poisson curve with rate = median count rate of data. |
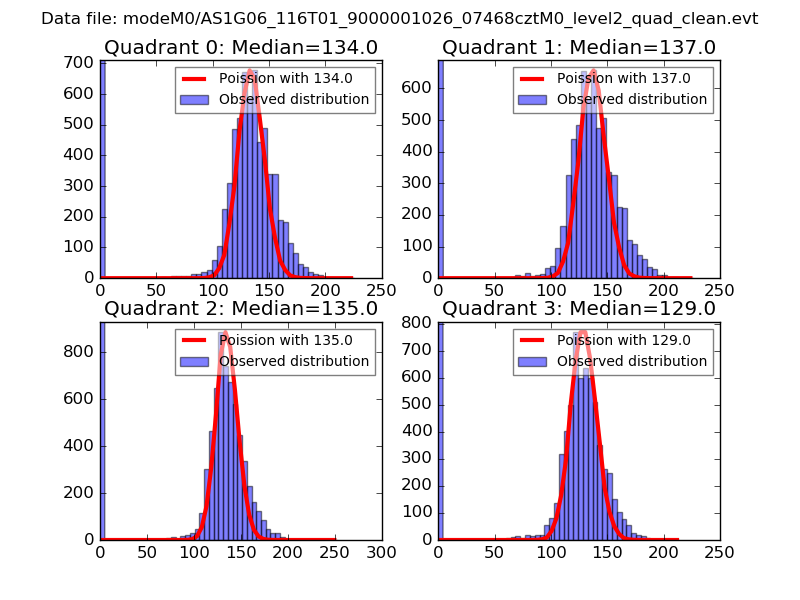 |
 |
| Quadrant-wise count rates Data is divided into 100 sec bins |
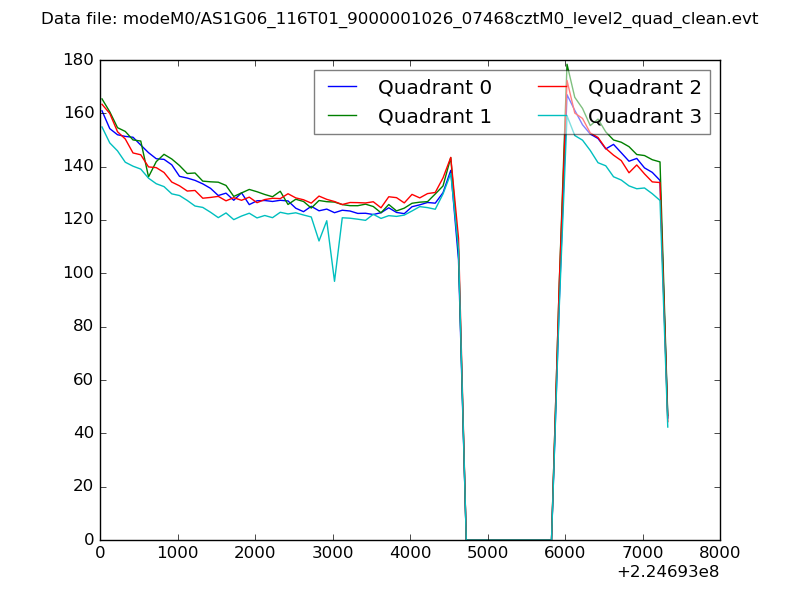 |
|
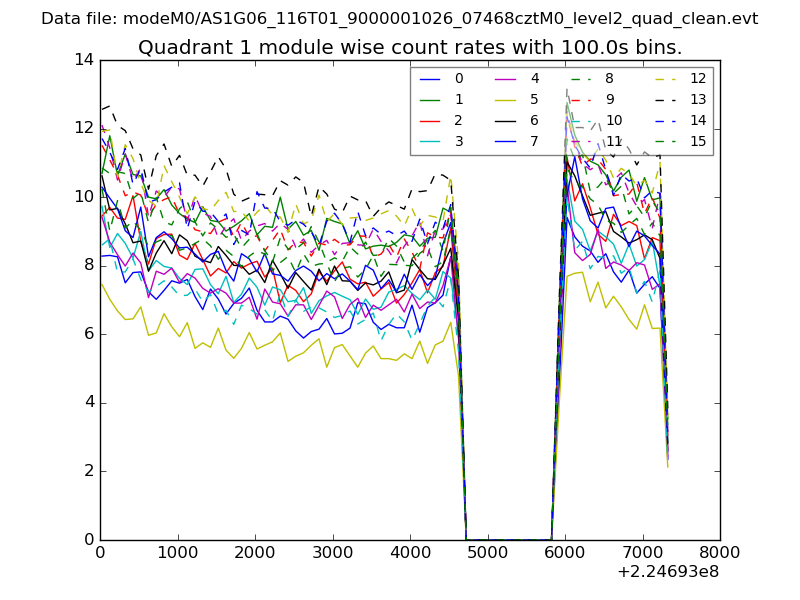
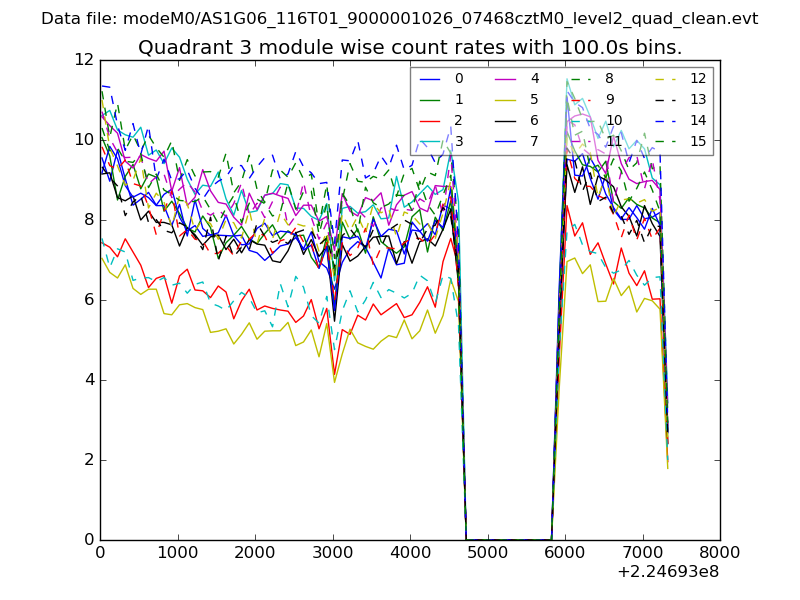
| Module-wise count rates for Quadrant A Data is divided into 100 sec bins |
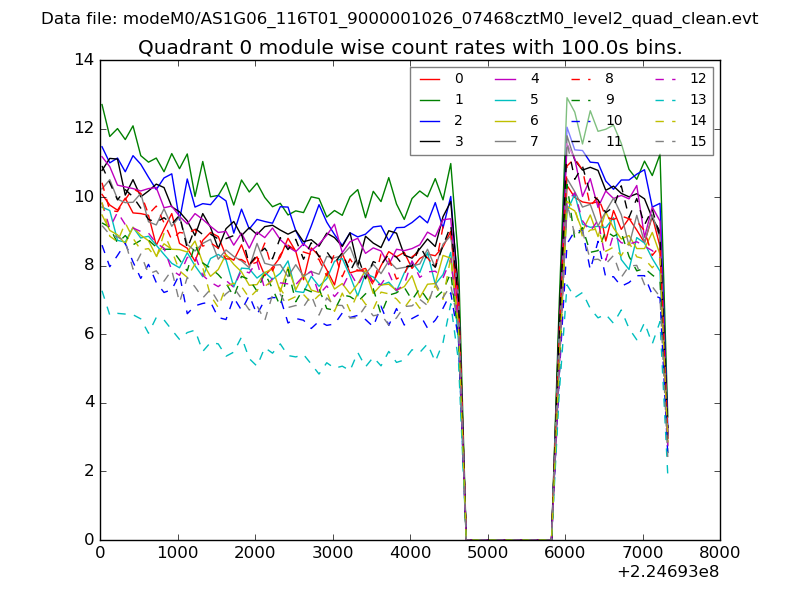 |
 |
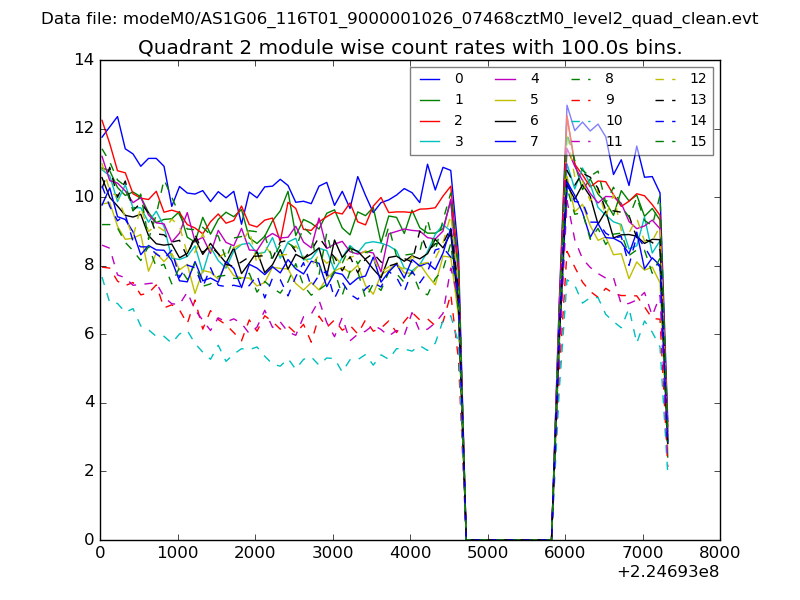
| Module-wise count rates for Quadrant B Data is divided into 100 sec bins |
 |
 |
| Module-wise count rates for Quadrant C Data is divided into 100 sec bins |
 |
 |
| Module-wise count rates for Quadrant D Data is divided into 100 sec bins |
 |
 |
| Parameter | Plot |
|---|---|
| CZT HV Monitor | 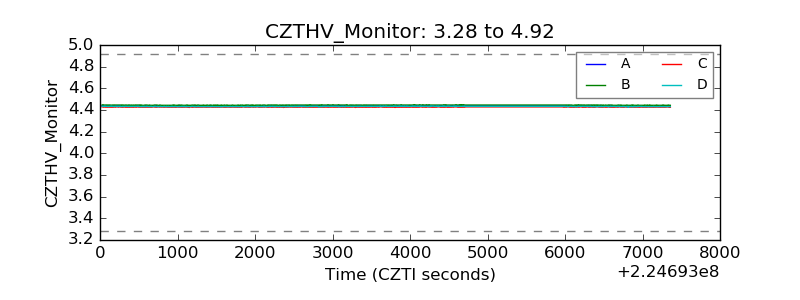 |
| D_VDD | 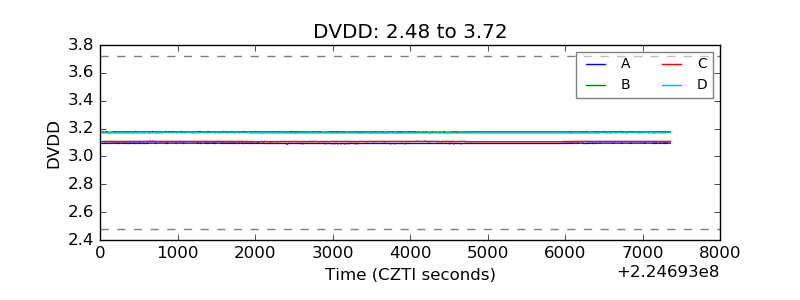 |
| Temperature 1 | 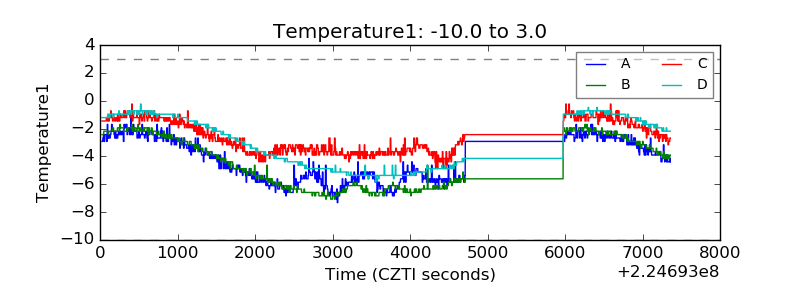 |
| Veto HV Monitor | 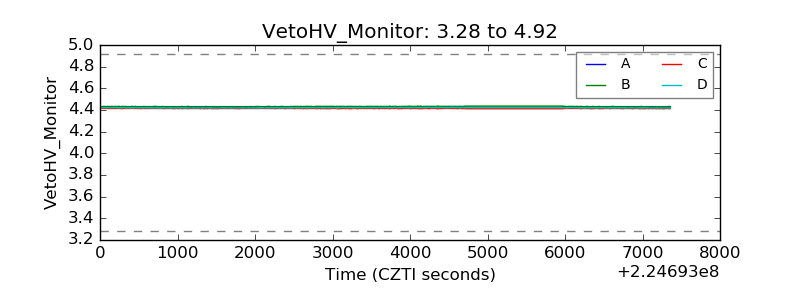 |
| Veto LLD | 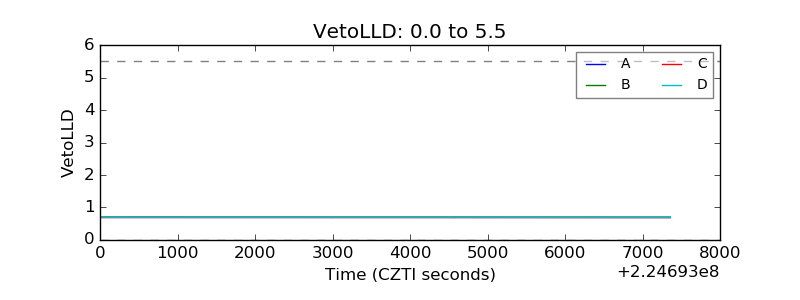 |
| Alpha Counter | 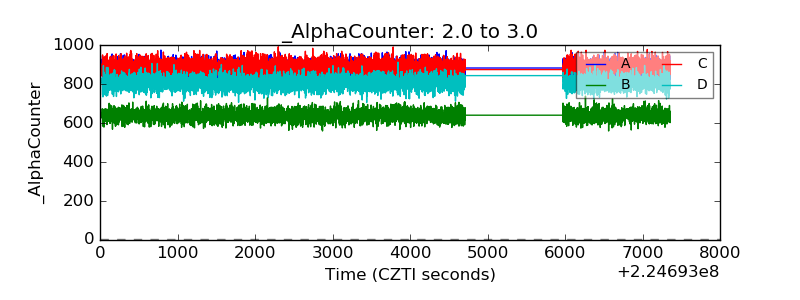 |
| _CPM_Rate | 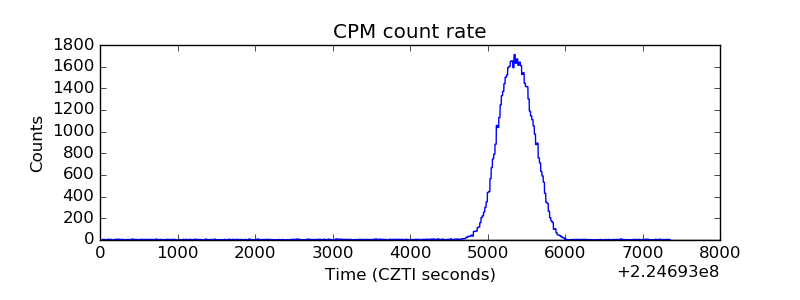 |
| CZT Counter | 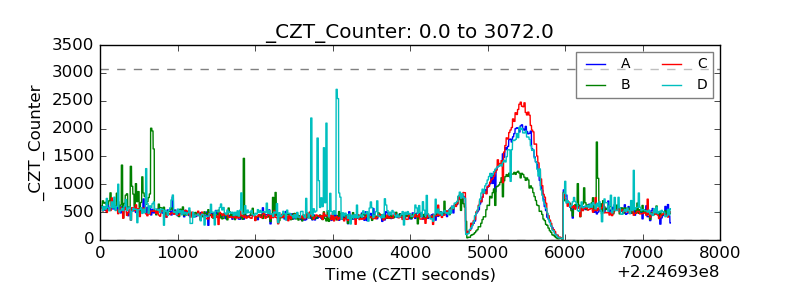 |
| +2.5 Volts monitor |  |
| +5 Volts monitor | 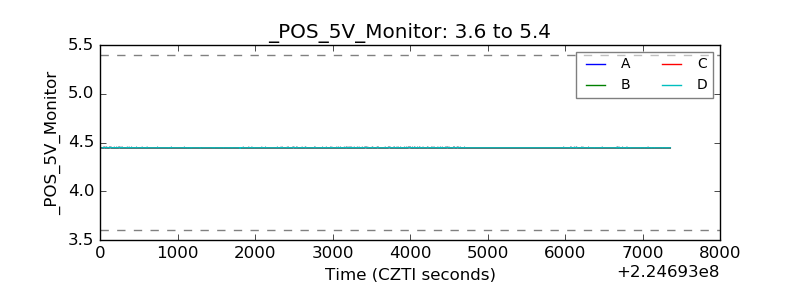 |
| _ROLL_ROT | 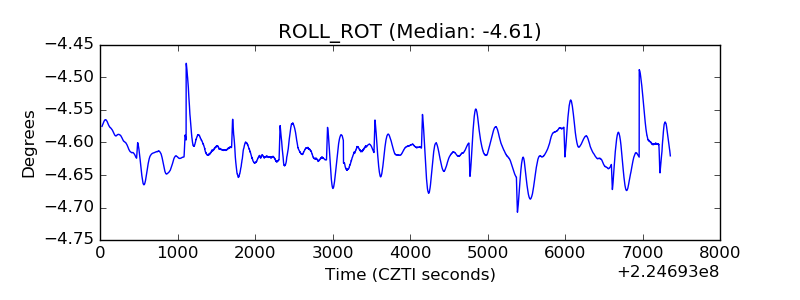 |
| _Roll_DEC | 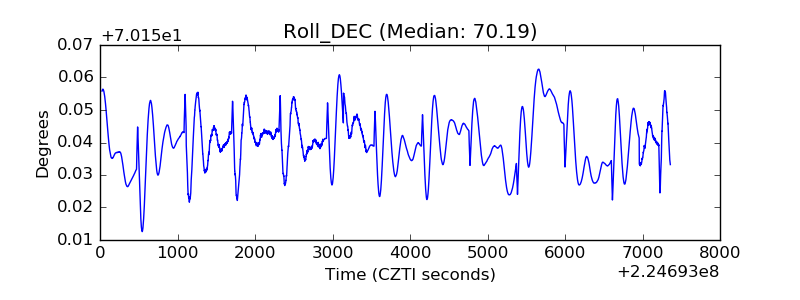 |
| _Roll_RA | 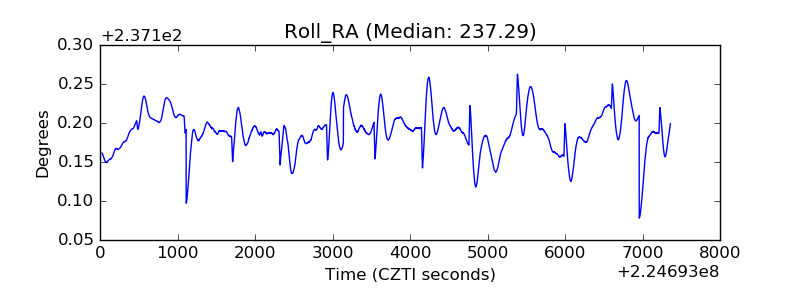 |
| Veto Counter | 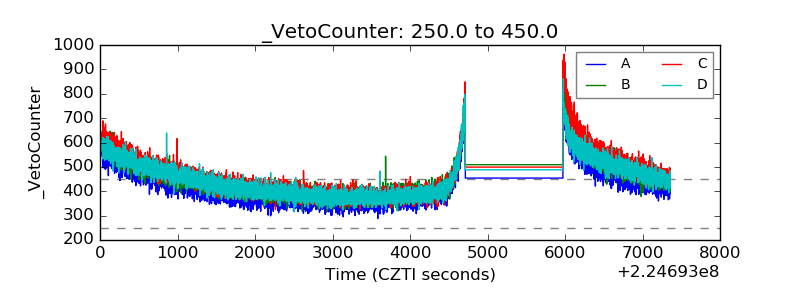 |