| Param | Original file | Final file |
|---|---|---|
| Filename | modeM0/AS1G06_116T01_9000001026_07469cztM0_level2.evt | modeM0/AS1G06_116T01_9000001026_07469cztM0_level2_quad_clean.evt |
| Size (bytes) | 393,140,160 | 114,992,640 |
| Size | 374.9 MB | 109.7 MB |
| Events in quadrant A | 2,711,534 | 769,127 |
| Events in quadrant B | 2,829,282 | 789,405 |
| Events in quadrant C | 2,719,920 | 777,649 |
| Events in quadrant D | 3,247,326 | 737,745 |
| Mode M0 | |||
|---|---|---|---|
| Quadrant | BADHDUFLAG | Total packets | Discarded packets |
| A | 0 | 12019 | 2 |
| B | 0 | 12361 | 1 |
| C | 0 | 11983 | 1 |
| D | 0 | 13516 | 1 |
| Mode SS | |||
|---|---|---|---|
| Quadrant | BADHDUFLAG | Total packets | Discarded packets |
| A | 0 | 120 | 0 |
| B | 0 | 120 | 0 |
| C | 0 | 120 | 0 |
| D | 0 | 120 | 0 |
| Mode M9 | |||
|---|---|---|---|
| Quadrant | BADHDUFLAG | Total packets | Discarded packets |
| A | 0 | 13 | 0 |
| B | 0 | 13 | 0 |
| C | 0 | 13 | 0 |
| D | 0 | 13 | 0 |
| Quadrant | Total seconds | Saturated seconds | Saturation percentage |
|---|---|---|---|
| A | 5849 | 51 | 0.871944% |
| B | 5849 | 73 | 1.248077% |
| C | 5849 | 44 | 0.752265% |
| D | 5849 | 80 | 1.367755% |
Noise dominated data is calculated using 1-second bins in cleaned event files. If a bin has >2000 counts, and if more than 50% of those come from <1% of pixels, then it is considered to be noise-dominated and hence unusable.
| Quadrant | # 1 sec bins | Bins with >0 counts | Bins with >2000 counts | High rate bins dominated by noise | Noise dominated (total time) | Noise dominated (detector-on time) | Marked lightcurve |
|---|---|---|---|---|---|---|---|
| A | 7169 | 5850 | 0 | 0 | 0.00% | 0.00% | 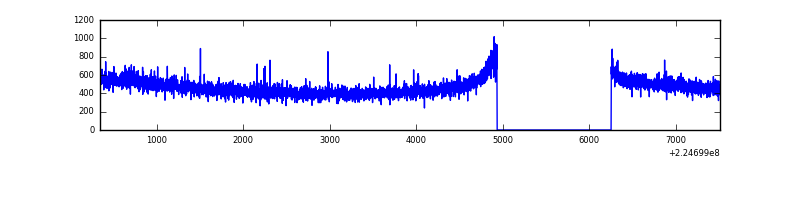 |
| B | 7169 | 5850 | 3 | 3 | 0.04% | 0.05% | 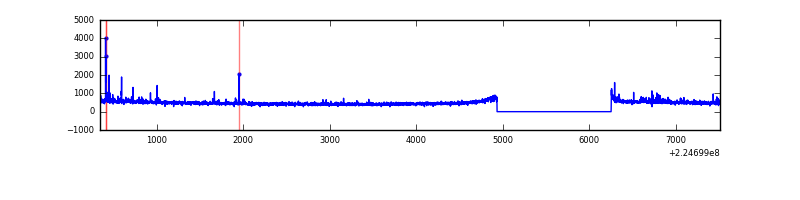 |
| C | 7169 | 5850 | 2 | 2 | 0.03% | 0.03% | 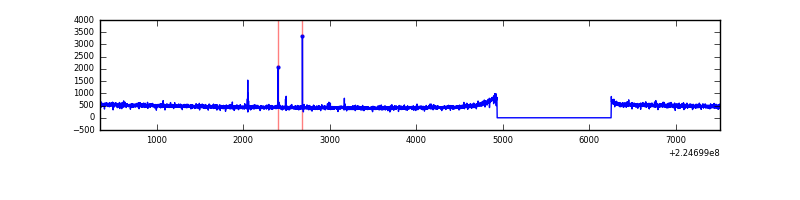 |
| D | 7169 | 5850 | 33 | 33 | 0.46% | 0.56% | 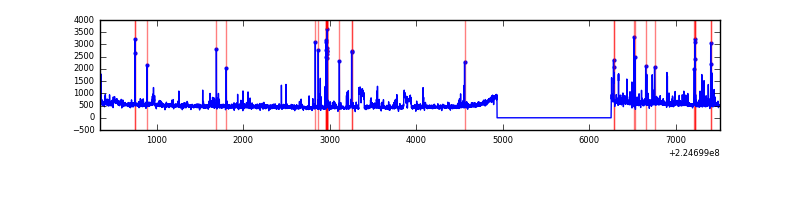 |
Top three noisy pixels from each quadrant. If the there are fewer than three noisy pixels in the level2.evt file, extra rows are filled as -1
| Pixel properties | Quadrant properties | ||||||
|---|---|---|---|---|---|---|---|
| Quadrant | DetID | PixID | Counts | Sigma | Mean | Median | Sigma |
| A | 8 | 15 | 17824 | 122.5 | 697 | 684 | 139.9 |
| A | 3 | 1 | 6656 | 42.68 | 697 | 684 | 139.9 |
| A | 0 | 226 | 6615 | 42.39 | 697 | 684 | 139.9 |
| B | 0 | 214 | 76704 | 575.14 | 707 | 690 | 132.2 |
| B | 11 | 51 | 13380 | 96.01 | 707 | 690 | 132.2 |
| B | 12 | 111 | 12951 | 92.77 | 707 | 690 | 132.2 |
| C | 1 | 16 | 14565 | 88.05 | 691 | 694 | 157.5 |
| C | 13 | 61 | 5484 | 30.4 | 691 | 694 | 157.5 |
| C | 9 | 68 | 5176 | 28.45 | 691 | 694 | 157.5 |
| D | 12 | 221 | 201187 | 1217.51 | 686 | 666 | 164.7 |
| D | 13 | 105 | 180046 | 1089.14 | 686 | 666 | 164.7 |
| D | 13 | 169 | 69964 | 420.76 | 686 | 666 | 164.7 |
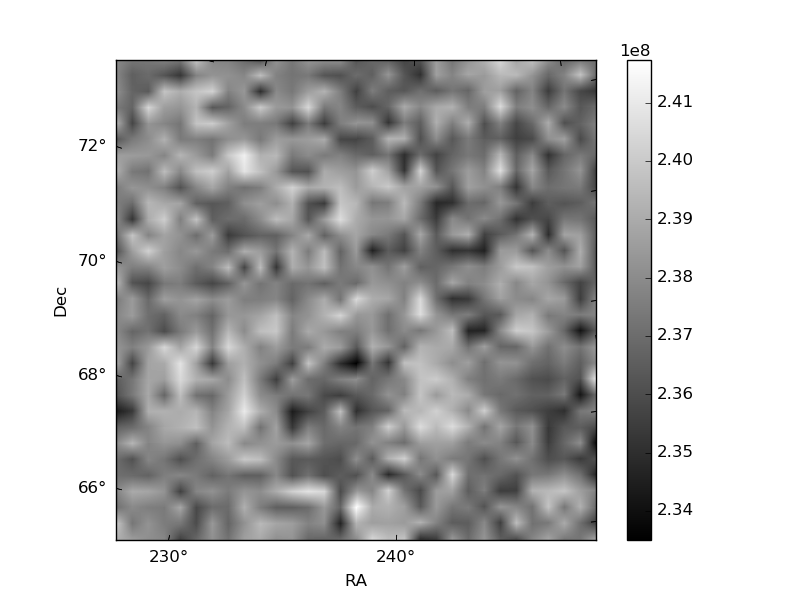
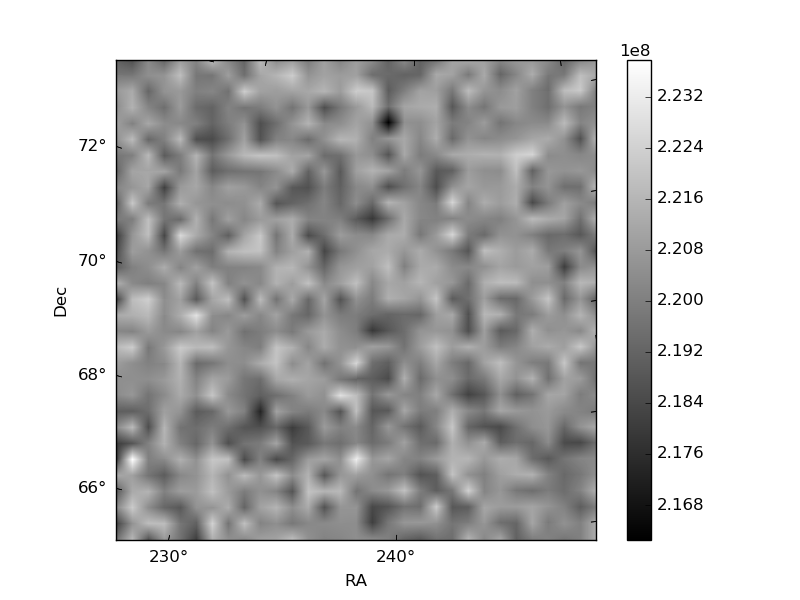
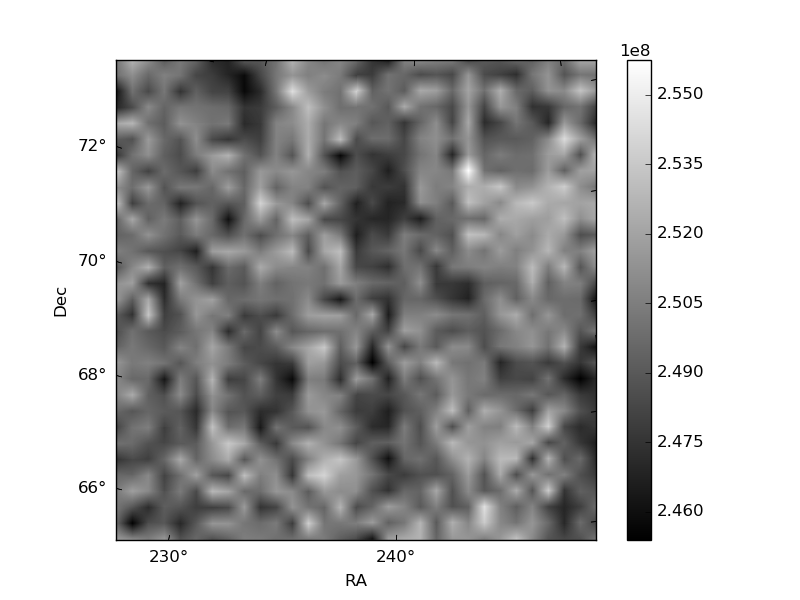
Histogram calculated using DETX and DETY for each event in the final _common_clean file
| Quadrant A | 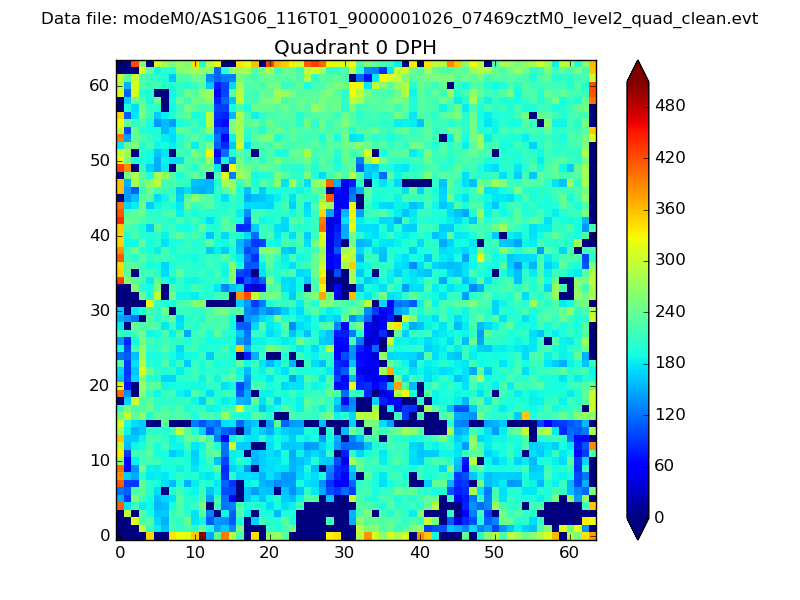 |
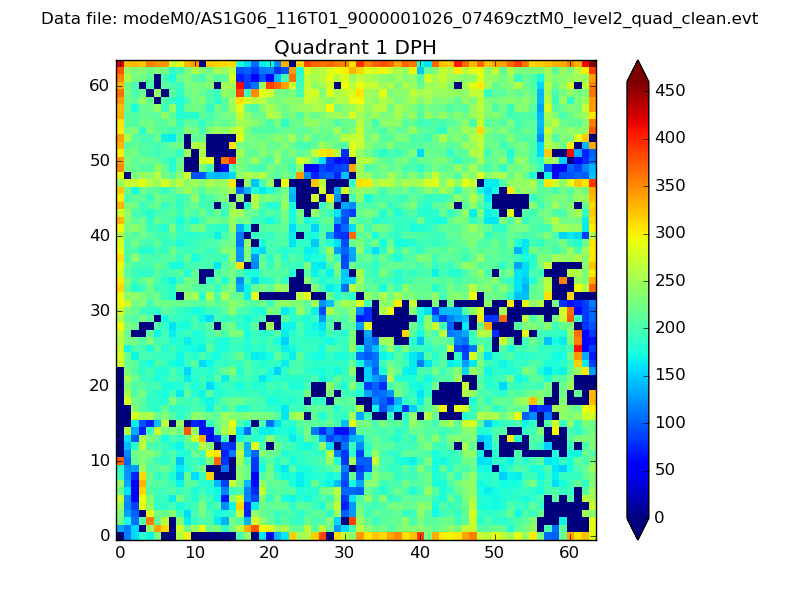 |
Quadrant B |
|---|---|---|---|
| Quadrant D | 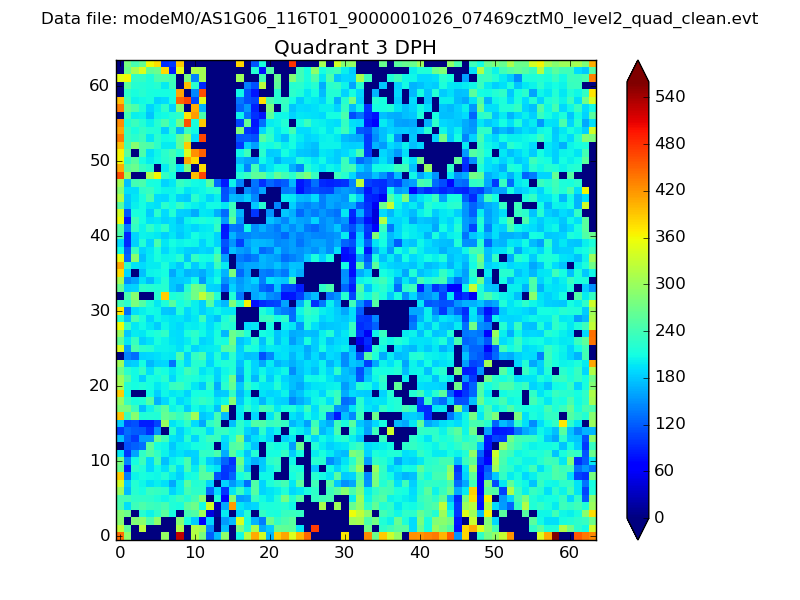 |
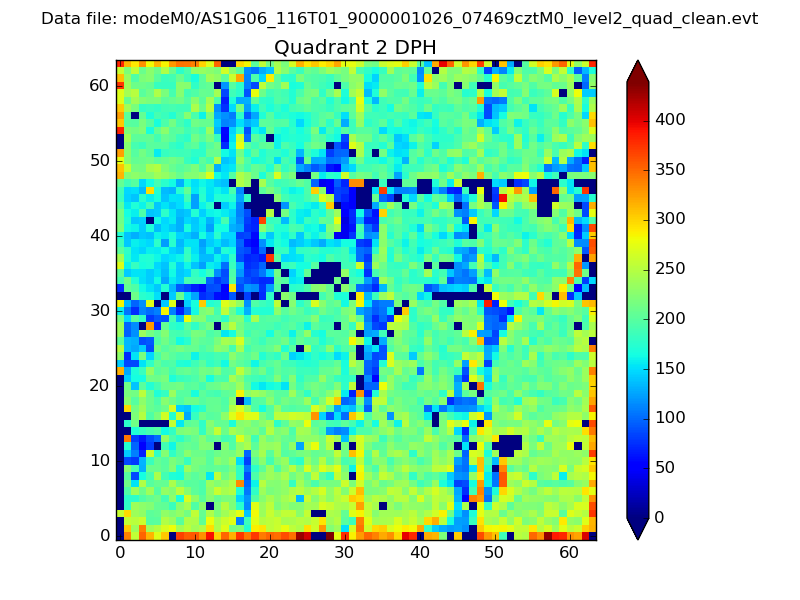 |
Quadrant C |
| Plot type | Count rate plots | Images |
|---|---|---|
| Comparison with Poisson distribution Blue bars denote a histogram of data divided into 1 sec bins. Red curve is a Poisson curve with rate = median count rate of data. |
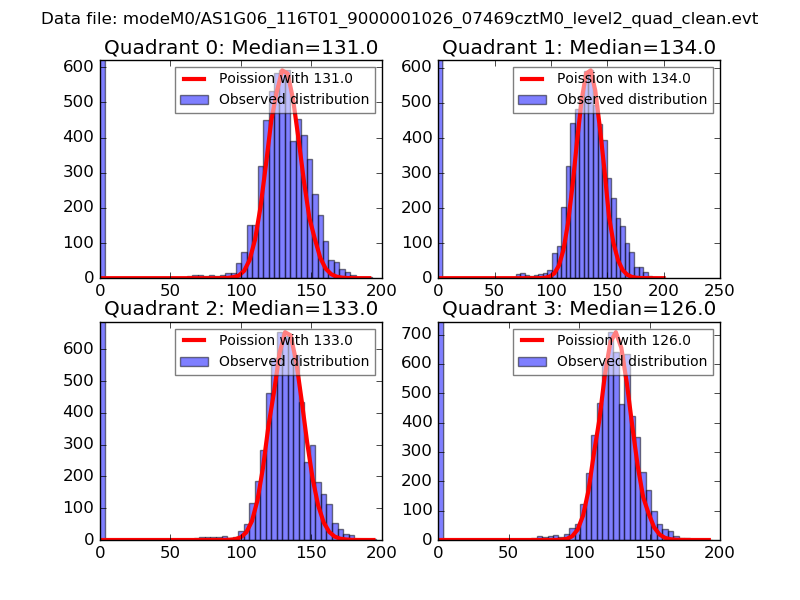 |
 |
| Quadrant-wise count rates Data is divided into 100 sec bins |
 |
|
| Module-wise count rates for Quadrant A Data is divided into 100 sec bins |
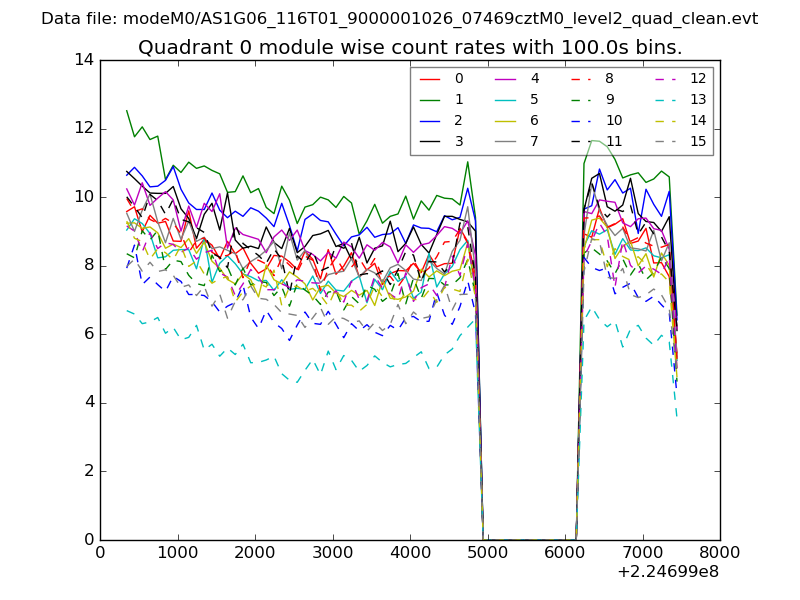 |
 |
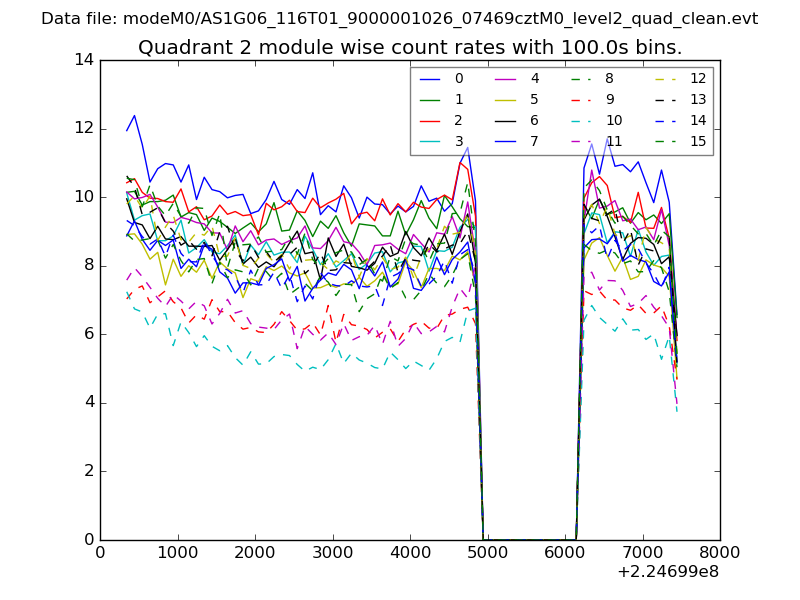
| Module-wise count rates for Quadrant B Data is divided into 100 sec bins |
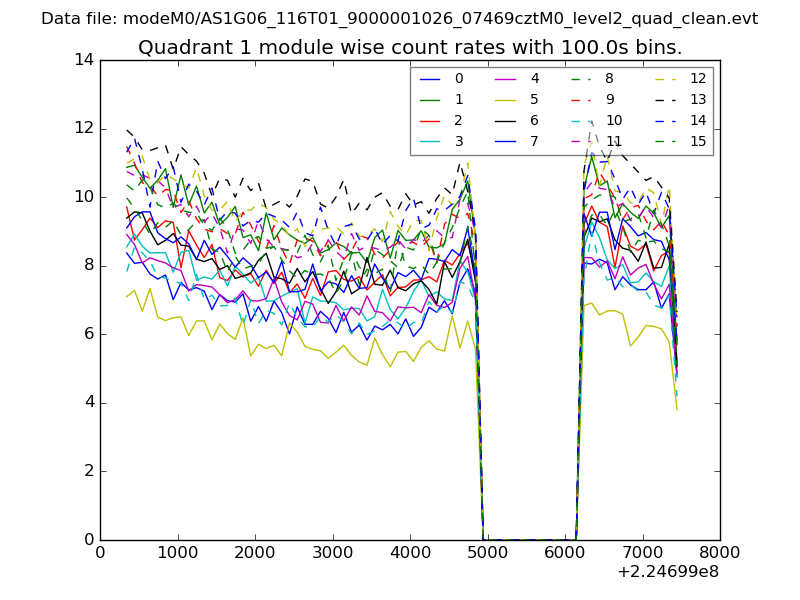 |
 |
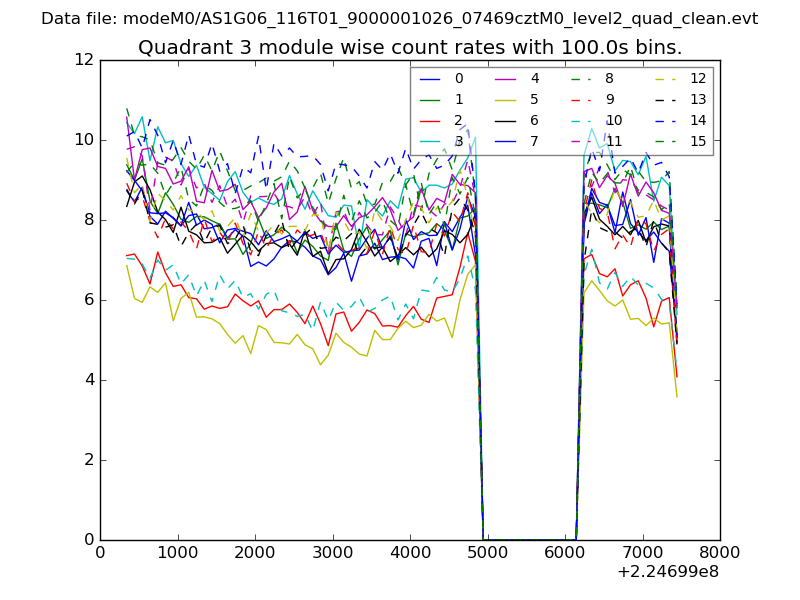
| Module-wise count rates for Quadrant C Data is divided into 100 sec bins |
 |
 |
| Module-wise count rates for Quadrant D Data is divided into 100 sec bins |
 |
 |
| Parameter | Plot |
|---|---|
| CZT HV Monitor | 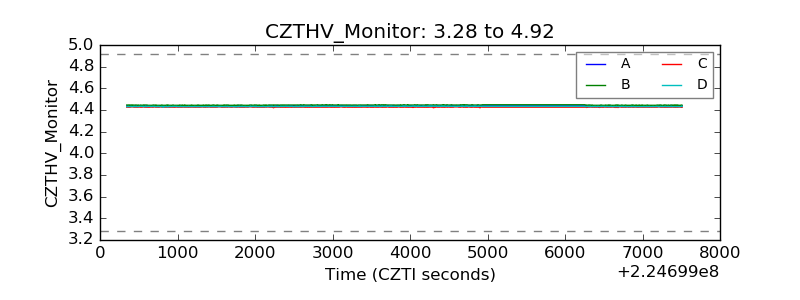 |
| D_VDD | 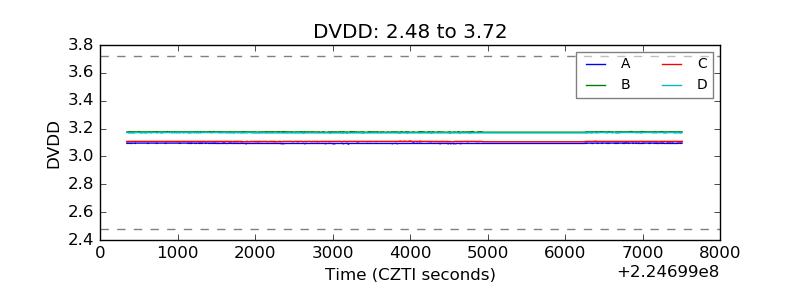 |
| Temperature 1 |  |
| Veto HV Monitor | 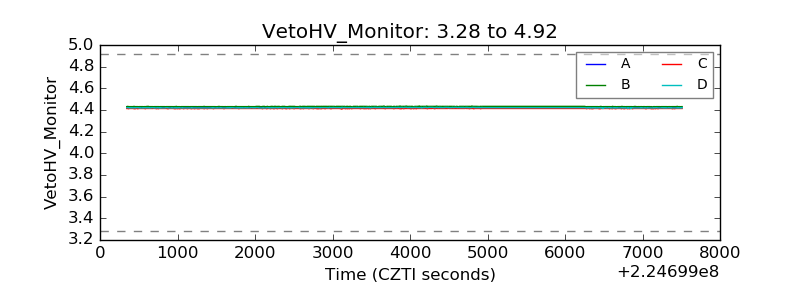 |
| Veto LLD | 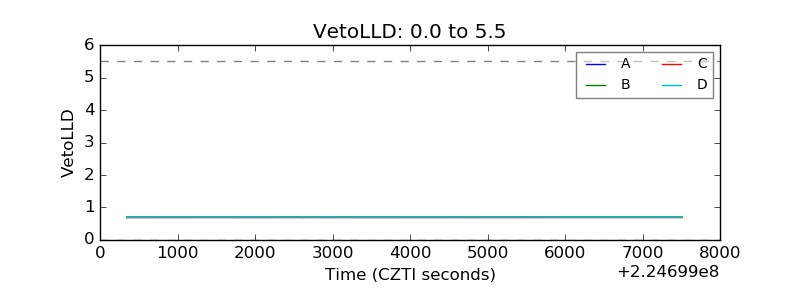 |
| Alpha Counter | 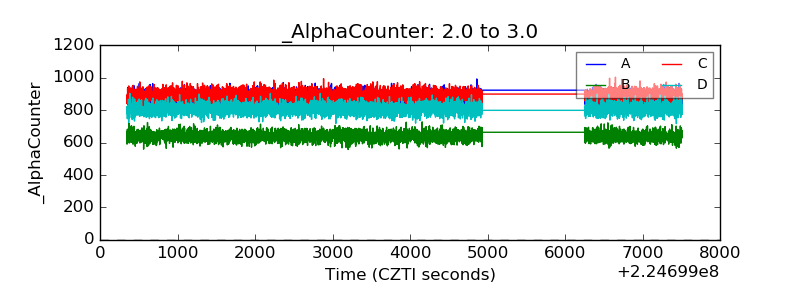 |
| _CPM_Rate | 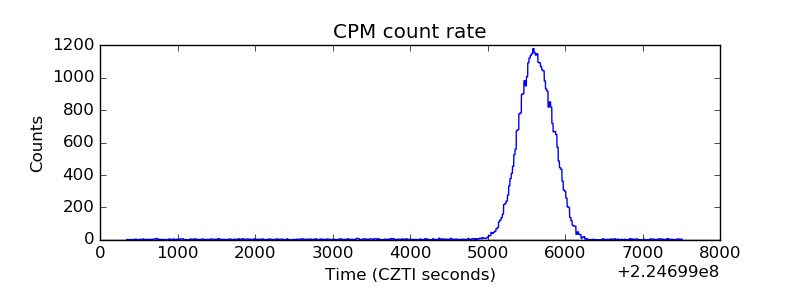 |
| CZT Counter | 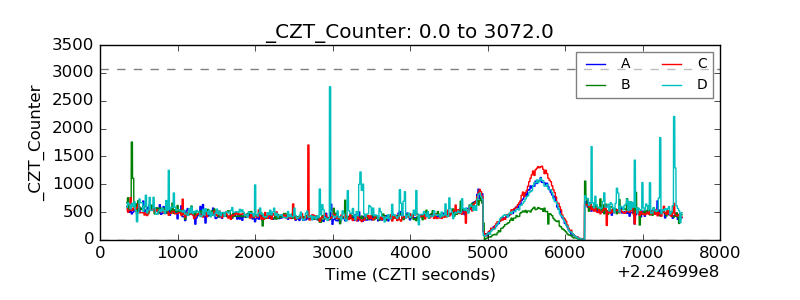 |
| +2.5 Volts monitor |  |
| +5 Volts monitor |  |
| _ROLL_ROT | 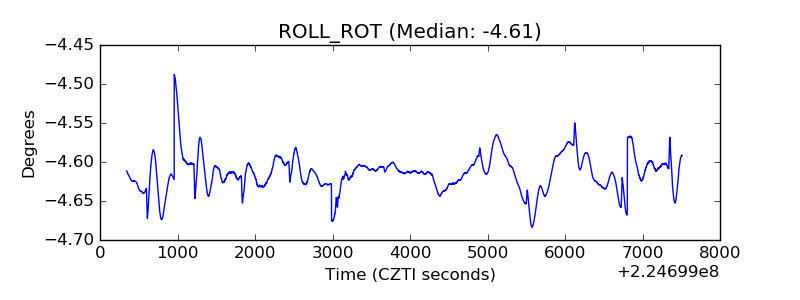 |
| _Roll_DEC | 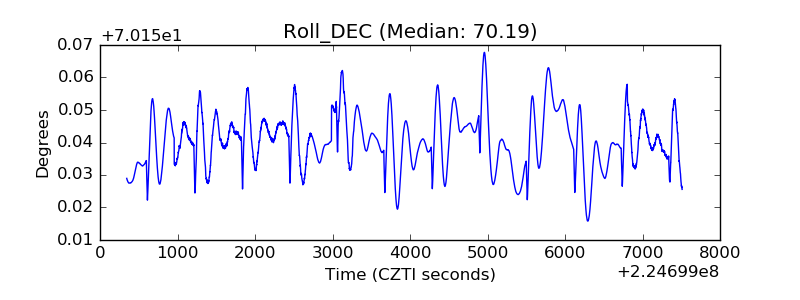 |
| _Roll_RA |  |
| Veto Counter | 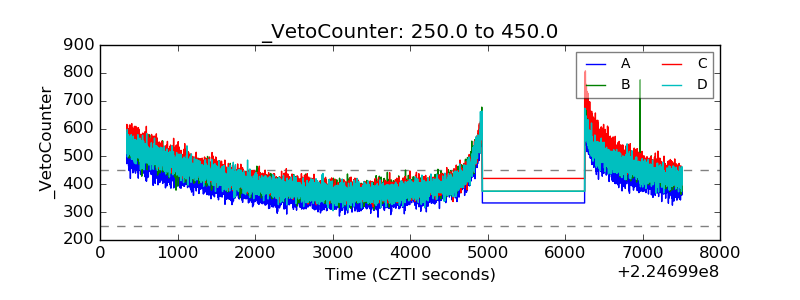 |