| Param | Original file | Final file |
|---|---|---|
| Filename | modeM0/AS1G06_116T01_9000001026_07470cztM0_level2.evt | modeM0/AS1G06_116T01_9000001026_07470cztM0_level2_quad_clean.evt |
| Size (bytes) | 436,043,520 | 121,250,880 |
| Size | 415.8 MB | 115.6 MB |
| Events in quadrant A | 2,908,272 | 807,771 |
| Events in quadrant B | 3,060,199 | 828,100 |
| Events in quadrant C | 2,915,622 | 819,946 |
| Events in quadrant D | 3,887,245 | 770,980 |
| Mode M0 | |||
|---|---|---|---|
| Quadrant | BADHDUFLAG | Total packets | Discarded packets |
| A | 0 | 13180 | 3 |
| B | 0 | 13470 | 2 |
| C | 0 | 13095 | 2 |
| D | 0 | 15781 | 2 |
| Mode SS | |||
|---|---|---|---|
| Quadrant | BADHDUFLAG | Total packets | Discarded packets |
| A | 0 | 130 | 0 |
| B | 0 | 130 | 0 |
| C | 0 | 130 | 0 |
| D | 0 | 130 | 0 |
| Mode M9 | |||
|---|---|---|---|
| Quadrant | BADHDUFLAG | Total packets | Discarded packets |
| A | 0 | 14 | 0 |
| B | 0 | 14 | 0 |
| C | 0 | 14 | 0 |
| D | 0 | 15 | 0 |
| Quadrant | Total seconds | Saturated seconds | Saturation percentage |
|---|---|---|---|
| A | 6385 | 55 | 0.861394% |
| B | 6385 | 92 | 1.440877% |
| C | 6385 | 44 | 0.689115% |
| D | 6385 | 157 | 2.458888% |
Noise dominated data is calculated using 1-second bins in cleaned event files. If a bin has >2000 counts, and if more than 50% of those come from <1% of pixels, then it is considered to be noise-dominated and hence unusable.
| Quadrant | # 1 sec bins | Bins with >0 counts | Bins with >2000 counts | High rate bins dominated by noise | Noise dominated (total time) | Noise dominated (detector-on time) | Marked lightcurve |
|---|---|---|---|---|---|---|---|
| A | 7520 | 6386 | 3 | 3 | 0.04% | 0.05% | 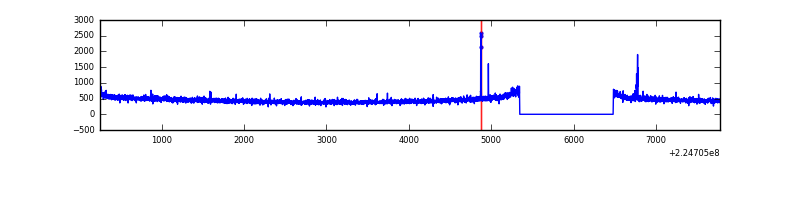 |
| B | 7520 | 6386 | 22 | 22 | 0.29% | 0.34% | 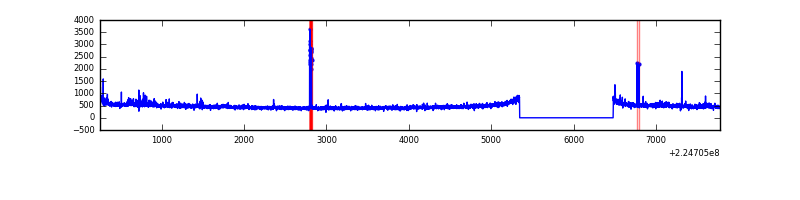 |
| C | 7520 | 6386 | 0 | 0 | 0.00% | 0.00% | 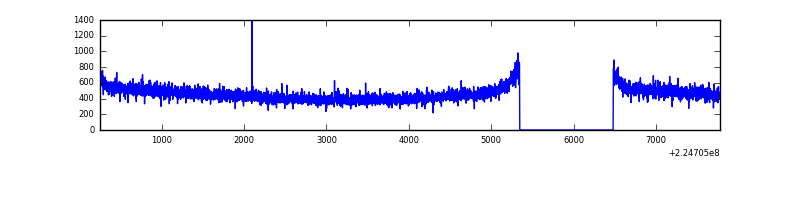 |
| D | 7520 | 6385 | 86 | 86 | 1.14% | 1.35% | 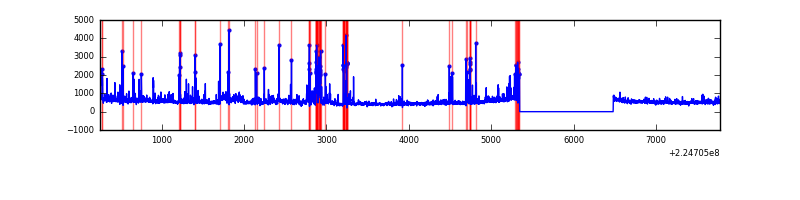 |
Top three noisy pixels from each quadrant. If the there are fewer than three noisy pixels in the level2.evt file, extra rows are filled as -1
| Pixel properties | Quadrant properties | ||||||
|---|---|---|---|---|---|---|---|
| Quadrant | DetID | PixID | Counts | Sigma | Mean | Median | Sigma |
| A | 15 | 234 | 15188 | 95.72 | 747 | 730 | 151.0 |
| A | 13 | 248 | 11589 | 71.89 | 747 | 730 | 151.0 |
| A | 3 | 1 | 7625 | 45.65 | 747 | 730 | 151.0 |
| B | 0 | 85 | 51785 | 357.37 | 757 | 737 | 142.8 |
| B | 0 | 214 | 41734 | 287.0 | 757 | 737 | 142.8 |
| B | 4 | 170 | 18708 | 125.81 | 757 | 737 | 142.8 |
| C | 9 | 68 | 11986 | 65.9 | 741 | 743 | 170.6 |
| C | 13 | 61 | 5728 | 29.22 | 741 | 743 | 170.6 |
| C | 1 | 16 | 4968 | 24.76 | 741 | 743 | 170.6 |
| D | 13 | 105 | 308693 | 1743.73 | 729 | 705 | 176.6 |
| D | 12 | 221 | 217146 | 1225.42 | 729 | 705 | 176.6 |
| D | 12 | 233 | 145098 | 817.5 | 729 | 705 | 176.6 |
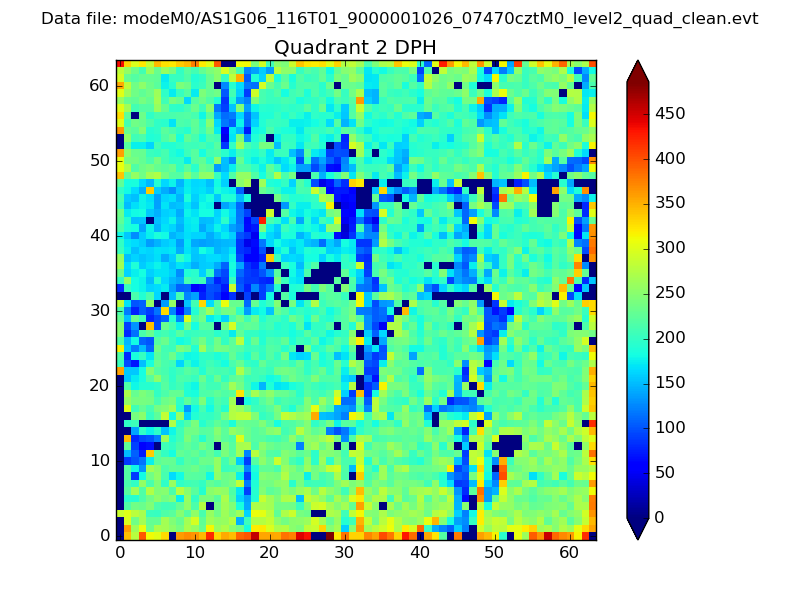
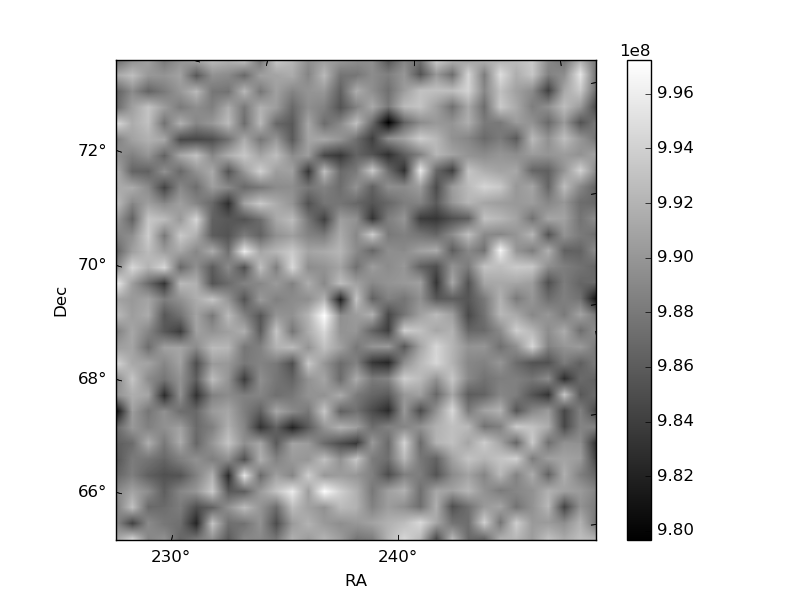
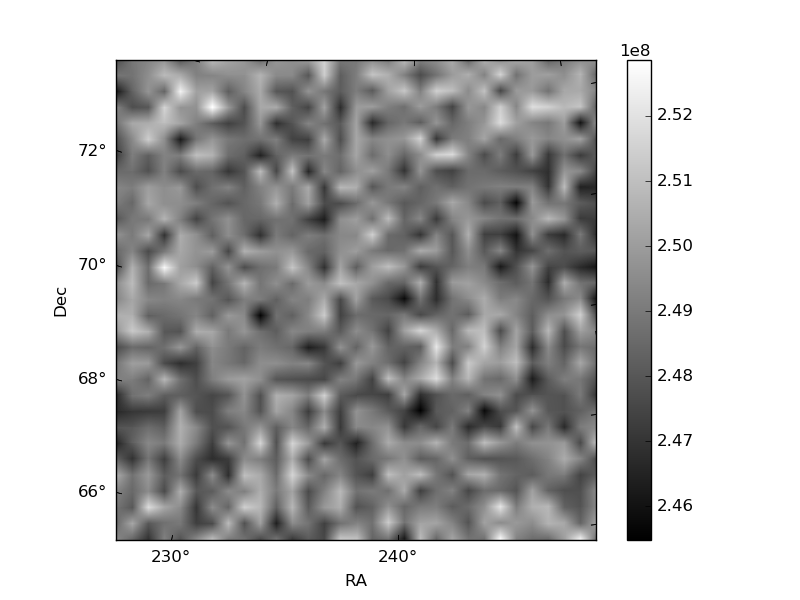
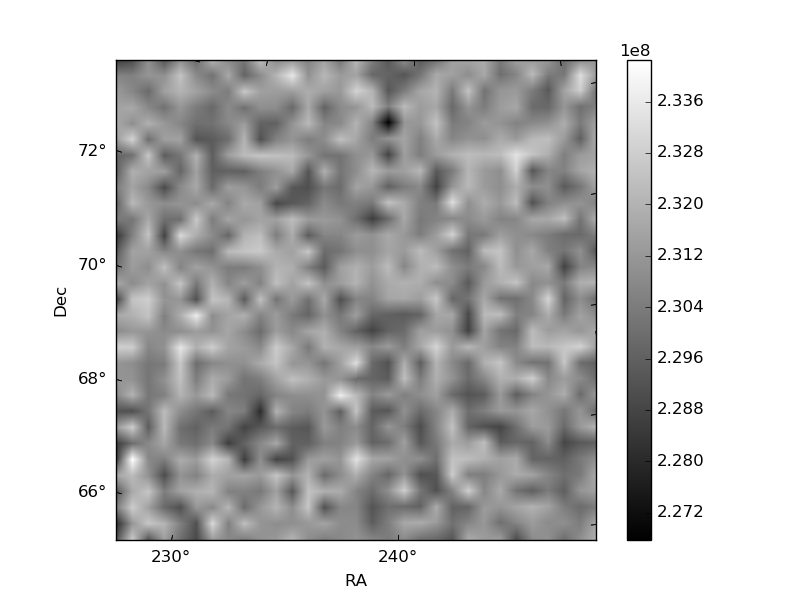
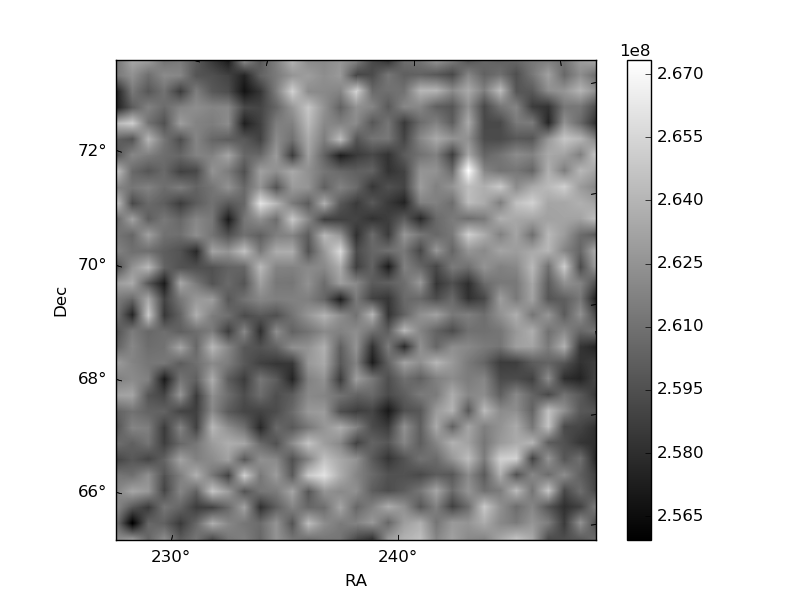
Histogram calculated using DETX and DETY for each event in the final _common_clean file
| Quadrant A | 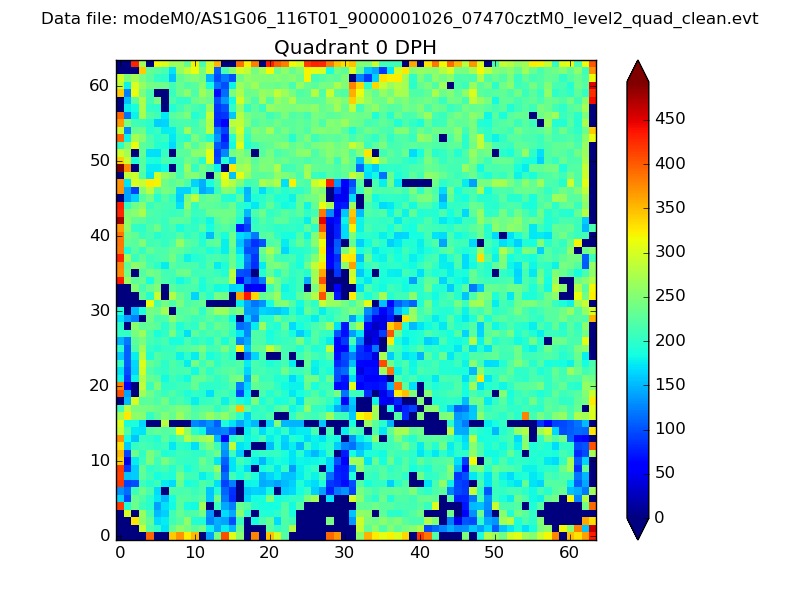 |
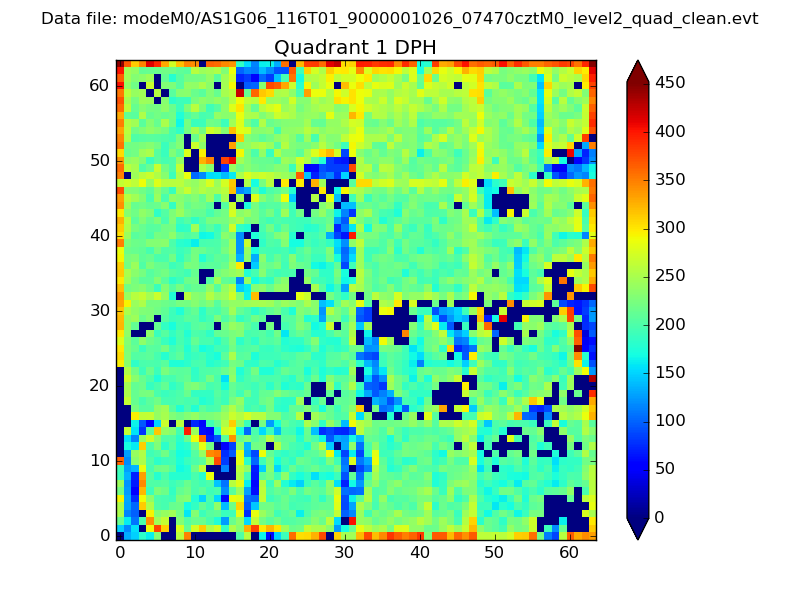 |
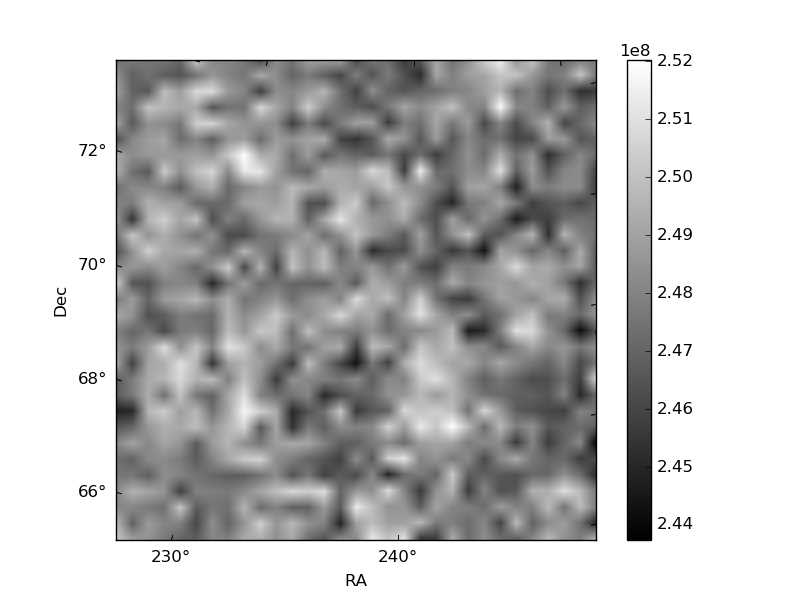
Quadrant B |
|---|---|---|---|
| Quadrant D | 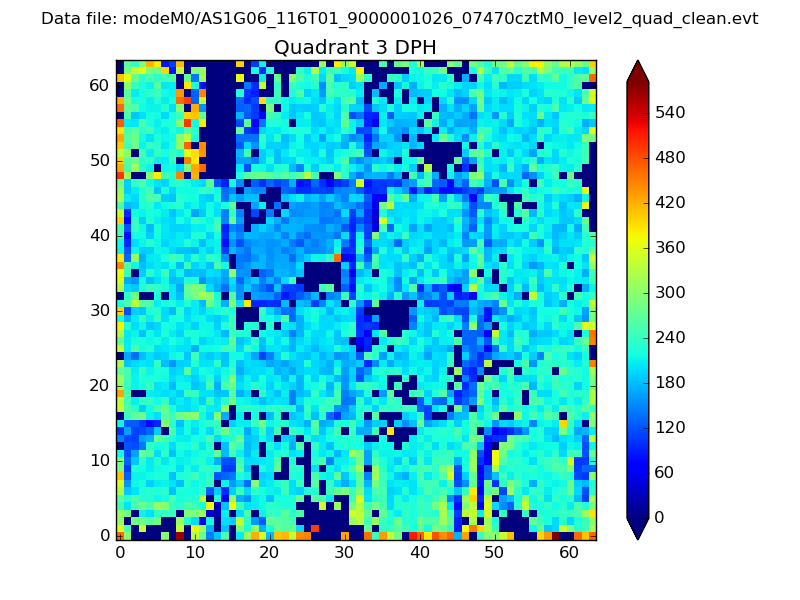 |
 |
Quadrant C |
| Plot type | Count rate plots | Images |
|---|---|---|
| Comparison with Poisson distribution Blue bars denote a histogram of data divided into 1 sec bins. Red curve is a Poisson curve with rate = median count rate of data. |
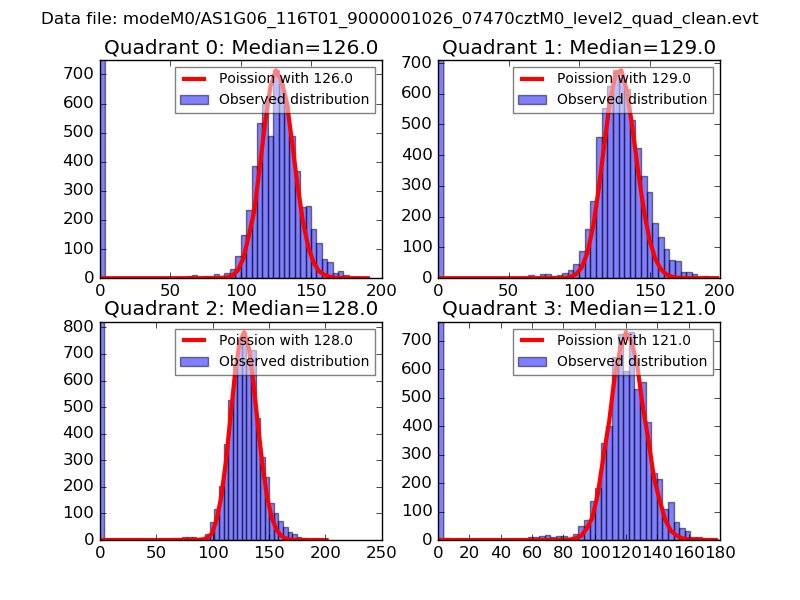 |
 |
| Quadrant-wise count rates Data is divided into 100 sec bins |
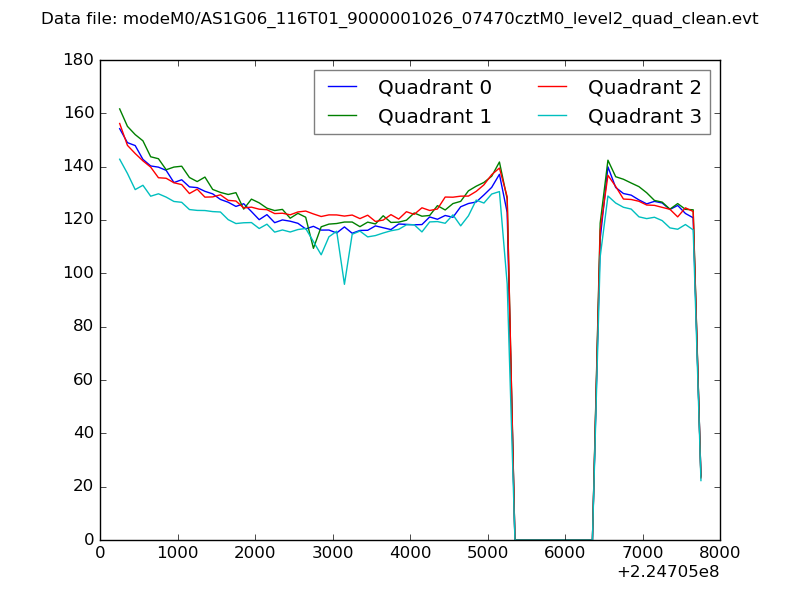 |
|
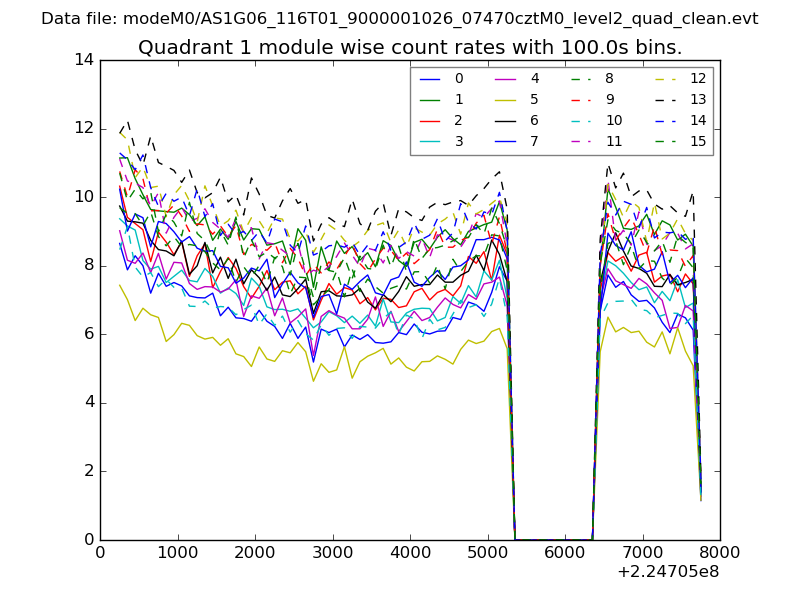
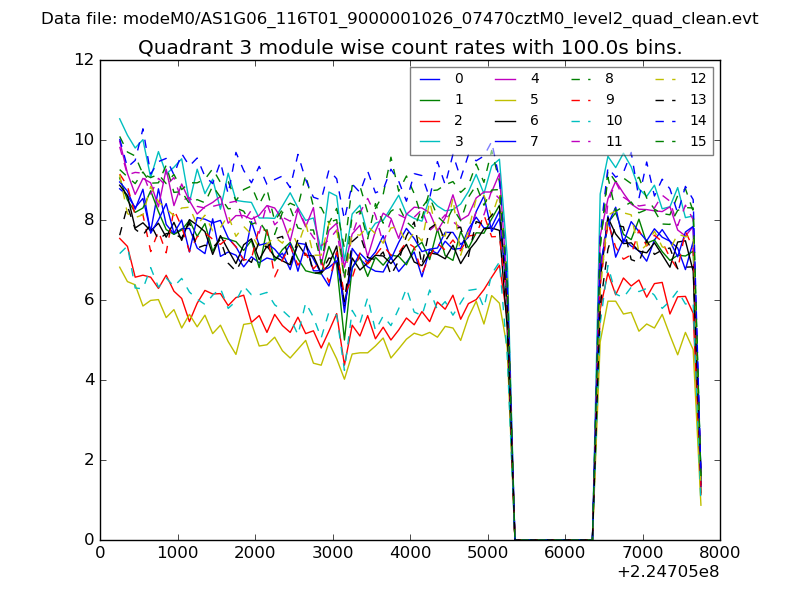
| Module-wise count rates for Quadrant A Data is divided into 100 sec bins |
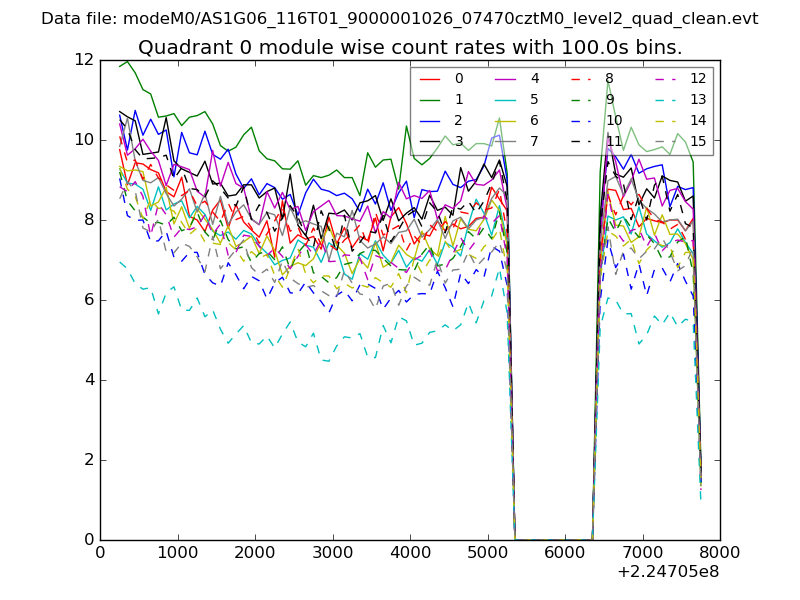 |
 |
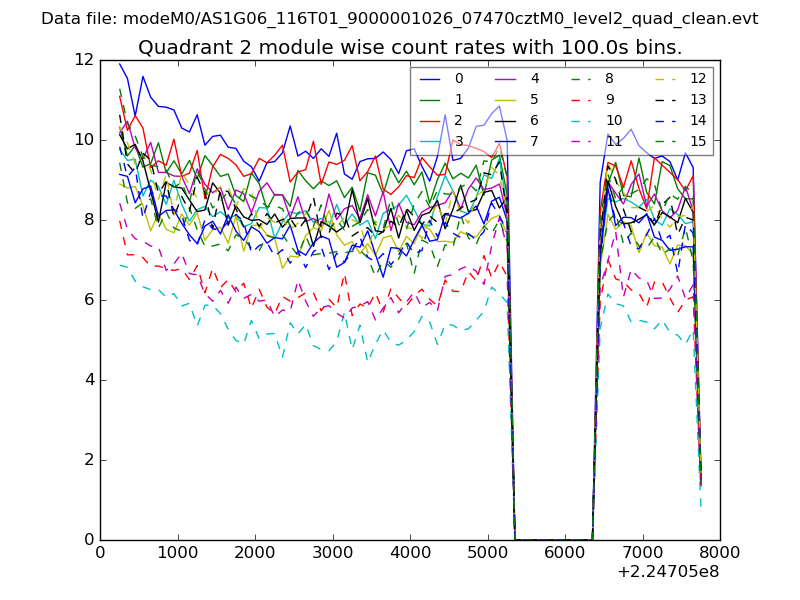
| Module-wise count rates for Quadrant B Data is divided into 100 sec bins |
 |
 |
| Module-wise count rates for Quadrant C Data is divided into 100 sec bins |
 |
 |
| Module-wise count rates for Quadrant D Data is divided into 100 sec bins |
 |
 |
| Parameter | Plot |
|---|---|
| CZT HV Monitor | 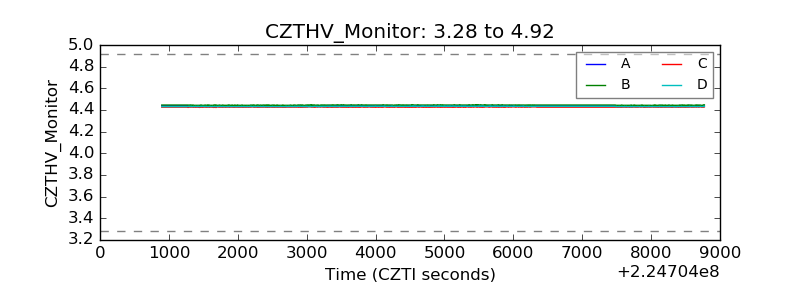 |
| D_VDD | 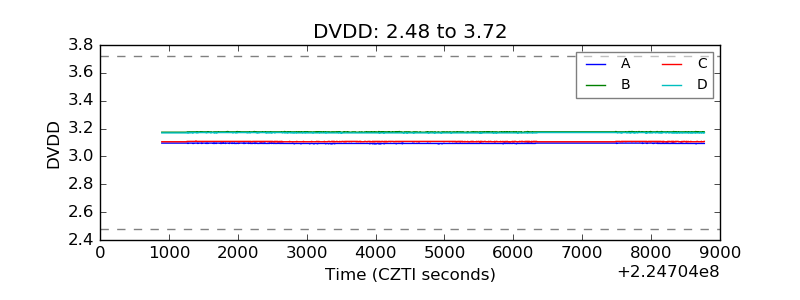 |
| Temperature 1 | 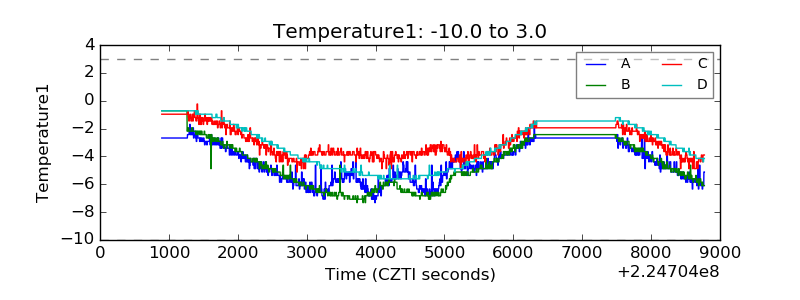 |
| Veto HV Monitor | 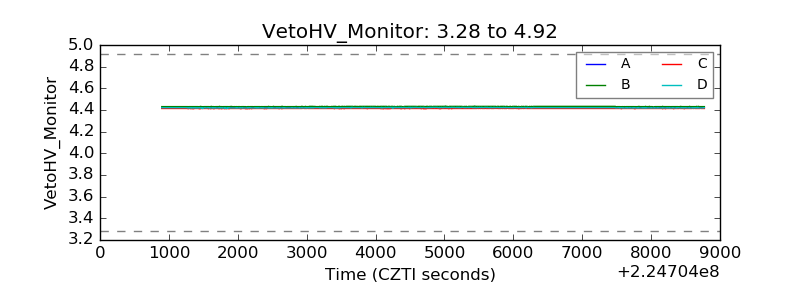 |
| Veto LLD | 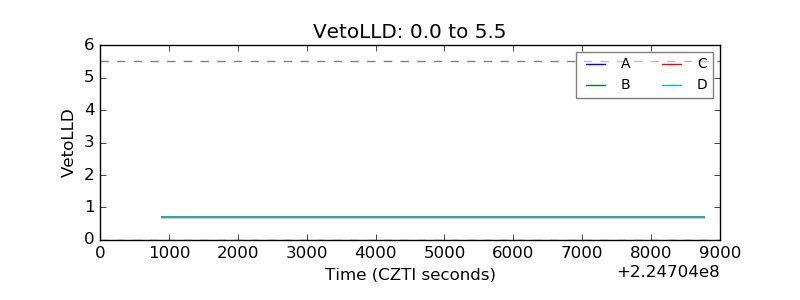 |
| Alpha Counter | 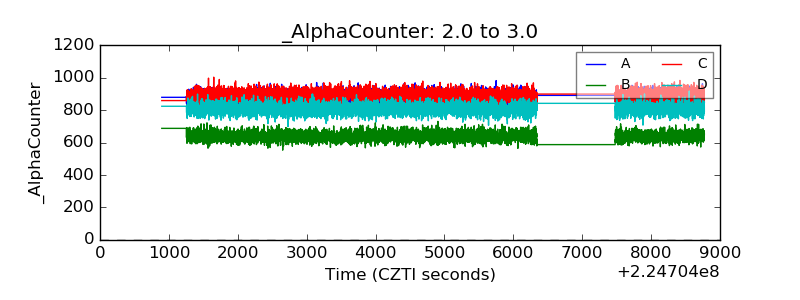 |
| _CPM_Rate | 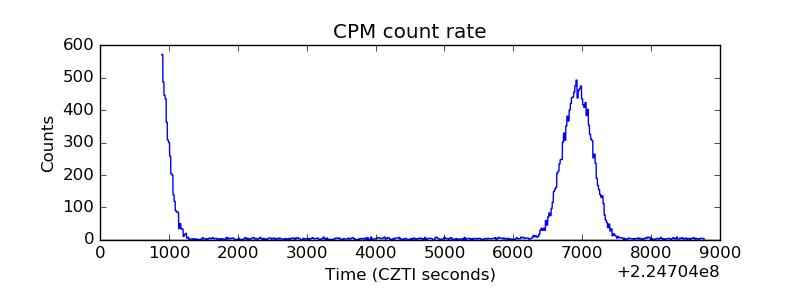 |
| CZT Counter | 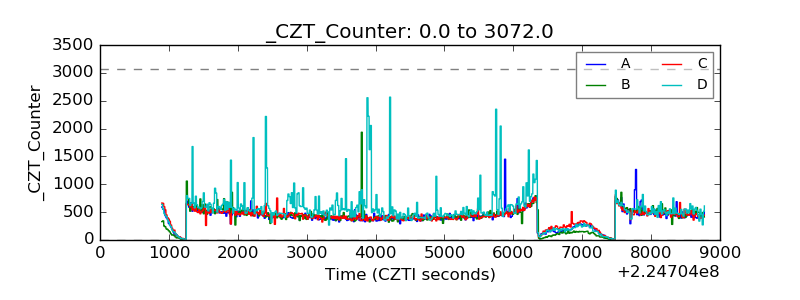 |
| +2.5 Volts monitor |  |
| +5 Volts monitor | 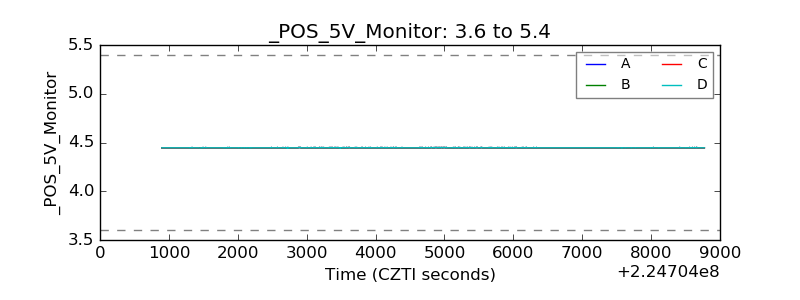 |
| _ROLL_ROT | 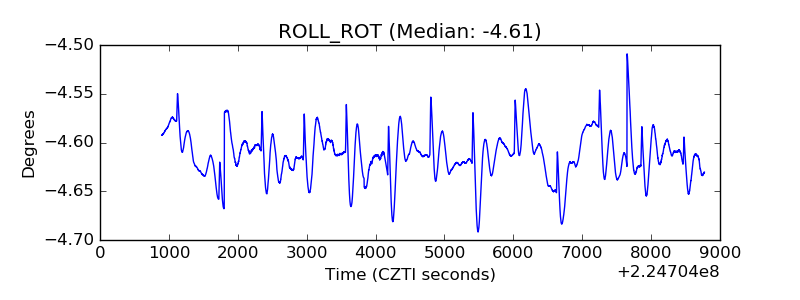 |
| _Roll_DEC | 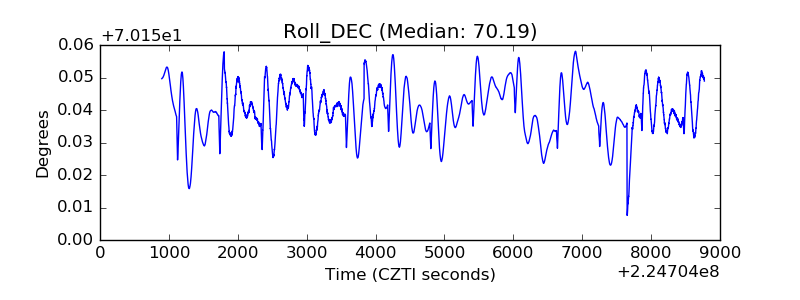 |
| _Roll_RA | 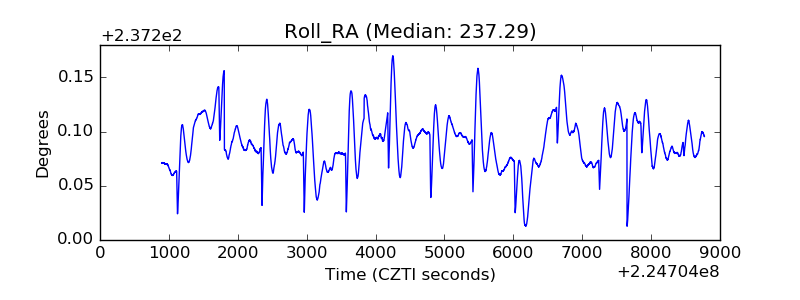 |
| Veto Counter | 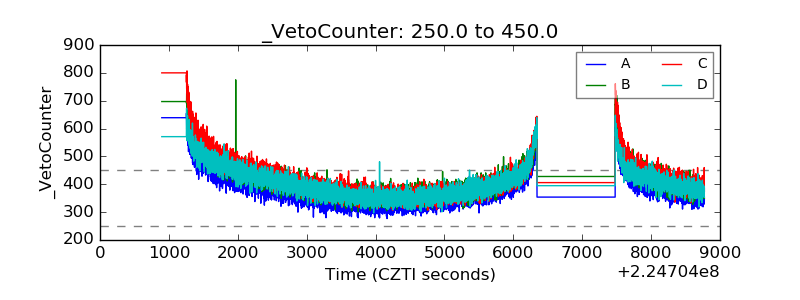 |