| Param | Original file | Final file |
|---|---|---|
| Filename | modeM0/AS1G06_116T01_9000001026_07473cztM0_level2.evt | modeM0/AS1G06_116T01_9000001026_07473cztM0_level2_quad_clean.evt |
| Size (bytes) | 542,822,400 | 149,797,440 |
| Size | 517.7 MB | 142.9 MB |
| Events in quadrant A | 3,747,455 | 988,387 |
| Events in quadrant B | 4,025,069 | 1,010,926 |
| Events in quadrant C | 3,748,860 | 1,000,608 |
| Events in quadrant D | 4,347,485 | 953,631 |
| Mode M0 | |||
|---|---|---|---|
| Quadrant | BADHDUFLAG | Total packets | Discarded packets |
| A | 0 | 17321 | 3 |
| B | 0 | 17915 | 2 |
| C | 0 | 17329 | 2 |
| D | 0 | 18698 | 2 |
| Mode SS | |||
|---|---|---|---|
| Quadrant | BADHDUFLAG | Total packets | Discarded packets |
| A | 0 | 170 | 0 |
| B | 0 | 170 | 0 |
| C | 0 | 170 | 0 |
| D | 0 | 170 | 0 |
| Mode M9 | |||
|---|---|---|---|
| Quadrant | BADHDUFLAG | Total packets | Discarded packets |
| A | 0 | 8 | 0 |
| B | 0 | 8 | 0 |
| C | 0 | 8 | 0 |
| D | 0 | 8 | 0 |
| Quadrant | Total seconds | Saturated seconds | Saturation percentage |
|---|---|---|---|
| A | 8411 | 30 | 0.356676% |
| B | 8411 | 87 | 1.034360% |
| C | 8411 | 31 | 0.368565% |
| D | 8411 | 63 | 0.749019% |
Noise dominated data is calculated using 1-second bins in cleaned event files. If a bin has >2000 counts, and if more than 50% of those come from <1% of pixels, then it is considered to be noise-dominated and hence unusable.
| Quadrant | # 1 sec bins | Bins with >0 counts | Bins with >2000 counts | High rate bins dominated by noise | Noise dominated (total time) | Noise dominated (detector-on time) | Marked lightcurve |
|---|---|---|---|---|---|---|---|
| A | 9181 | 8413 | 0 | 0 | 0.00% | 0.00% | 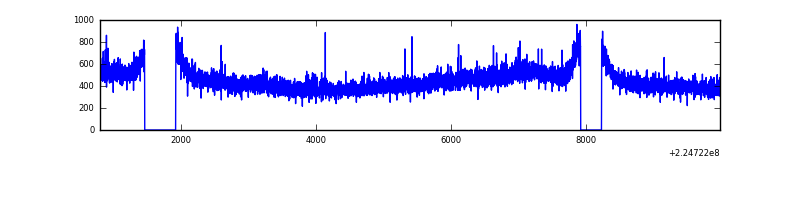 |
| B | 9181 | 8413 | 18 | 18 | 0.20% | 0.21% | 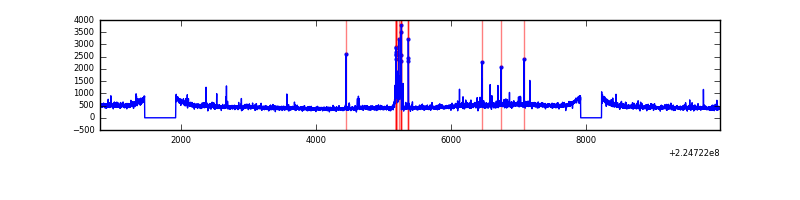 |
| C | 9181 | 8413 | 0 | 0 | 0.00% | 0.00% | 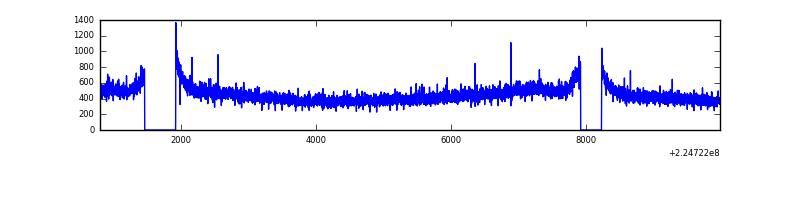 |
| D | 9181 | 8413 | 45 | 45 | 0.49% | 0.53% | 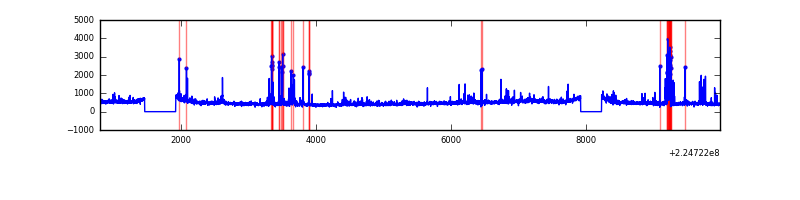 |
Top three noisy pixels from each quadrant. If the there are fewer than three noisy pixels in the level2.evt file, extra rows are filled as -1
| Pixel properties | Quadrant properties | ||||||
|---|---|---|---|---|---|---|---|
| Quadrant | DetID | PixID | Counts | Sigma | Mean | Median | Sigma |
| A | 15 | 234 | 19997 | 97.06 | 962 | 940 | 196.3 |
| A | 3 | 1 | 14539 | 69.26 | 962 | 940 | 196.3 |
| A | 0 | 226 | 8949 | 40.79 | 962 | 940 | 196.3 |
| B | 4 | 81 | 124662 | 664.6 | 976 | 950 | 186.1 |
| B | 0 | 214 | 87900 | 467.11 | 976 | 950 | 186.1 |
| B | 4 | 173 | 22816 | 117.47 | 976 | 950 | 186.1 |
| C | 9 | 68 | 33517 | 147.13 | 948 | 950 | 221.4 |
| C | 1 | 16 | 10243 | 41.98 | 948 | 950 | 221.4 |
| C | 13 | 61 | 7392 | 29.1 | 948 | 950 | 221.4 |
| D | 12 | 221 | 270502 | 1168.44 | 938 | 906 | 230.7 |
| D | 2 | 14 | 235721 | 1017.7 | 938 | 906 | 230.7 |
| D | 2 | 136 | 81135 | 347.72 | 938 | 906 | 230.7 |
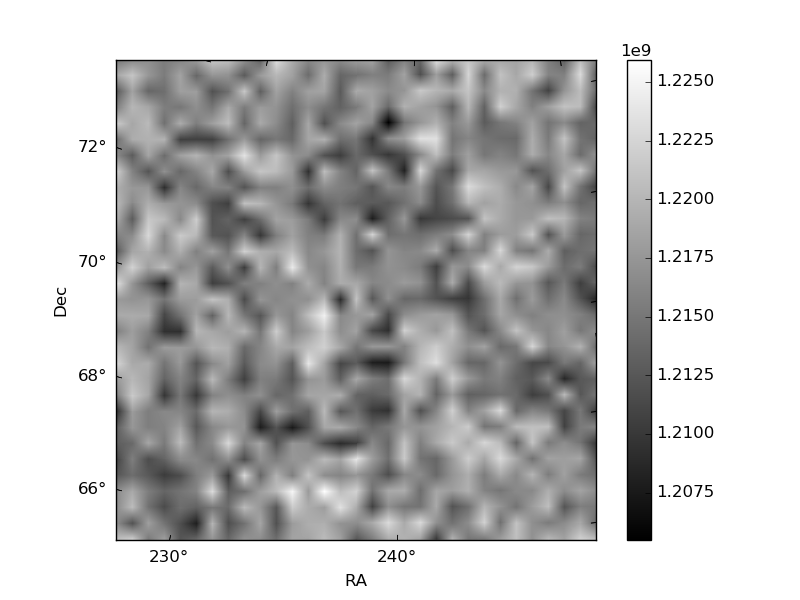
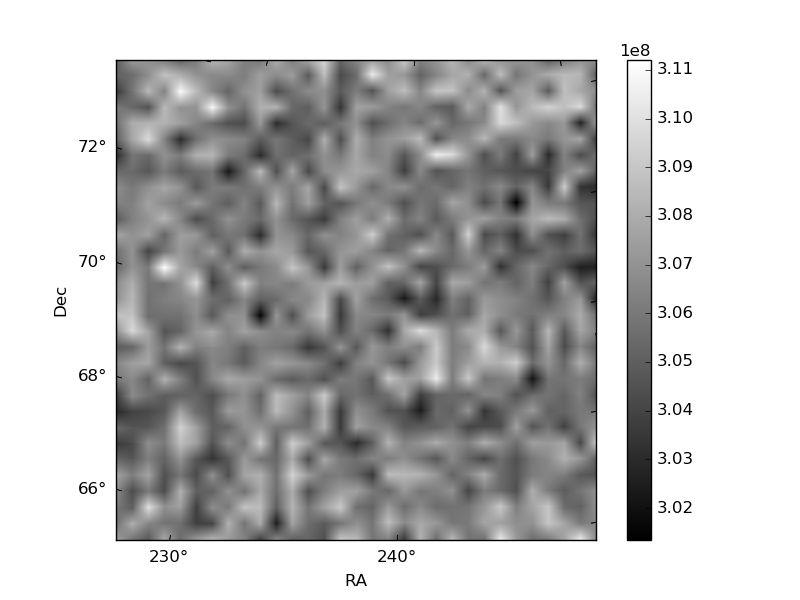
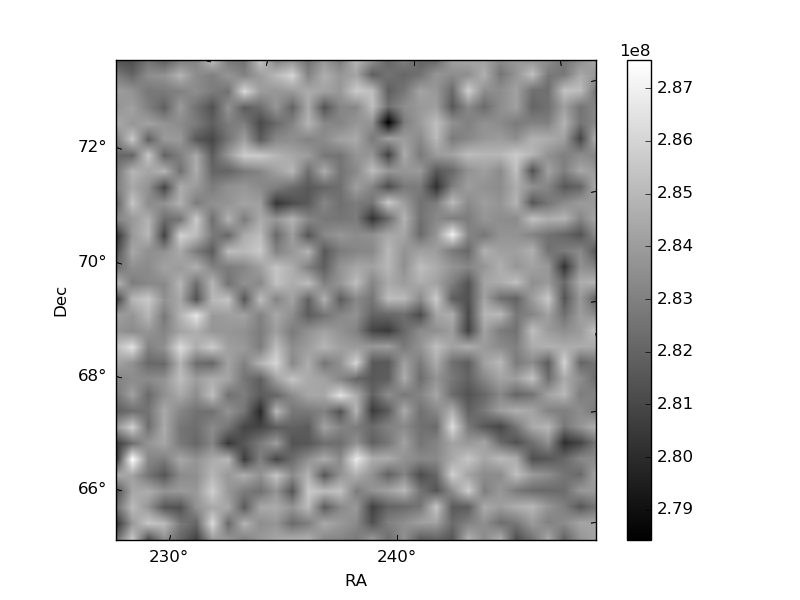
Histogram calculated using DETX and DETY for each event in the final _common_clean file
| Quadrant A | 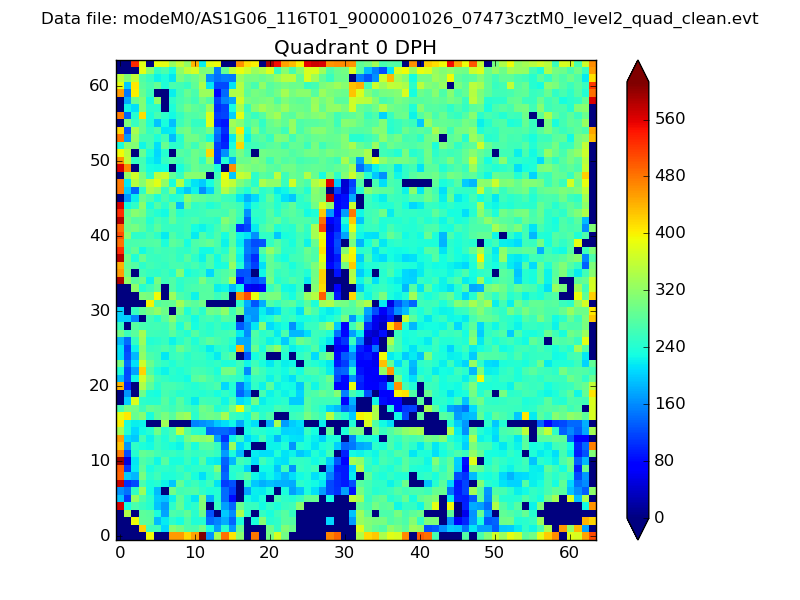 |
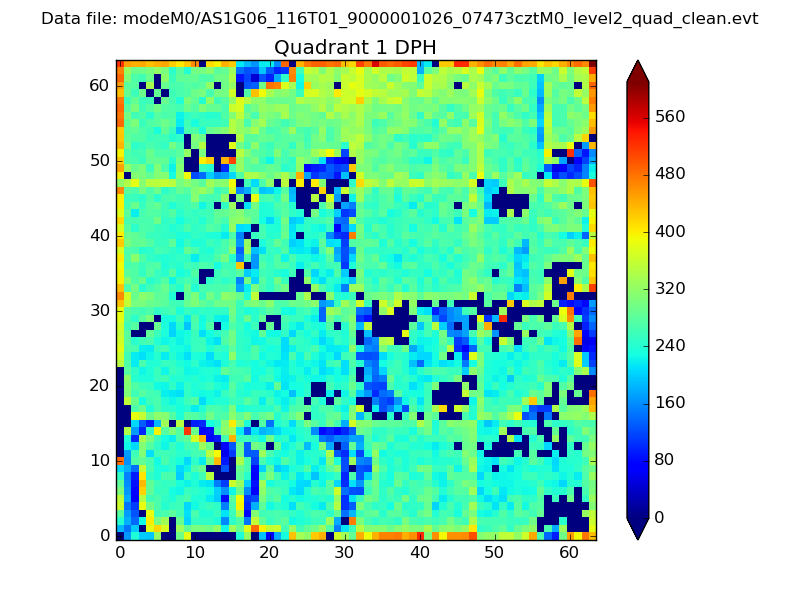 |
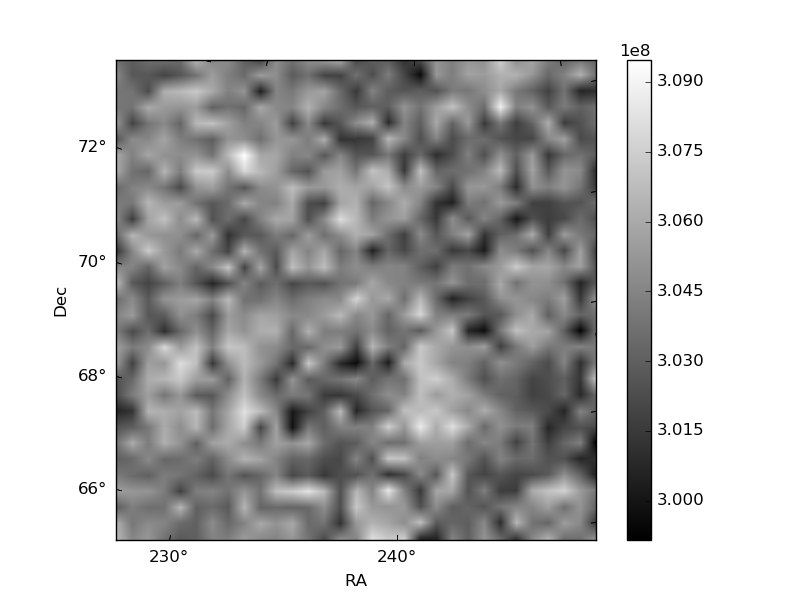
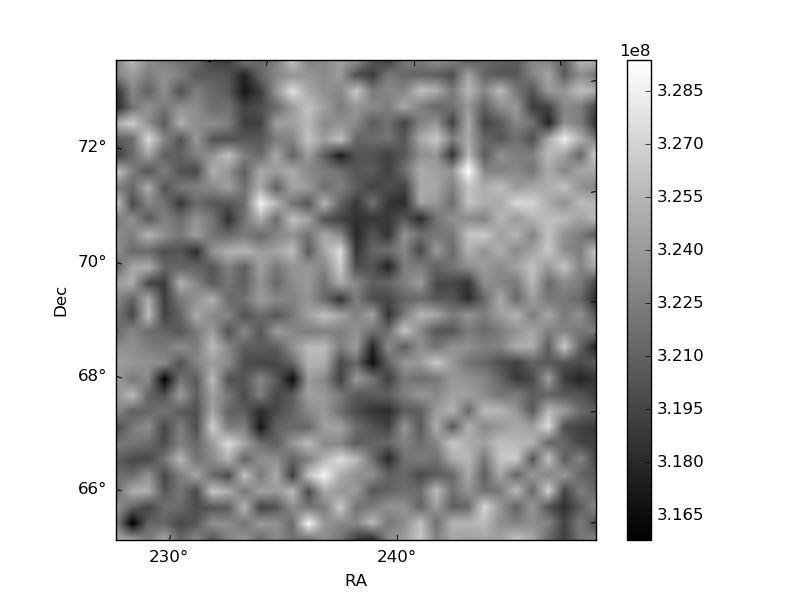
Quadrant B |
|---|---|---|---|
| Quadrant D | 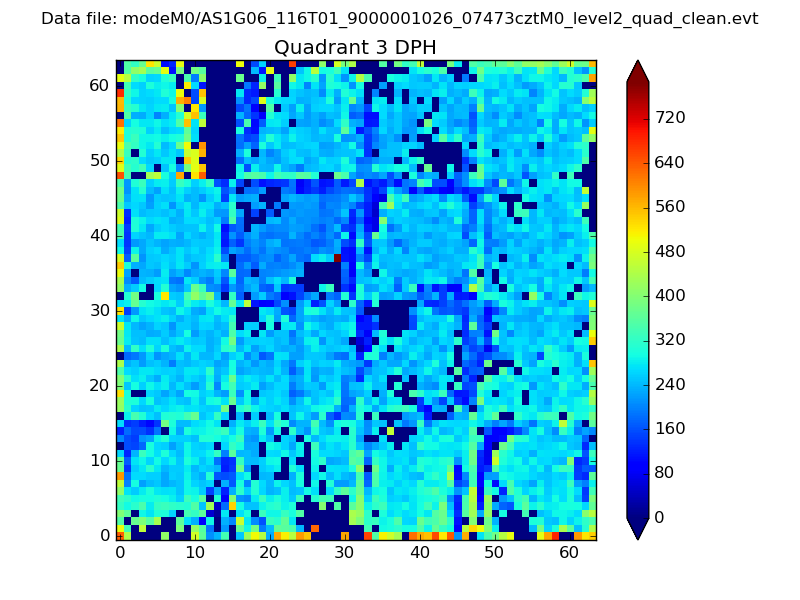 |
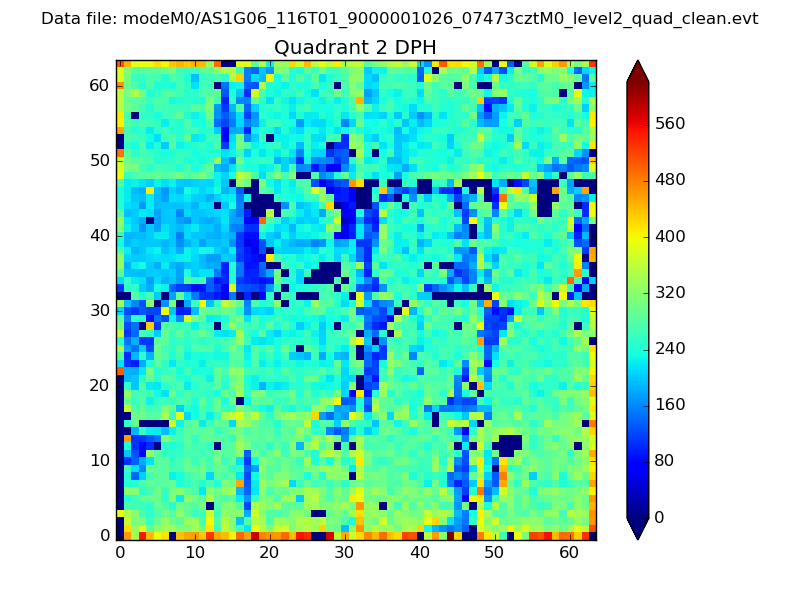 |
Quadrant C |
| Plot type | Count rate plots | Images |
|---|---|---|
| Comparison with Poisson distribution Blue bars denote a histogram of data divided into 1 sec bins. Red curve is a Poisson curve with rate = median count rate of data. |
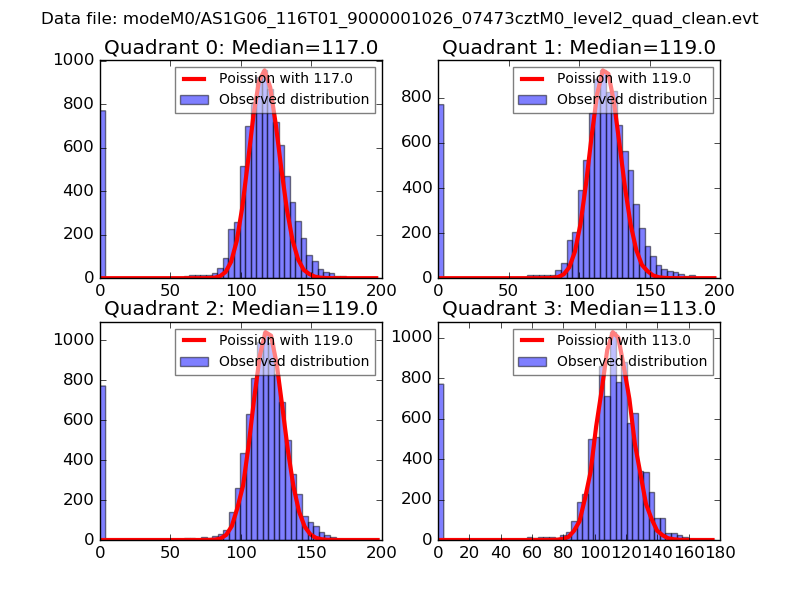 |
 |
| Quadrant-wise count rates Data is divided into 100 sec bins |
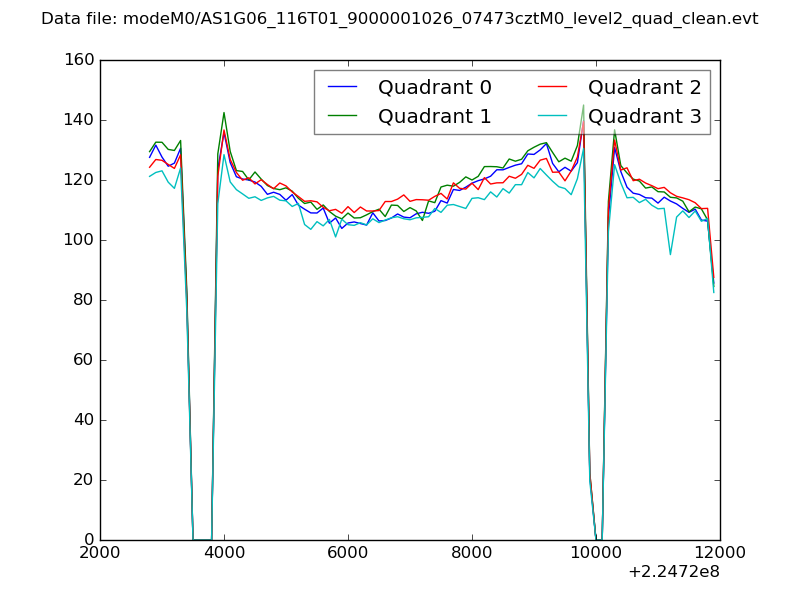 |
|
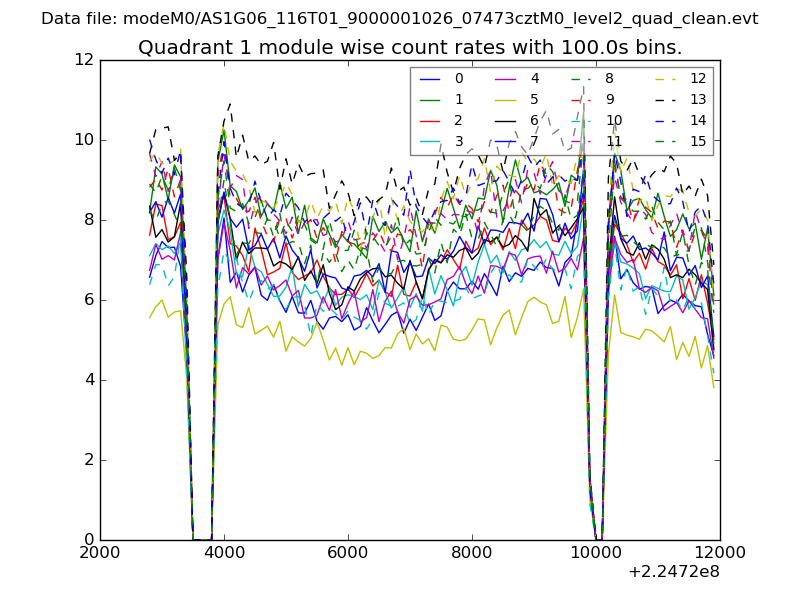
| Module-wise count rates for Quadrant A Data is divided into 100 sec bins |
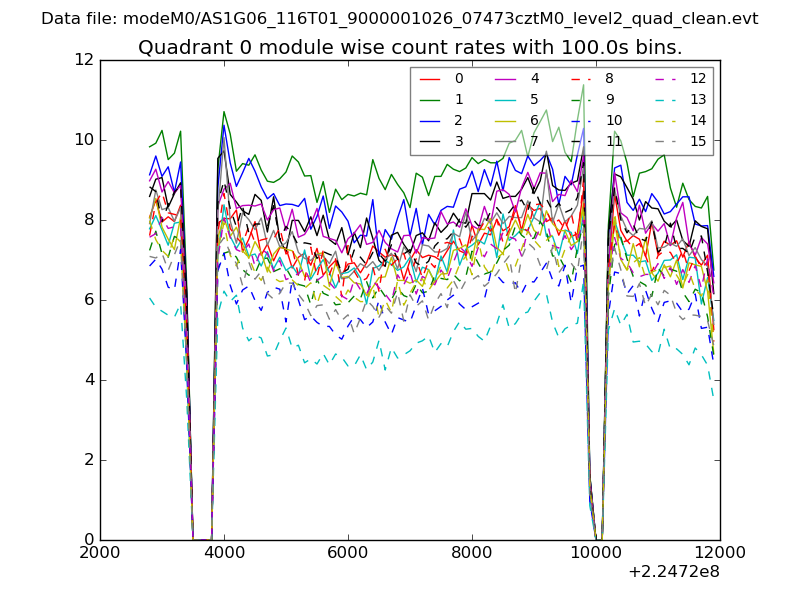 |
 |
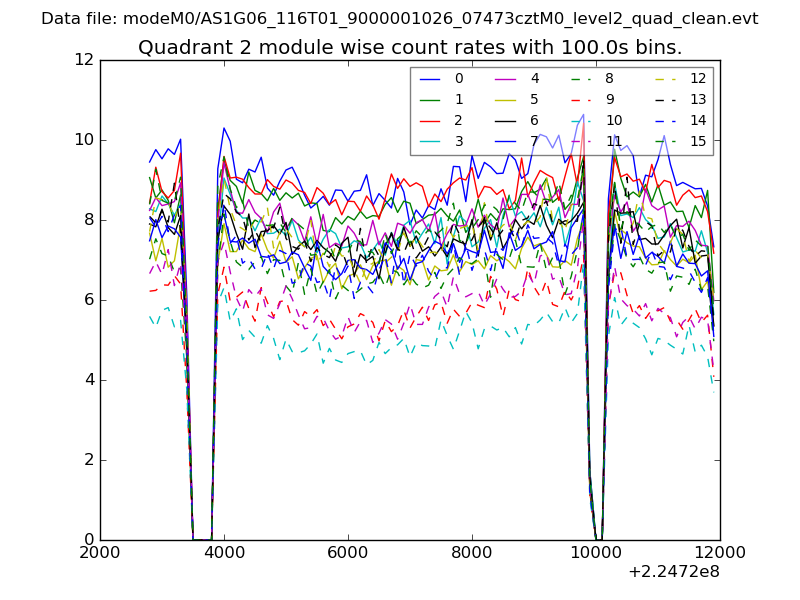
| Module-wise count rates for Quadrant B Data is divided into 100 sec bins |
 |
 |
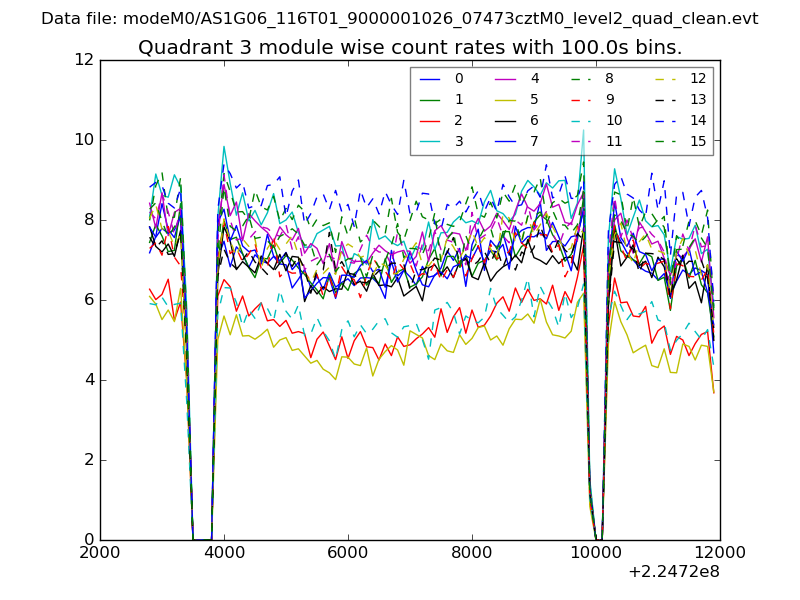
| Module-wise count rates for Quadrant C Data is divided into 100 sec bins |
 |
 |
| Module-wise count rates for Quadrant D Data is divided into 100 sec bins |
 |
 |
| Parameter | Plot |
|---|---|
| CZT HV Monitor | 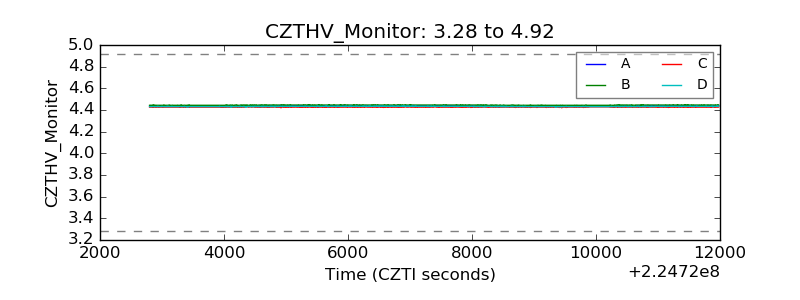 |
| D_VDD | 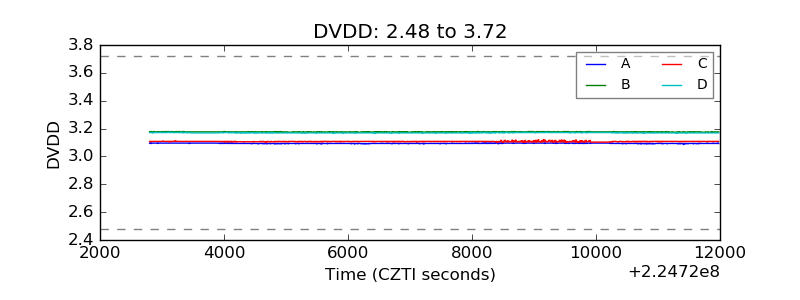 |
| Temperature 1 | 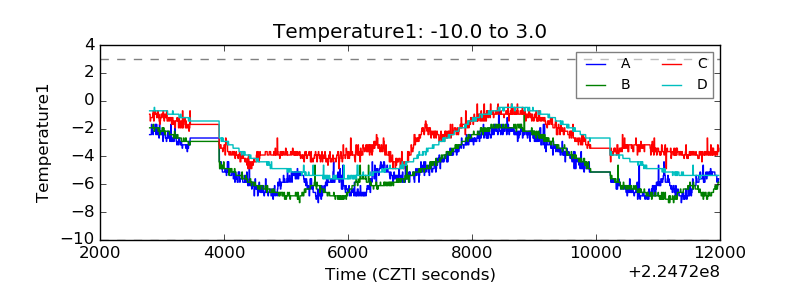 |
| Veto HV Monitor | 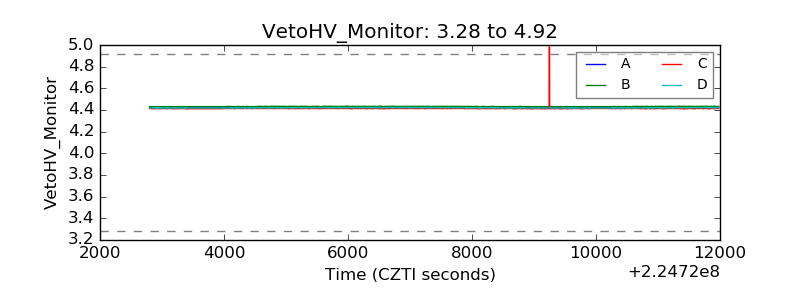 |
| Veto LLD | 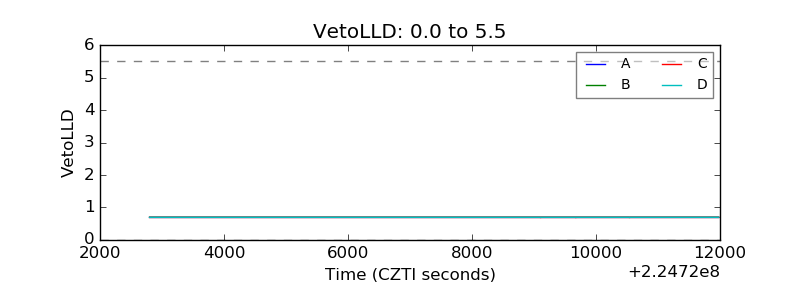 |
| Alpha Counter | 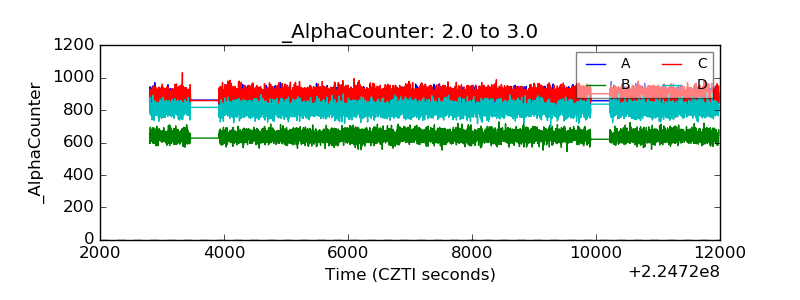 |
| _CPM_Rate | 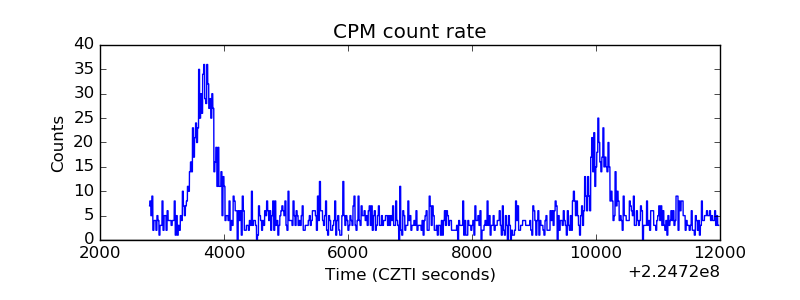 |
| CZT Counter | 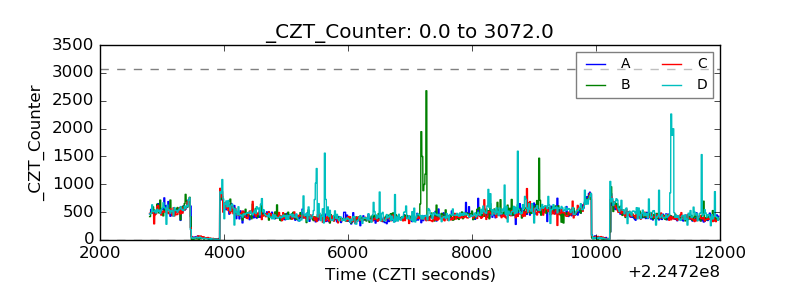 |
| +2.5 Volts monitor |  |
| +5 Volts monitor |  |
| _ROLL_ROT | 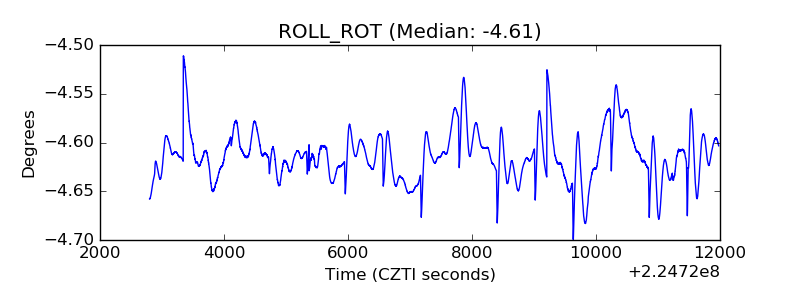 |
| _Roll_DEC | 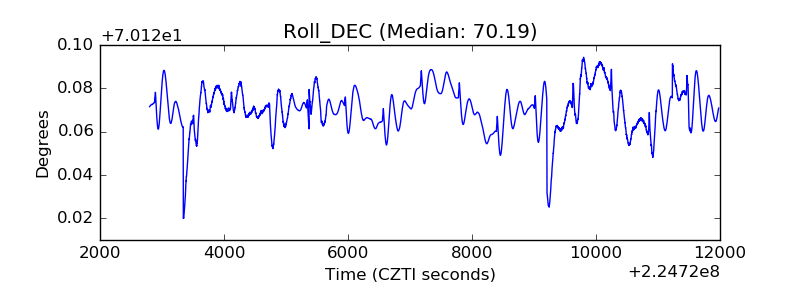 |
| _Roll_RA | 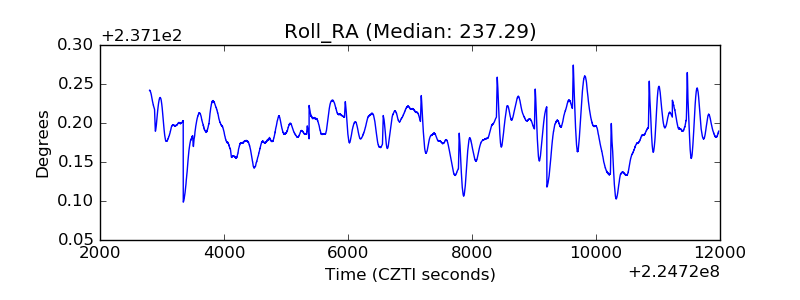 |
| Veto Counter | 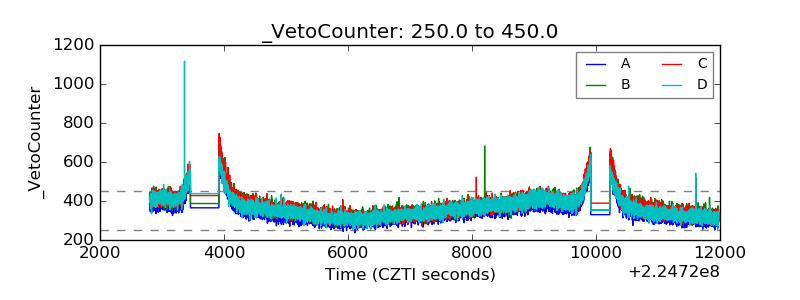 |