| Param | Original file | Final file |
|---|---|---|
| Filename | modeM0/AS1G06_116T01_9000001026_07474cztM0_level2.evt | modeM0/AS1G06_116T01_9000001026_07474cztM0_level2_quad_clean.evt |
| Size (bytes) | 447,874,560 | 123,958,080 |
| Size | 427.1 MB | 118.2 MB |
| Events in quadrant A | 3,126,227 | 812,664 |
| Events in quadrant B | 3,263,240 | 832,532 |
| Events in quadrant C | 3,017,158 | 827,585 |
| Events in quadrant D | 3,676,651 | 789,621 |
| Mode M0 | |||
|---|---|---|---|
| Quadrant | BADHDUFLAG | Total packets | Discarded packets |
| A | 0 | 14610 | 2 |
| B | 0 | 14810 | 1 |
| C | 0 | 14371 | 1 |
| D | 0 | 15731 | 1 |
| Mode SS | |||
|---|---|---|---|
| Quadrant | BADHDUFLAG | Total packets | Discarded packets |
| A | 0 | 142 | 0 |
| B | 0 | 142 | 0 |
| C | 0 | 142 | 0 |
| D | 0 | 142 | 0 |
| Mode M9 | |||
|---|---|---|---|
| Quadrant | BADHDUFLAG | Total packets | Discarded packets |
| A | 0 | 4 | 0 |
| B | 0 | 4 | 0 |
| C | 0 | 4 | 0 |
| D | 0 | 4 | 0 |
| Quadrant | Total seconds | Saturated seconds | Saturation percentage |
|---|---|---|---|
| A | 7072 | 46 | 0.650452% |
| B | 7072 | 62 | 0.876697% |
| C | 7072 | 21 | 0.296946% |
| D | 7072 | 75 | 1.060520% |
Noise dominated data is calculated using 1-second bins in cleaned event files. If a bin has >2000 counts, and if more than 50% of those come from <1% of pixels, then it is considered to be noise-dominated and hence unusable.
| Quadrant | # 1 sec bins | Bins with >0 counts | Bins with >2000 counts | High rate bins dominated by noise | Noise dominated (total time) | Noise dominated (detector-on time) | Marked lightcurve |
|---|---|---|---|---|---|---|---|
| A | 7422 | 7073 | 0 | 0 | 0.00% | 0.00% | 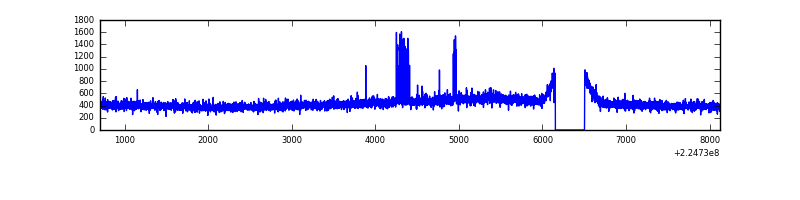 |
| B | 7422 | 7073 | 3 | 3 | 0.04% | 0.04% | 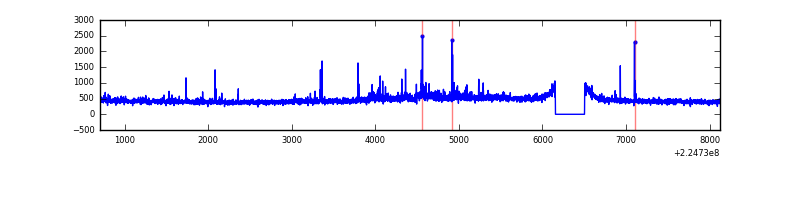 |
| C | 7422 | 7073 | 0 | 0 | 0.00% | 0.00% | 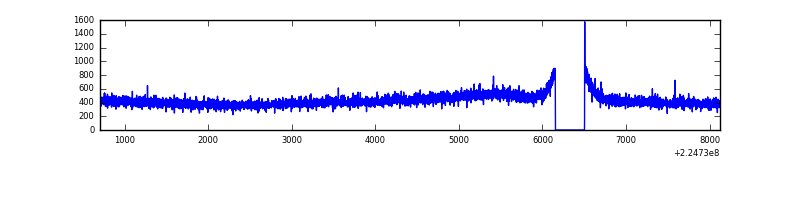 |
| D | 7422 | 7073 | 47 | 47 | 0.63% | 0.66% | 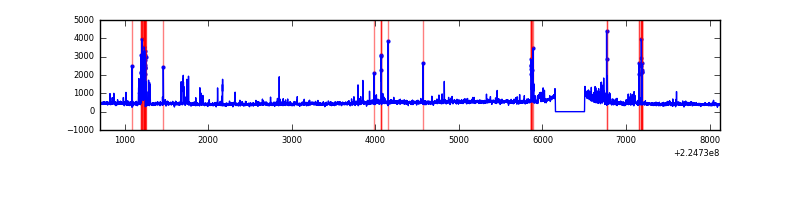 |
Top three noisy pixels from each quadrant. If the there are fewer than three noisy pixels in the level2.evt file, extra rows are filled as -1
| Pixel properties | Quadrant properties | ||||||
|---|---|---|---|---|---|---|---|
| Quadrant | DetID | PixID | Counts | Sigma | Mean | Median | Sigma |
| A | 15 | 239 | 77931 | 479.65 | 785 | 766 | 160.9 |
| A | 8 | 15 | 15315 | 90.43 | 785 | 766 | 160.9 |
| A | 0 | 226 | 7339 | 40.86 | 785 | 766 | 160.9 |
| B | 0 | 214 | 76823 | 496.78 | 797 | 776 | 153.1 |
| B | 4 | 173 | 45621 | 292.95 | 797 | 776 | 153.1 |
| B | 4 | 81 | 30975 | 197.28 | 797 | 776 | 153.1 |
| C | 9 | 68 | 10634 | 55.25 | 769 | 773 | 178.5 |
| C | 13 | 61 | 6023 | 29.42 | 769 | 773 | 178.5 |
| C | 1 | 16 | 4749 | 22.28 | 769 | 773 | 178.5 |
| D | 12 | 221 | 255252 | 1364.09 | 760 | 734 | 186.6 |
| D | 2 | 14 | 152911 | 815.6 | 760 | 734 | 186.6 |
| D | 13 | 105 | 126826 | 675.79 | 760 | 734 | 186.6 |
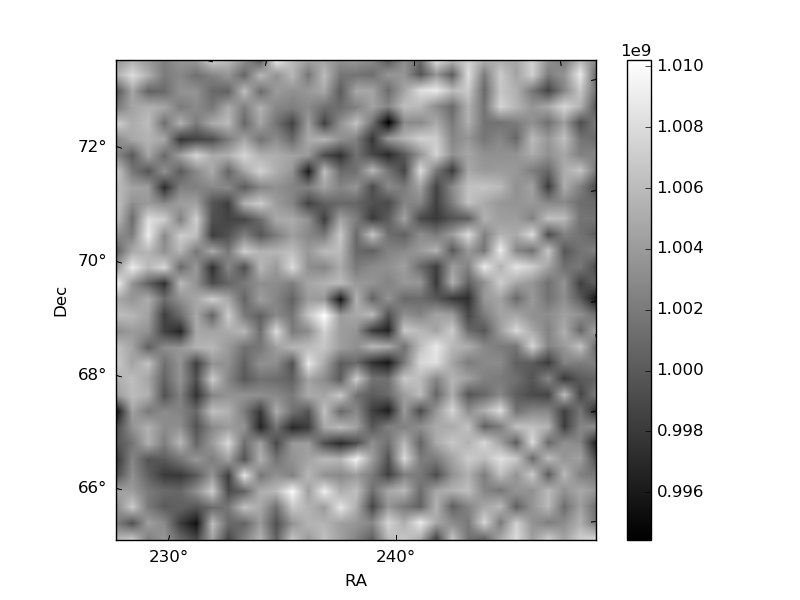
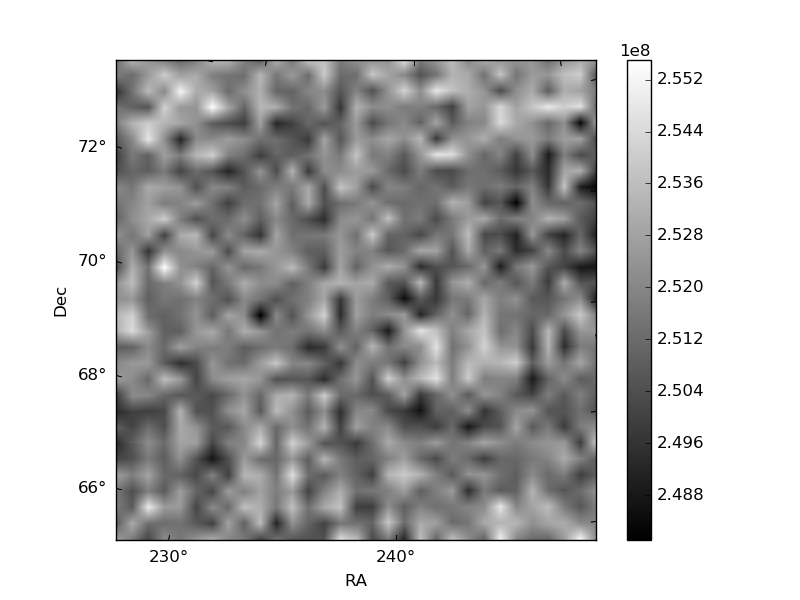
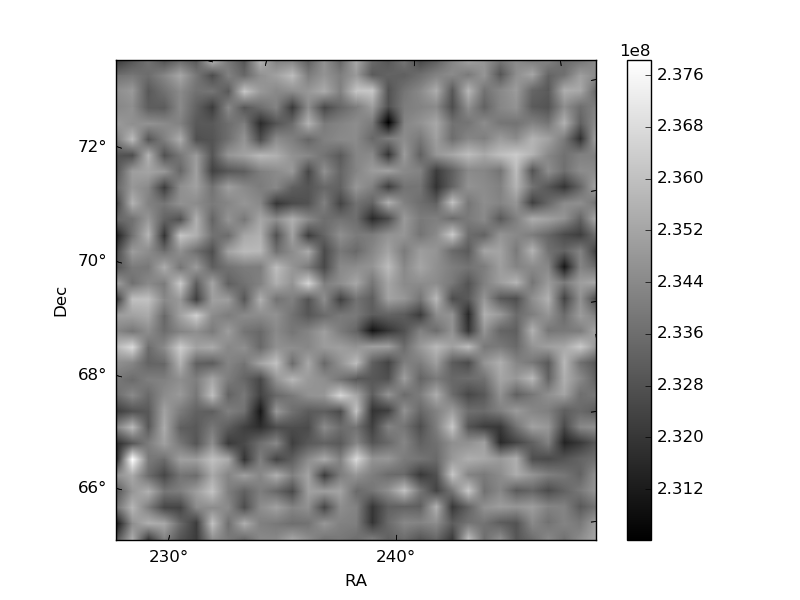
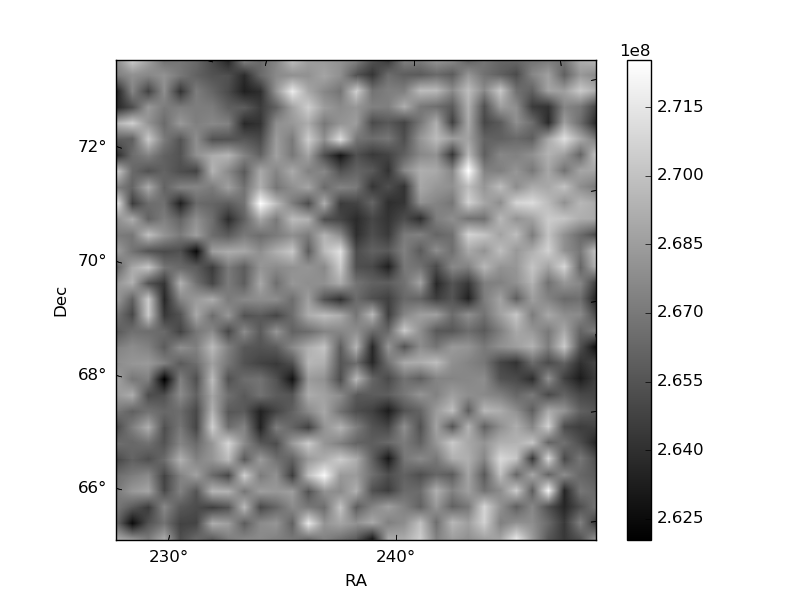
Histogram calculated using DETX and DETY for each event in the final _common_clean file
| Quadrant A | 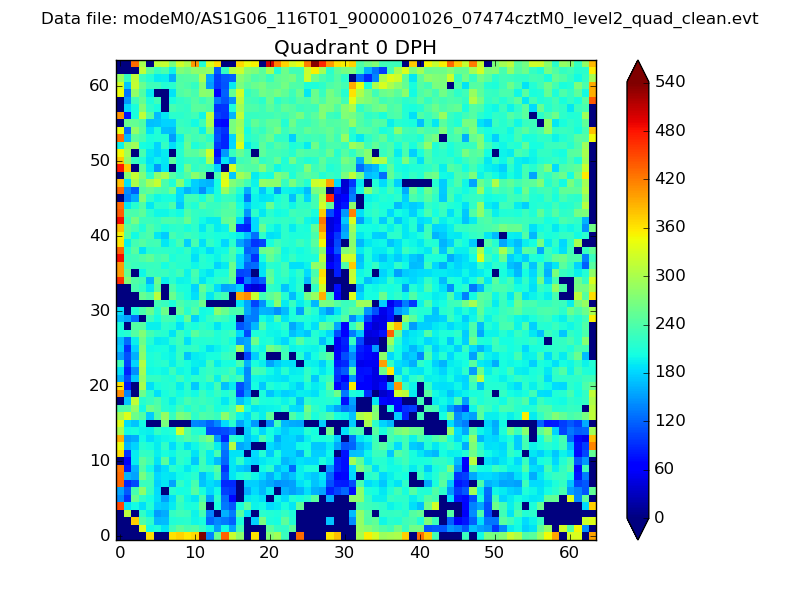 |
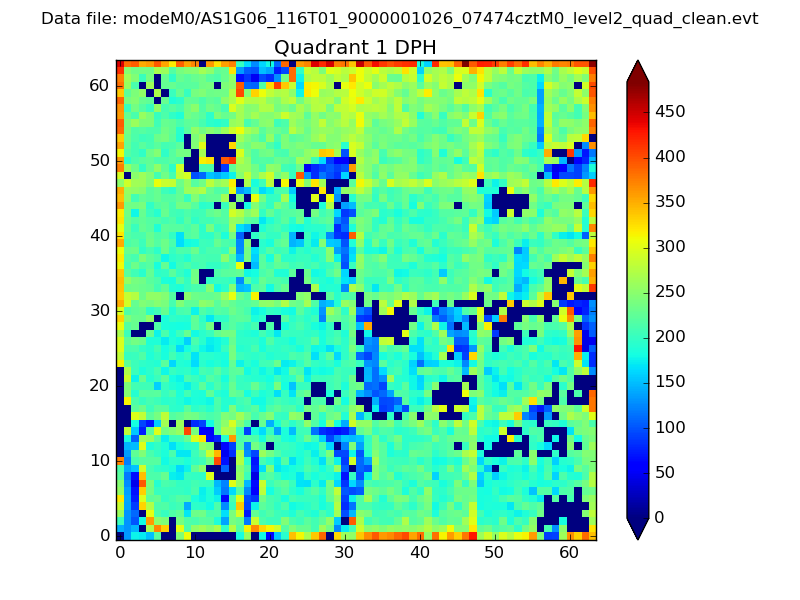 |
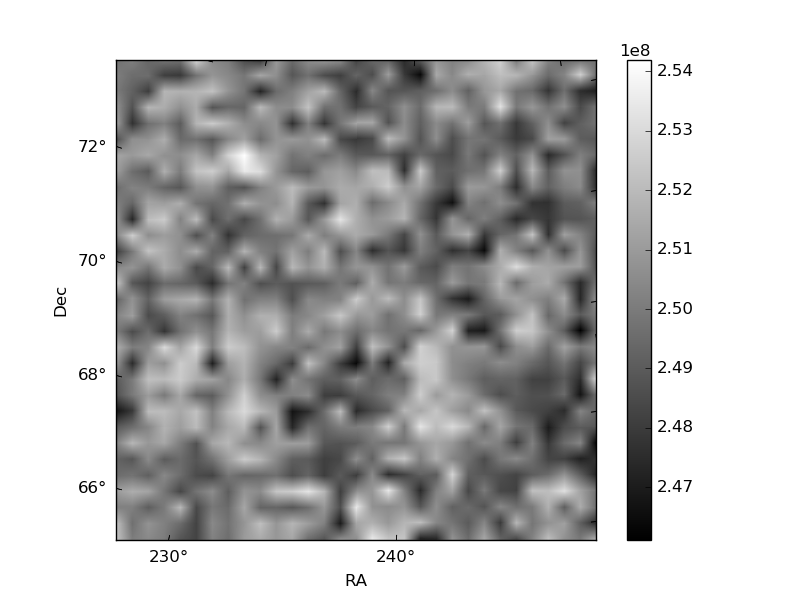
Quadrant B |
|---|---|---|---|
| Quadrant D | 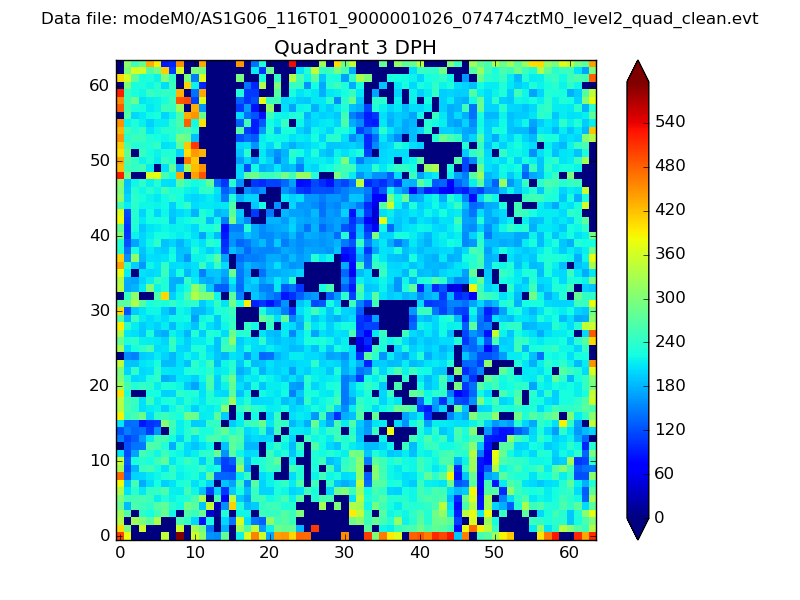 |
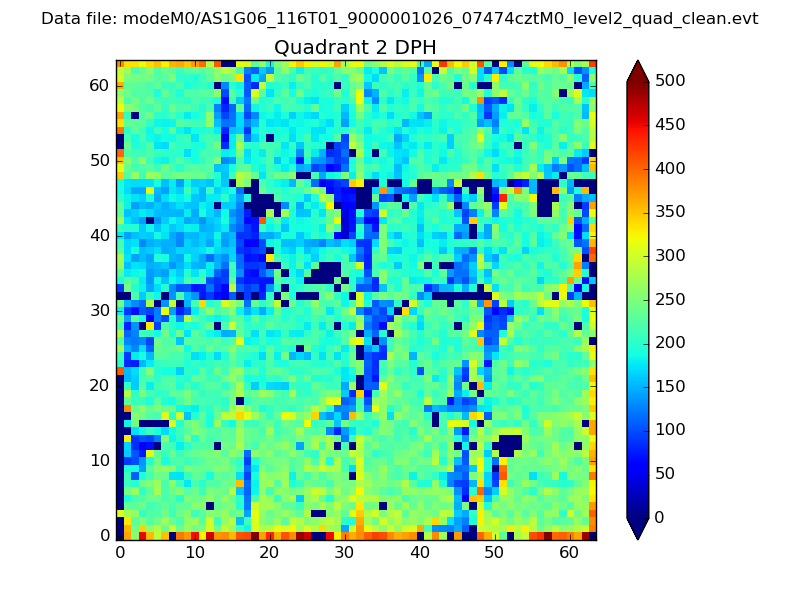 |
Quadrant C |
| Plot type | Count rate plots | Images |
|---|---|---|
| Comparison with Poisson distribution Blue bars denote a histogram of data divided into 1 sec bins. Red curve is a Poisson curve with rate = median count rate of data. |
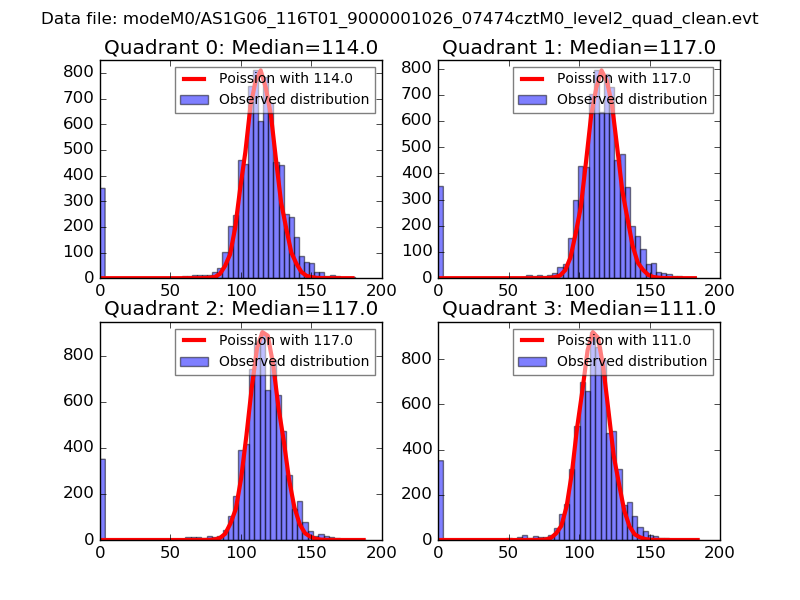 |
 |
| Quadrant-wise count rates Data is divided into 100 sec bins |
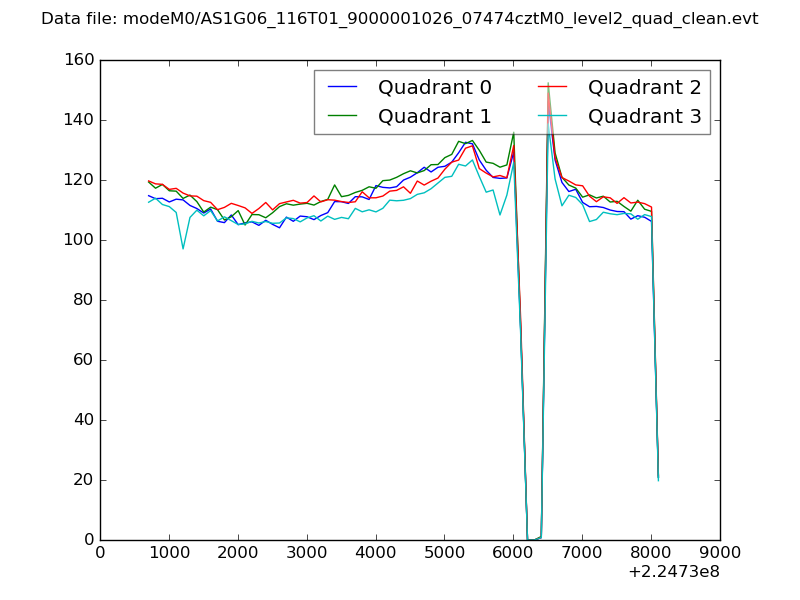 |
|
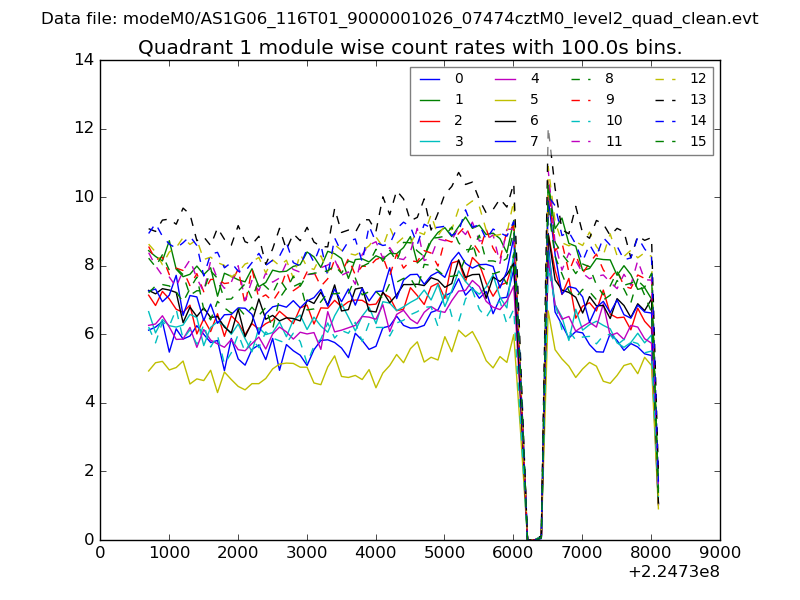
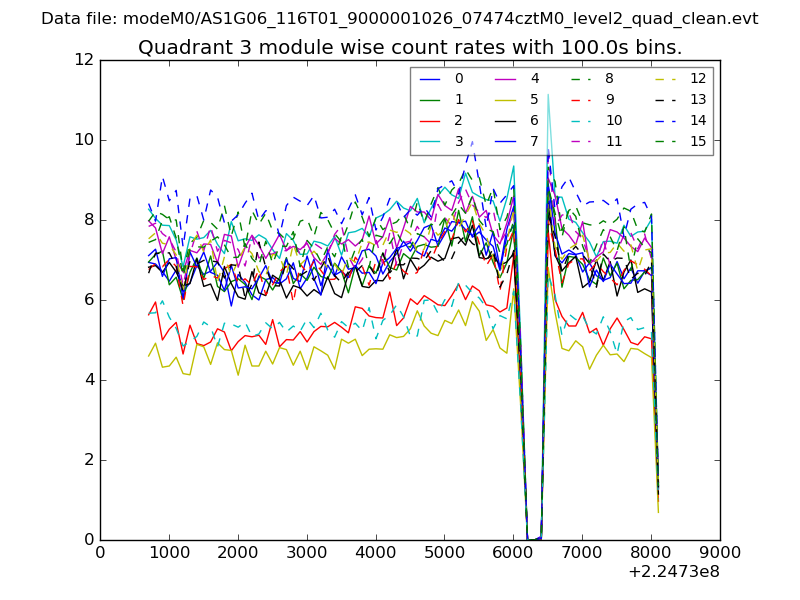
| Module-wise count rates for Quadrant A Data is divided into 100 sec bins |
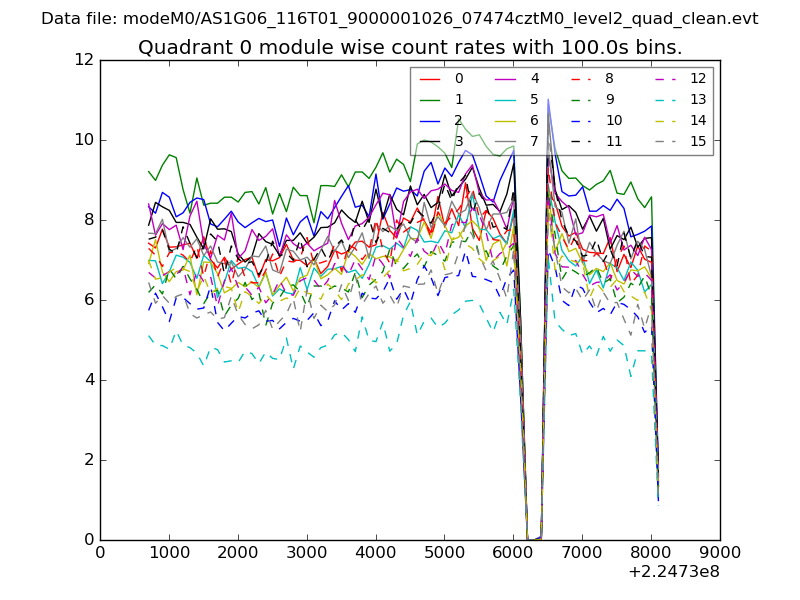 |
 |
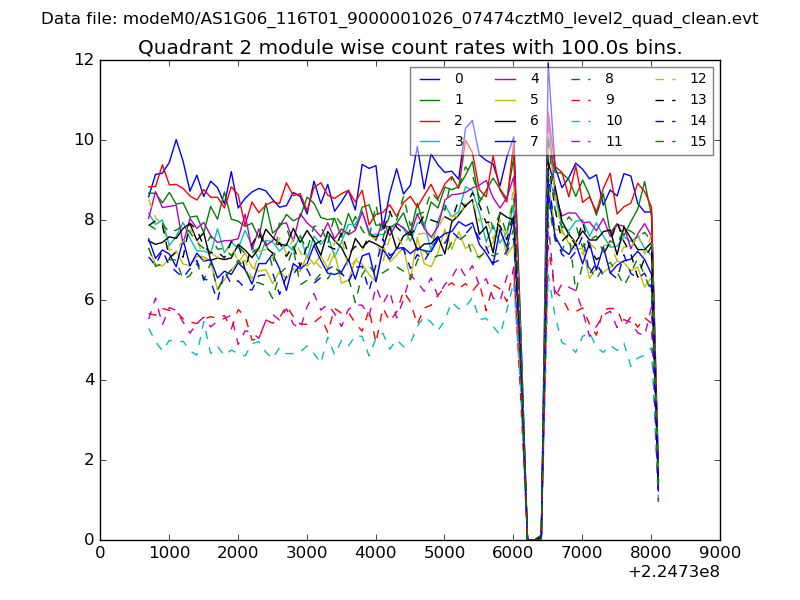
| Module-wise count rates for Quadrant B Data is divided into 100 sec bins |
 |
 |
| Module-wise count rates for Quadrant C Data is divided into 100 sec bins |
 |
 |
| Module-wise count rates for Quadrant D Data is divided into 100 sec bins |
 |
 |
| Parameter | Plot |
|---|---|
| CZT HV Monitor | 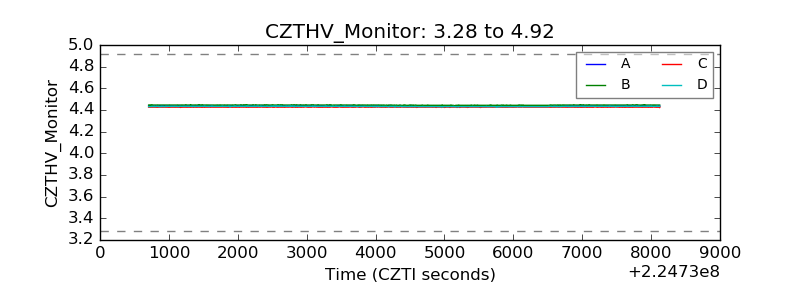 |
| D_VDD | 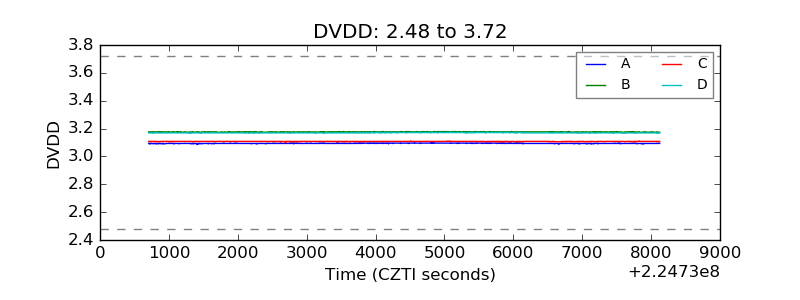 |
| Temperature 1 | 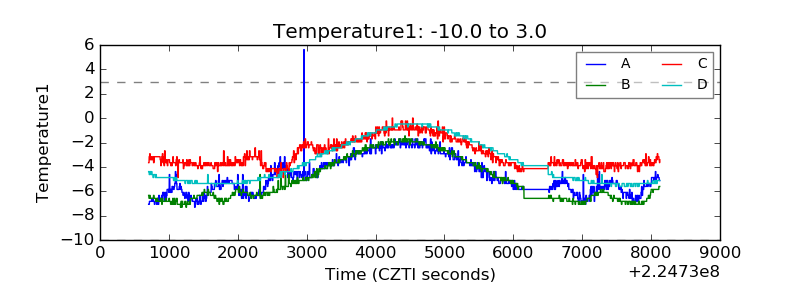 |
| Veto HV Monitor | 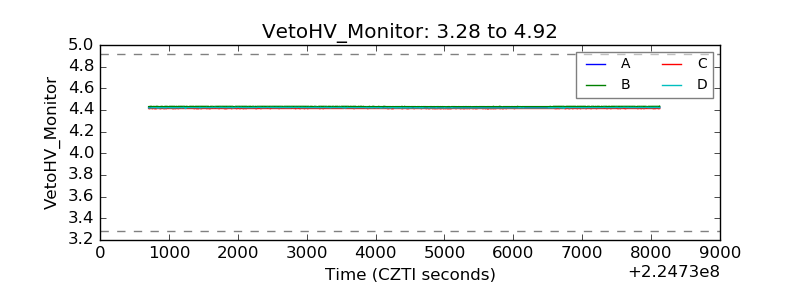 |
| Veto LLD | 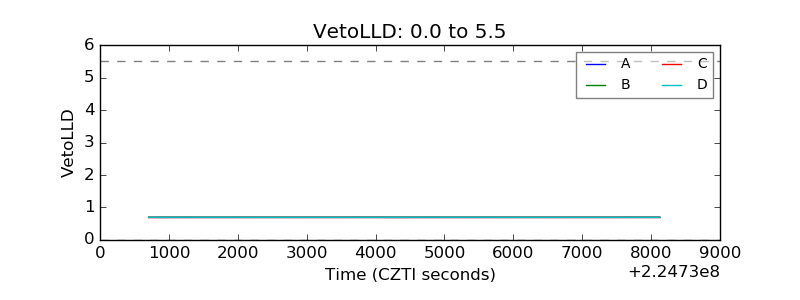 |
| Alpha Counter | 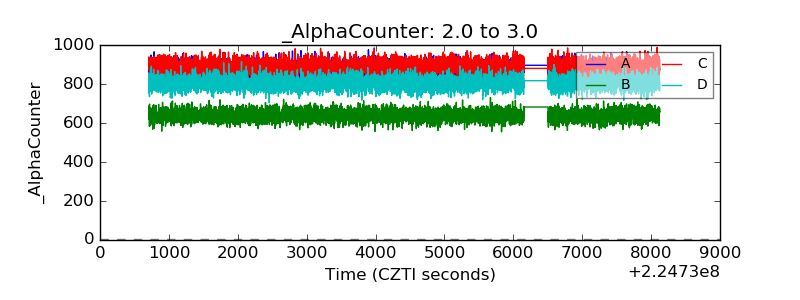 |
| _CPM_Rate | 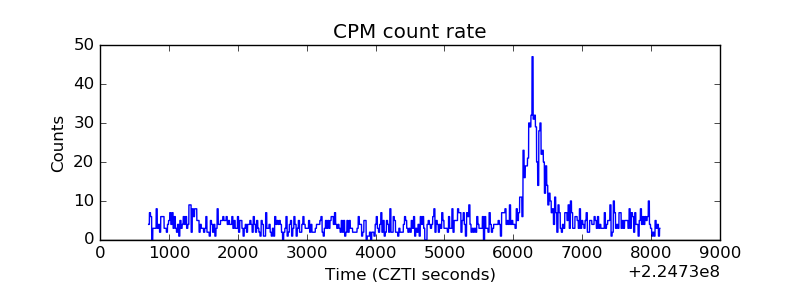 |
| CZT Counter | 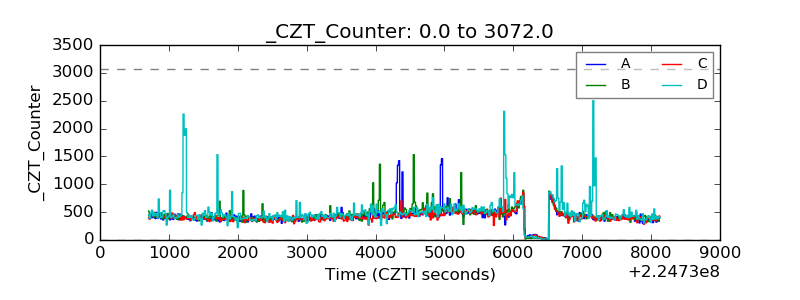 |
| +2.5 Volts monitor | 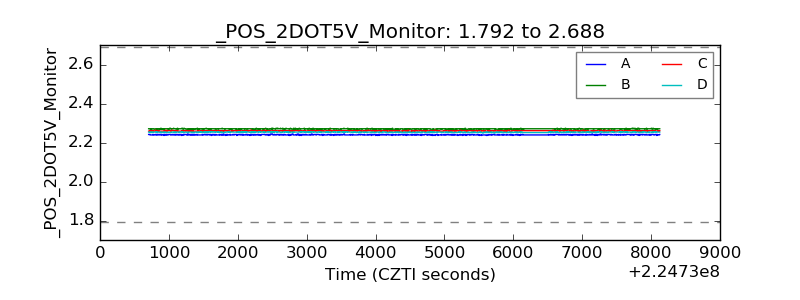 |
| +5 Volts monitor | 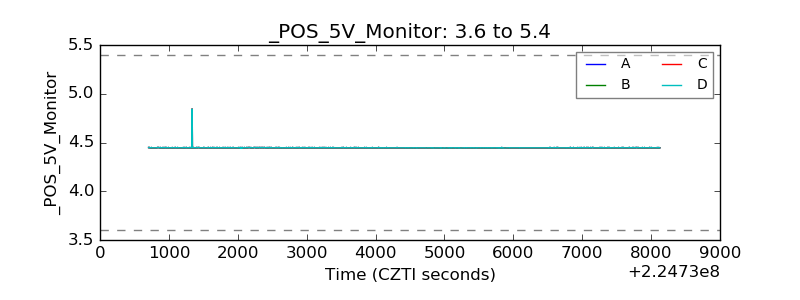 |
| _ROLL_ROT | 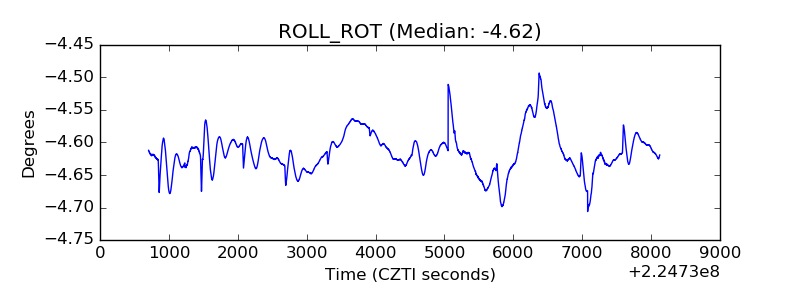 |
| _Roll_DEC | 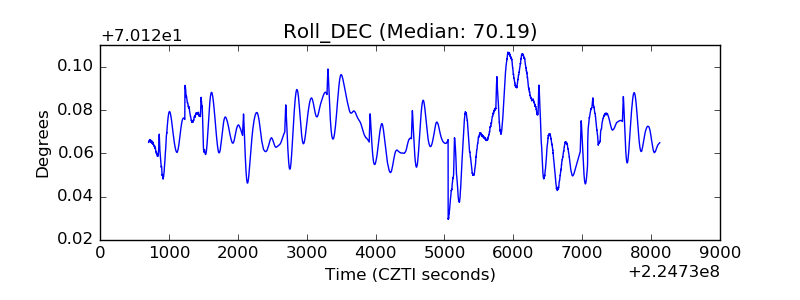 |
| _Roll_RA | 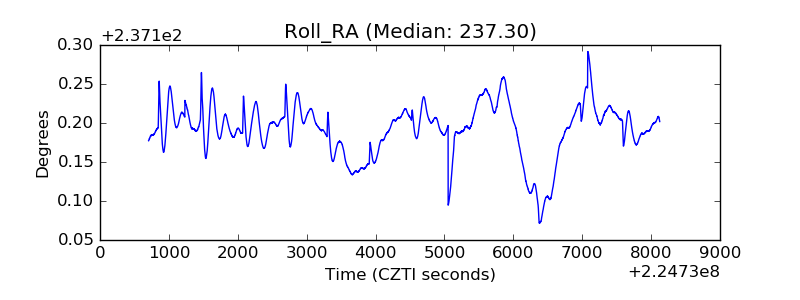 |
| Veto Counter | 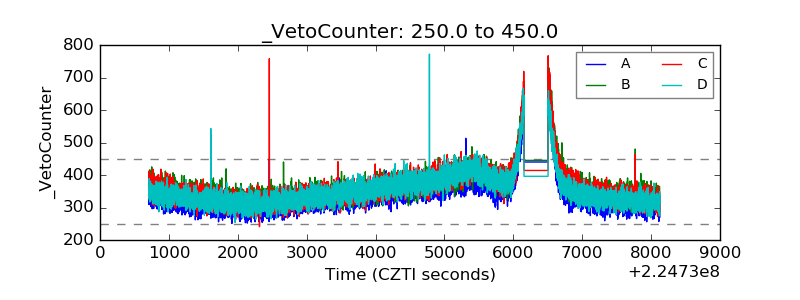 |