| Param | Original file | Final file |
|---|---|---|
| Filename | modeM0/AS1G06_116T01_9000001026_07476cztM0_level2.evt | modeM0/AS1G06_116T01_9000001026_07476cztM0_level2_quad_clean.evt |
| Size (bytes) | 84,686,400 | 26,481,600 |
| Size | 80.8 MB | 25.3 MB |
| Events in quadrant A | 601,714 | 169,052 |
| Events in quadrant B | 616,941 | 172,871 |
| Events in quadrant C | 595,958 | 174,842 |
| Events in quadrant D | 640,281 | 168,909 |
| Mode M0 | |||
|---|---|---|---|
| Quadrant | BADHDUFLAG | Total packets | Discarded packets |
| A | 0 | 3129 | 1 |
| B | 0 | 3128 | 0 |
| C | 0 | 3125 | 0 |
| D | 0 | 3151 | 0 |
| Mode SS | |||
|---|---|---|---|
| Quadrant | BADHDUFLAG | Total packets | Discarded packets |
| A | 0 | 32 | 0 |
| B | 0 | 32 | 0 |
| C | 0 | 32 | 0 |
| D | 0 | 32 | 0 |
| Quadrant | Total seconds | Saturated seconds | Saturation percentage |
|---|---|---|---|
| A | 1565 | 0 | 0.000000% |
| B | 1565 | 1 | 0.063898% |
| C | 1565 | 0 | 0.000000% |
| D | 1565 | 0 | 0.000000% |
Noise dominated data is calculated using 1-second bins in cleaned event files. If a bin has >2000 counts, and if more than 50% of those come from <1% of pixels, then it is considered to be noise-dominated and hence unusable.
| Quadrant | # 1 sec bins | Bins with >0 counts | Bins with >2000 counts | High rate bins dominated by noise | Noise dominated (total time) | Noise dominated (detector-on time) | Marked lightcurve |
|---|---|---|---|---|---|---|---|
| A | 1565 | 1565 | 0 | 0 | 0.00% | 0.00% | 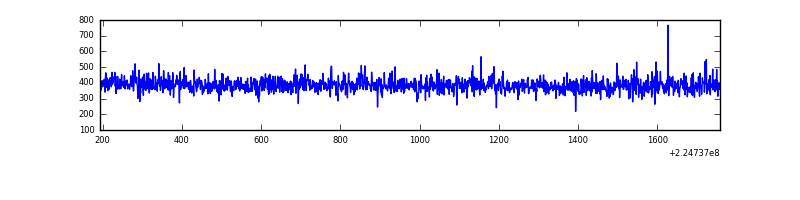 |
| B | 1565 | 1565 | 0 | 0 | 0.00% | 0.00% | 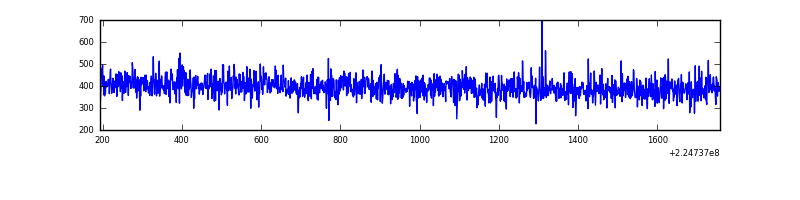 |
| C | 1565 | 1565 | 0 | 0 | 0.00% | 0.00% | 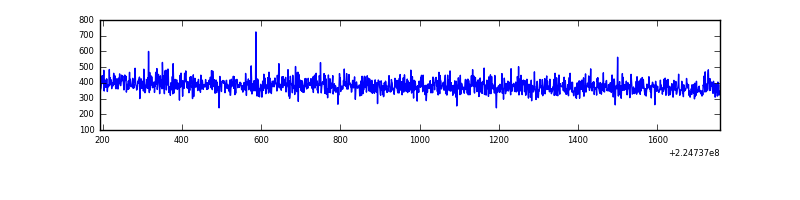 |
| D | 1565 | 1565 | 0 | 0 | 0.00% | 0.00% | 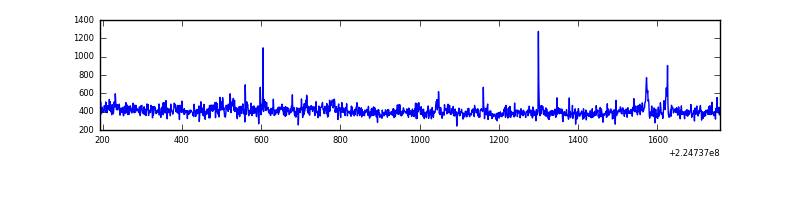 |
Top three noisy pixels from each quadrant. If the there are fewer than three noisy pixels in the level2.evt file, extra rows are filled as -1
| Pixel properties | Quadrant properties | ||||||
|---|---|---|---|---|---|---|---|
| Quadrant | DetID | PixID | Counts | Sigma | Mean | Median | Sigma |
| A | 8 | 15 | 2563 | 71.04 | 155 | 152 | 33.9 |
| A | 0 | 226 | 1445 | 38.1 | 155 | 152 | 33.9 |
| A | 12 | 194 | 1344 | 35.12 | 155 | 152 | 33.9 |
| B | 12 | 111 | 3303 | 97.2 | 158 | 155 | 32.4 |
| B | 11 | 111 | 2519 | 72.99 | 158 | 155 | 32.4 |
| B | 14 | 111 | 1830 | 51.72 | 158 | 155 | 32.4 |
| C | 13 | 61 | 1245 | 29.61 | 152 | 153 | 36.9 |
| C | 9 | 68 | 1089 | 25.38 | 152 | 153 | 36.9 |
| C | 1 | 16 | 725 | 15.51 | 152 | 153 | 36.9 |
| D | 12 | 221 | 43108 | 1142.16 | 148 | 143 | 37.6 |
| D | 8 | 195 | 16993 | 447.93 | 148 | 143 | 37.6 |
| D | 5 | 233 | 9543 | 249.89 | 148 | 143 | 37.6 |
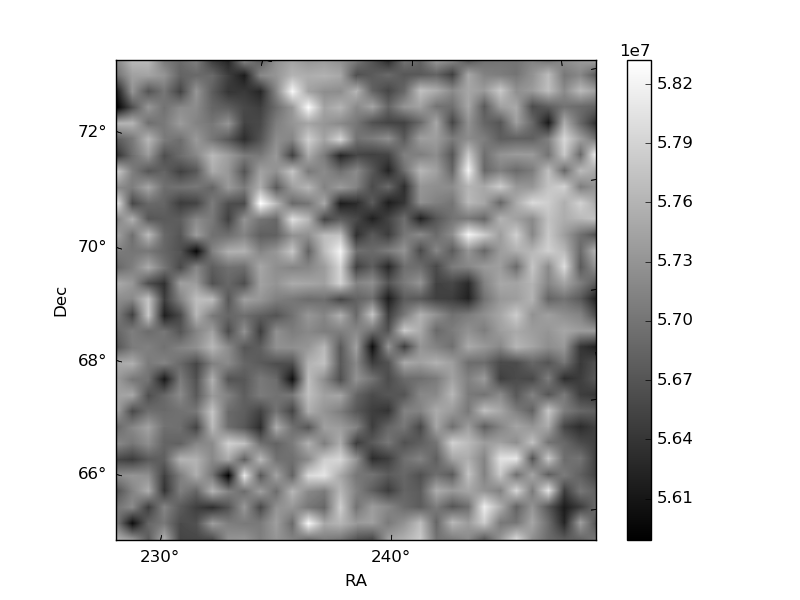
Histogram calculated using DETX and DETY for each event in the final _common_clean file
| Quadrant A | 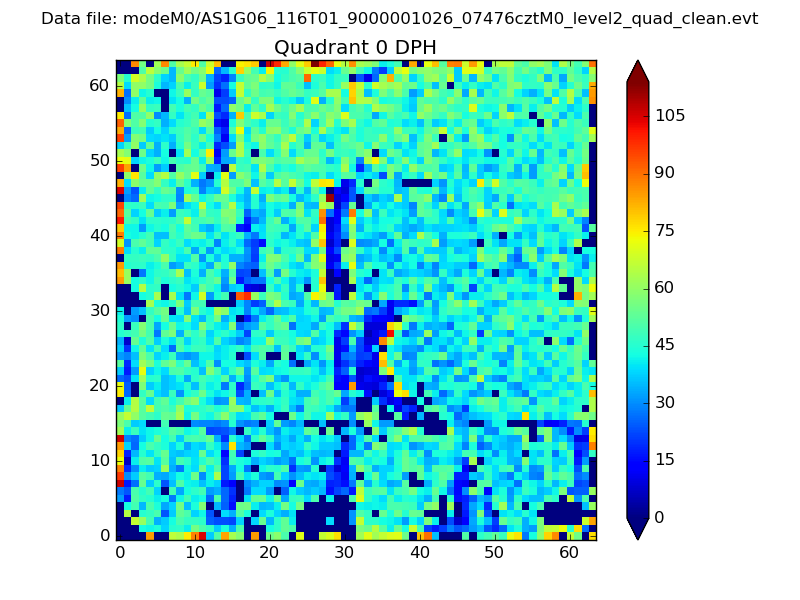 |
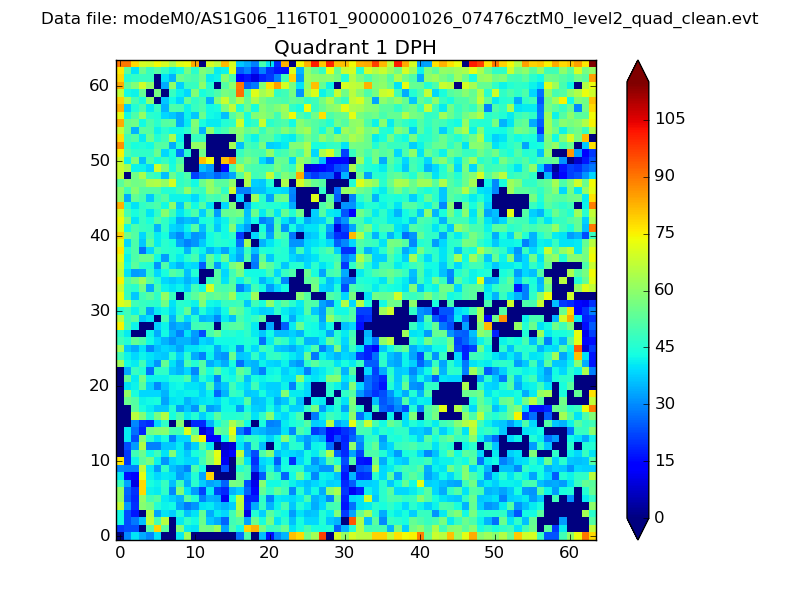 |
Quadrant B |
|---|---|---|---|
| Quadrant D | 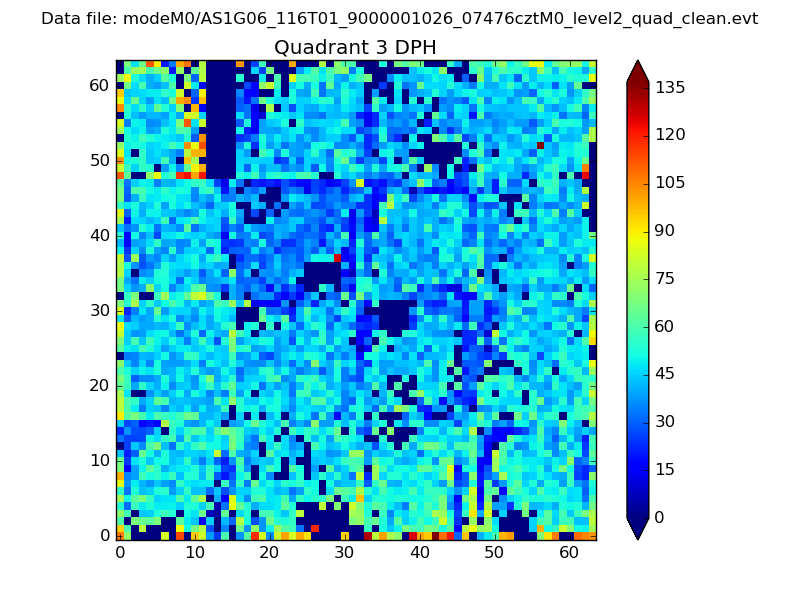 |
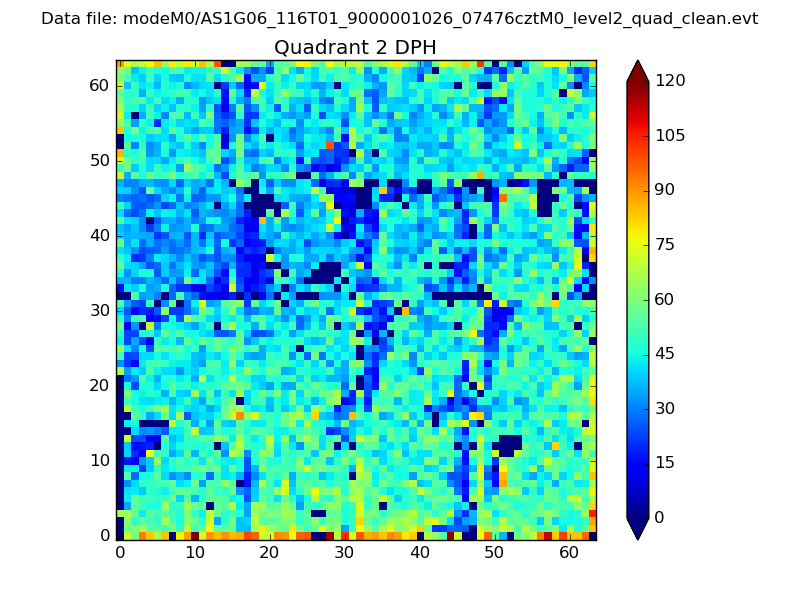 |
Quadrant C |
| Plot type | Count rate plots | Images |
|---|---|---|
| Comparison with Poisson distribution Blue bars denote a histogram of data divided into 1 sec bins. Red curve is a Poisson curve with rate = median count rate of data. |
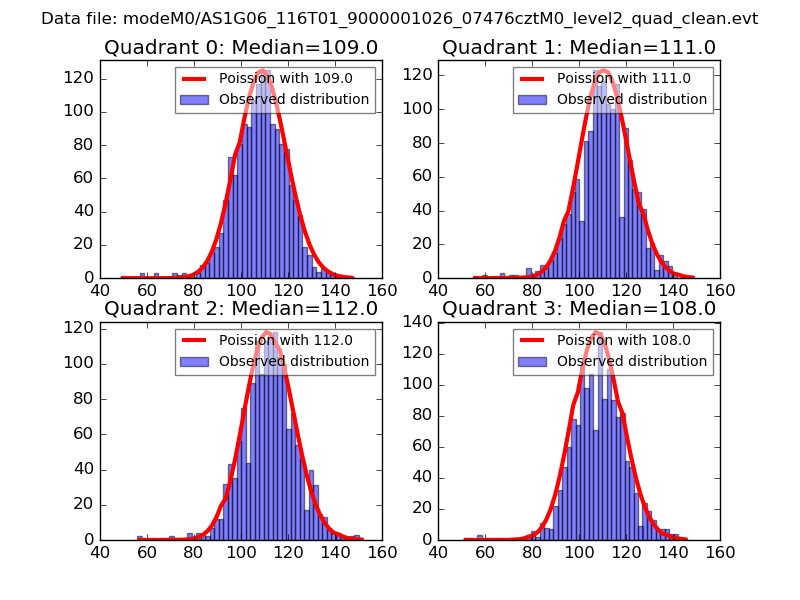 |
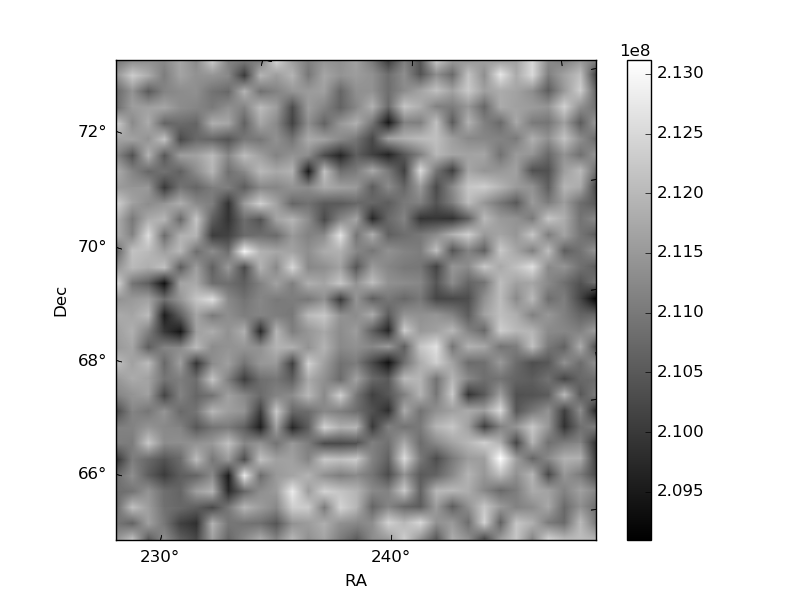 |
| Quadrant-wise count rates Data is divided into 100 sec bins |
 |
|
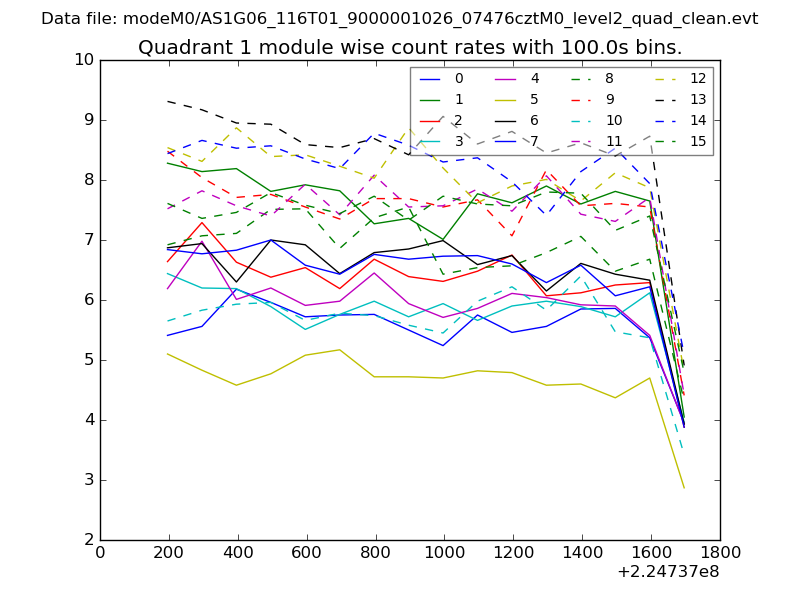
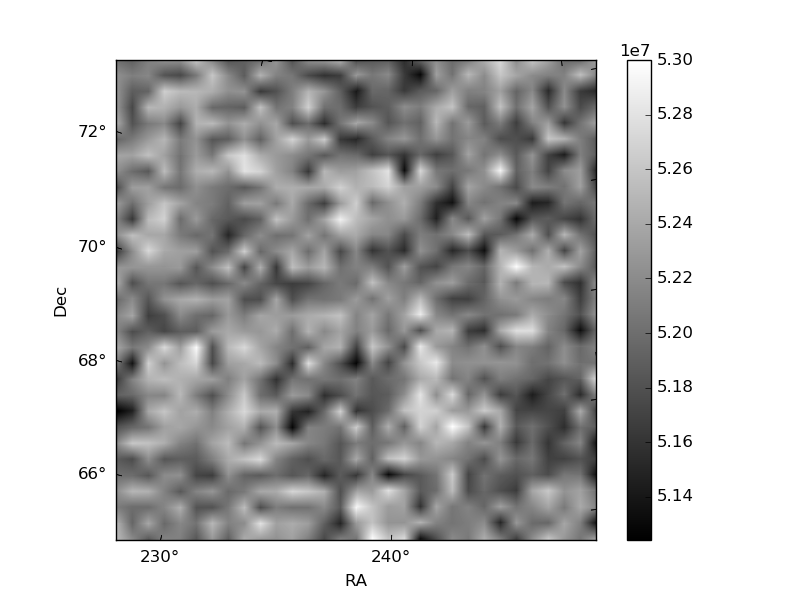
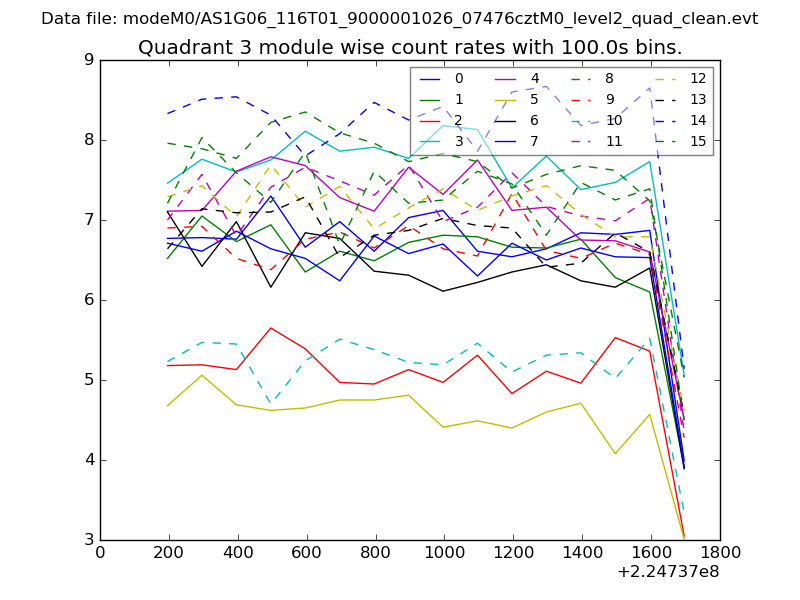
| Module-wise count rates for Quadrant A Data is divided into 100 sec bins |
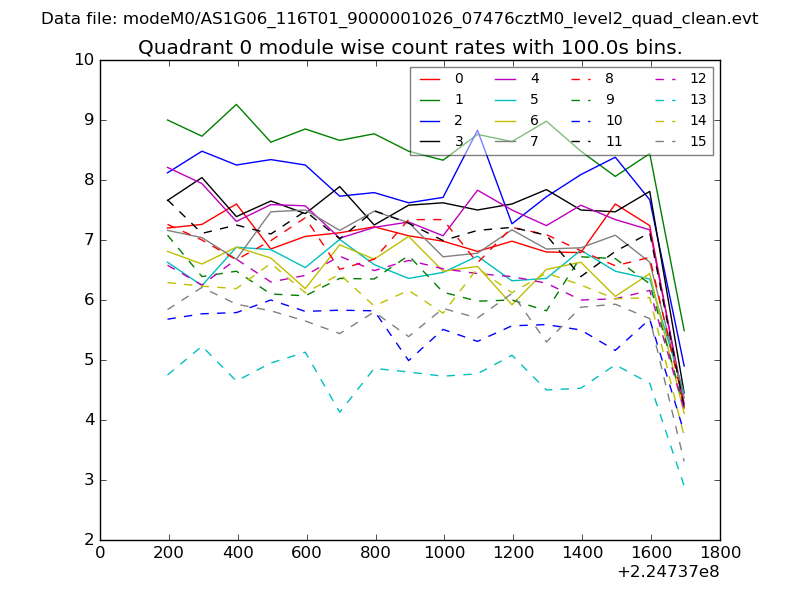 |
 |
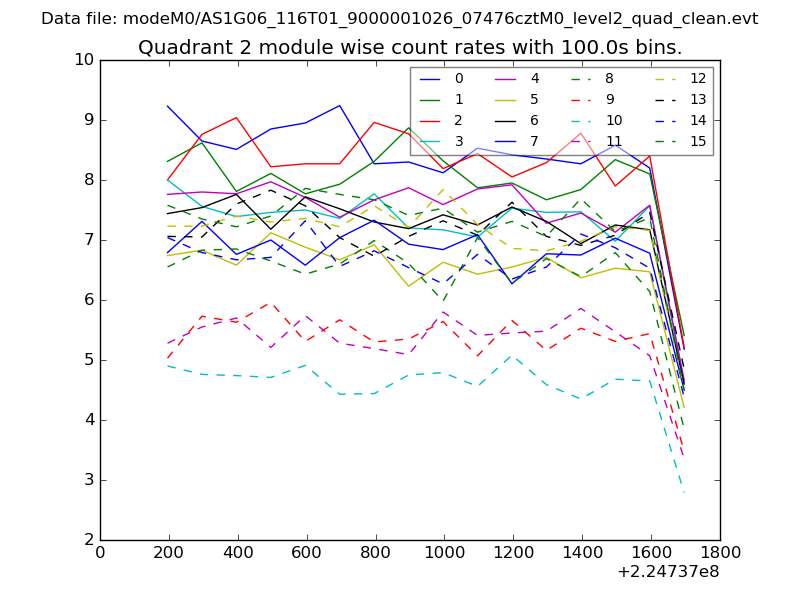
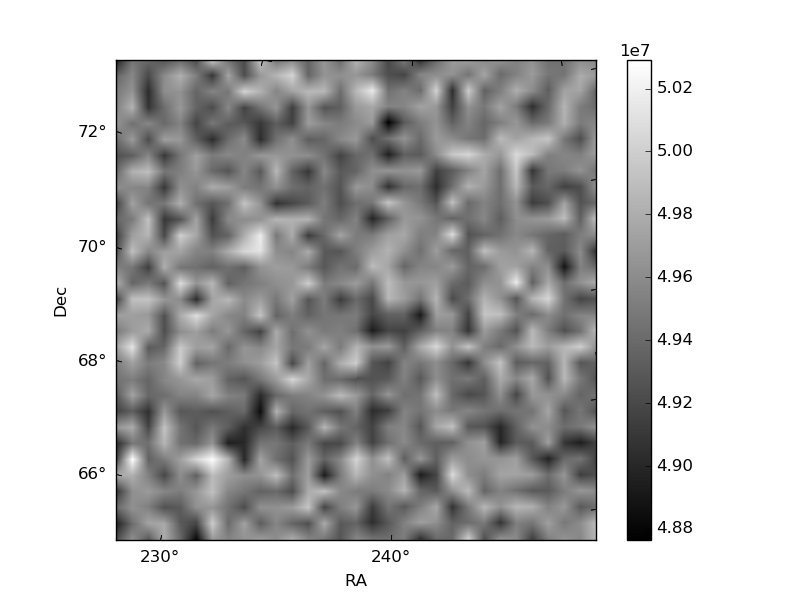
| Module-wise count rates for Quadrant B Data is divided into 100 sec bins |
 |
 |
| Module-wise count rates for Quadrant C Data is divided into 100 sec bins |
 |
 |
| Module-wise count rates for Quadrant D Data is divided into 100 sec bins |
 |
 |
| Parameter | Plot |
|---|---|
| CZT HV Monitor | 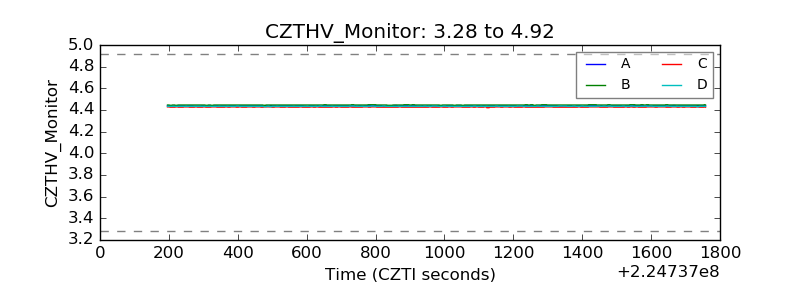 |
| D_VDD | 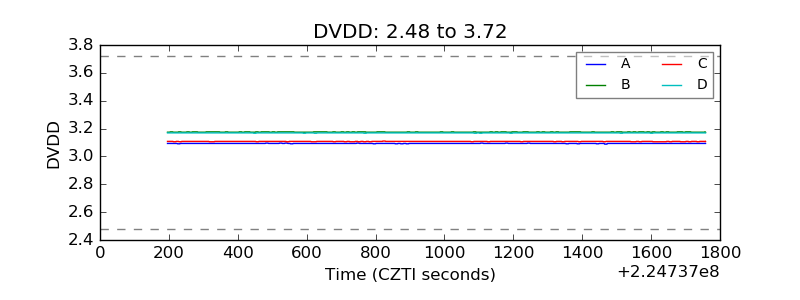 |
| Temperature 1 | 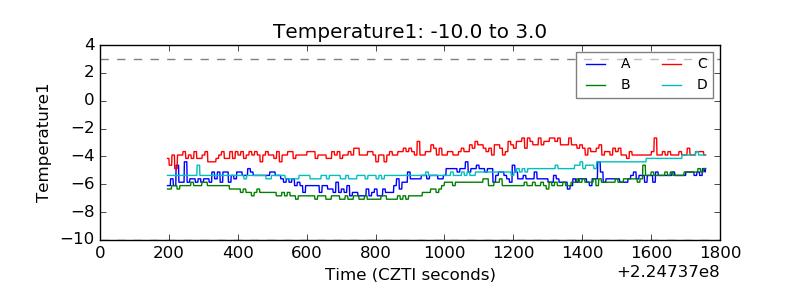 |
| Veto HV Monitor | 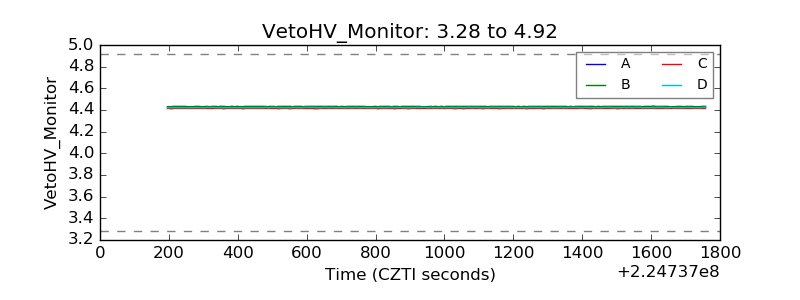 |
| Veto LLD | 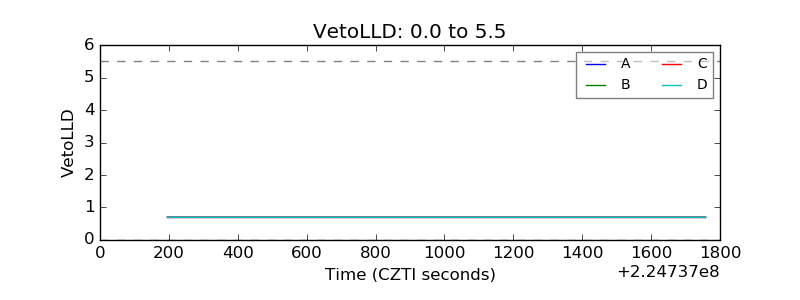 |
| Alpha Counter | 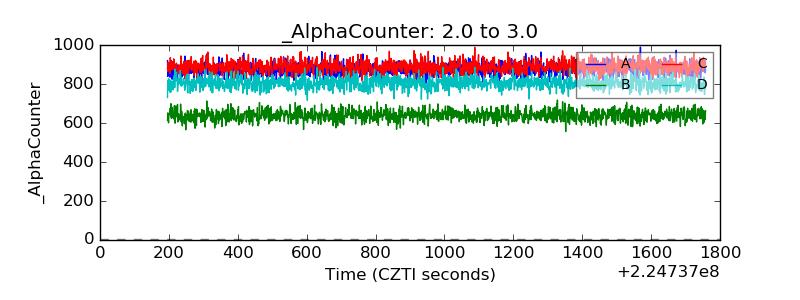 |
| _CPM_Rate | 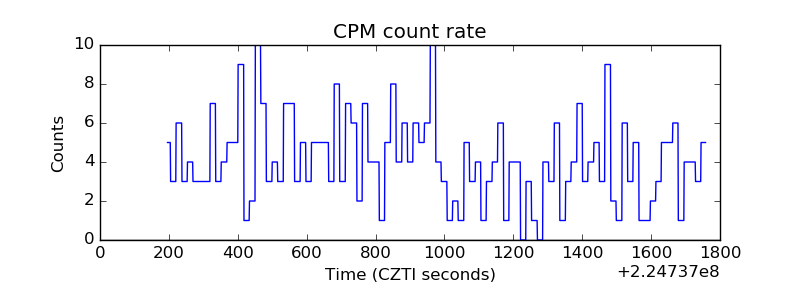 |
| CZT Counter | 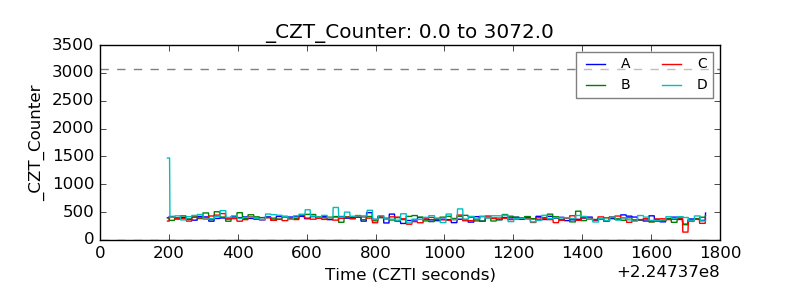 |
| +2.5 Volts monitor |  |
| +5 Volts monitor |  |
| _ROLL_ROT | 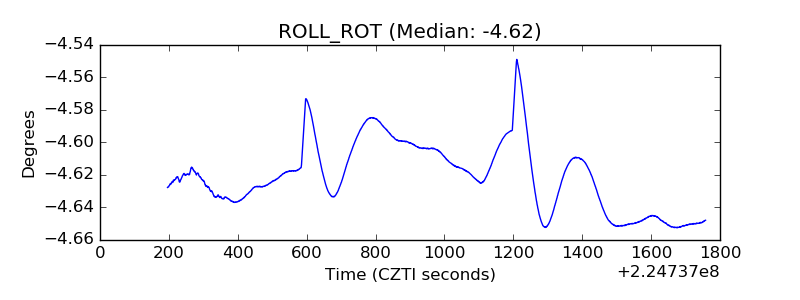 |
| _Roll_DEC | 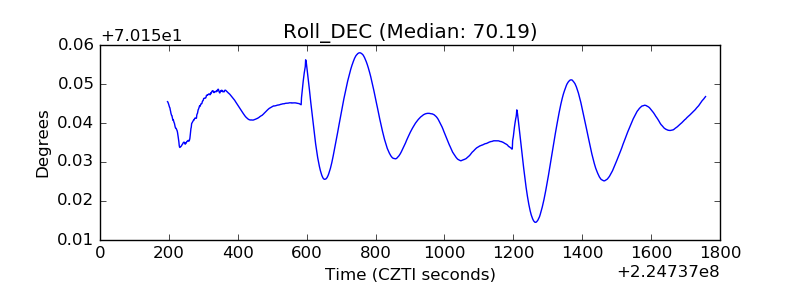 |
| _Roll_RA |  |
| Veto Counter | 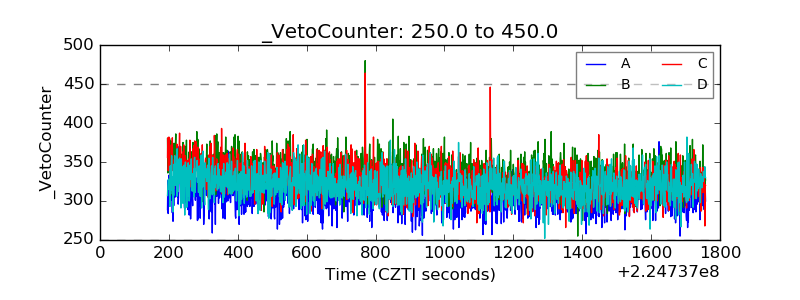 |