| Param | Original file | Final file |
|---|---|---|
| Filename | modeM0/AS1G06_116T01_9000001026_07477cztM0_level2.evt | modeM0/AS1G06_116T01_9000001026_07477cztM0_level2_quad_clean.evt |
| Size (bytes) | 1,032,007,680 | 277,436,160 |
| Size | 984.2 MB | 264.6 MB |
| Events in quadrant A | 7,528,932 | 1,832,243 |
| Events in quadrant B | 7,375,511 | 1,874,255 |
| Events in quadrant C | 6,892,805 | 1,843,252 |
| Events in quadrant D | 8,383,988 | 1,760,720 |
| Mode M0 | |||
|---|---|---|---|
| Quadrant | BADHDUFLAG | Total packets | Discarded packets |
| A | 0 | 33793 | 3 |
| B | 0 | 32771 | 5 |
| C | 0 | 32167 | 3 |
| D | 0 | 35130 | 3 |
| Mode SS | |||
|---|---|---|---|
| Quadrant | BADHDUFLAG | Total packets | Discarded packets |
| A | 0 | 324 | 0 |
| B | 0 | 324 | 0 |
| C | 0 | 324 | 0 |
| D | 0 | 324 | 0 |
| Mode M9 | |||
|---|---|---|---|
| Quadrant | BADHDUFLAG | Total packets | Discarded packets |
| A | 0 | 20 | 0 |
| B | 0 | 20 | 0 |
| C | 0 | 20 | 0 |
| D | 0 | 20 | 0 |
| Quadrant | Total seconds | Saturated seconds | Saturation percentage |
|---|---|---|---|
| A | 15845 | 282 | 1.779741% |
| B | 15844 | 133 | 0.839434% |
| C | 15845 | 72 | 0.454402% |
| D | 15845 | 210 | 1.325339% |
Noise dominated data is calculated using 1-second bins in cleaned event files. If a bin has >2000 counts, and if more than 50% of those come from <1% of pixels, then it is considered to be noise-dominated and hence unusable.
| Quadrant | # 1 sec bins | Bins with >0 counts | Bins with >2000 counts | High rate bins dominated by noise | Noise dominated (total time) | Noise dominated (detector-on time) | Marked lightcurve |
|---|---|---|---|---|---|---|---|
| A | 17895 | 15847 | 144 | 144 | 0.80% | 0.91% | 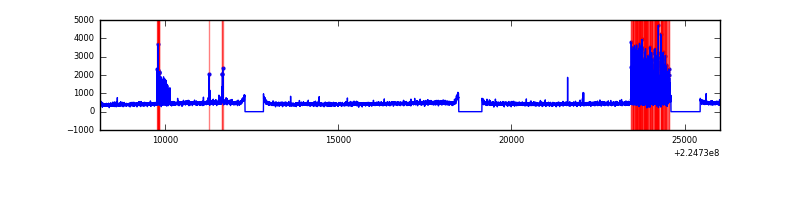 |
| B | 17895 | 15848 | 12 | 12 | 0.07% | 0.08% | 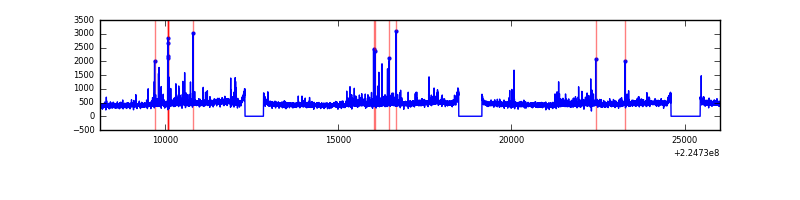 |
| C | 17895 | 15848 | 4 | 4 | 0.02% | 0.03% | 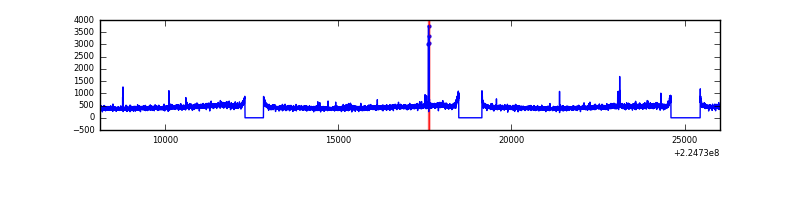 |
| D | 17895 | 15846 | 101 | 101 | 0.56% | 0.64% | 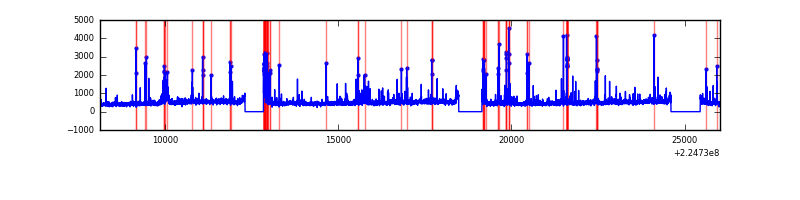 |
Top three noisy pixels from each quadrant. If the there are fewer than three noisy pixels in the level2.evt file, extra rows are filled as -1
| Pixel properties | Quadrant properties | ||||||
|---|---|---|---|---|---|---|---|
| Quadrant | DetID | PixID | Counts | Sigma | Mean | Median | Sigma |
| A | 15 | 239 | 570338 | 1578.15 | 1788 | 1747 | 360.3 |
| A | 8 | 15 | 32718 | 85.96 | 1788 | 1747 | 360.3 |
| A | 15 | 234 | 32698 | 85.9 | 1788 | 1747 | 360.3 |
| B | 0 | 214 | 286912 | 829.07 | 1806 | 1761 | 343.9 |
| B | 12 | 111 | 35234 | 97.32 | 1806 | 1761 | 343.9 |
| B | 11 | 111 | 27963 | 76.18 | 1806 | 1761 | 343.9 |
| C | 10 | 22 | 30399 | 71.34 | 1744 | 1749 | 401.6 |
| C | 1 | 16 | 27895 | 65.1 | 1744 | 1749 | 401.6 |
| C | 9 | 68 | 20844 | 47.54 | 1744 | 1749 | 401.6 |
| D | 12 | 221 | 564558 | 1332.65 | 1738 | 1681 | 422.4 |
| D | 8 | 195 | 266937 | 628.01 | 1738 | 1681 | 422.4 |
| D | 2 | 14 | 239966 | 564.16 | 1738 | 1681 | 422.4 |
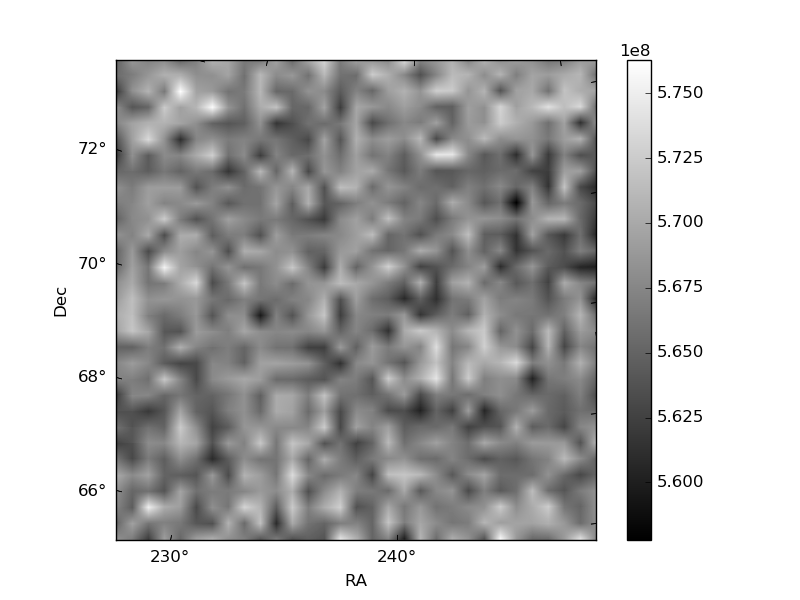
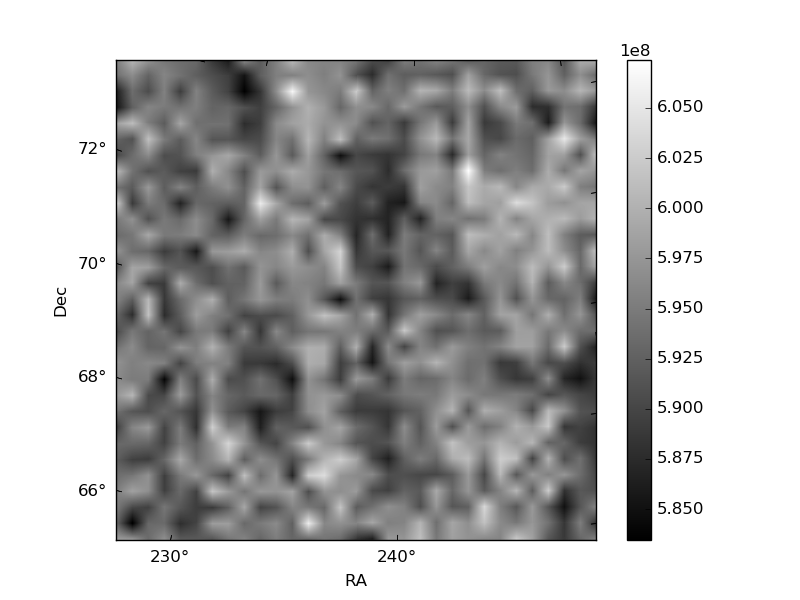
Histogram calculated using DETX and DETY for each event in the final _common_clean file
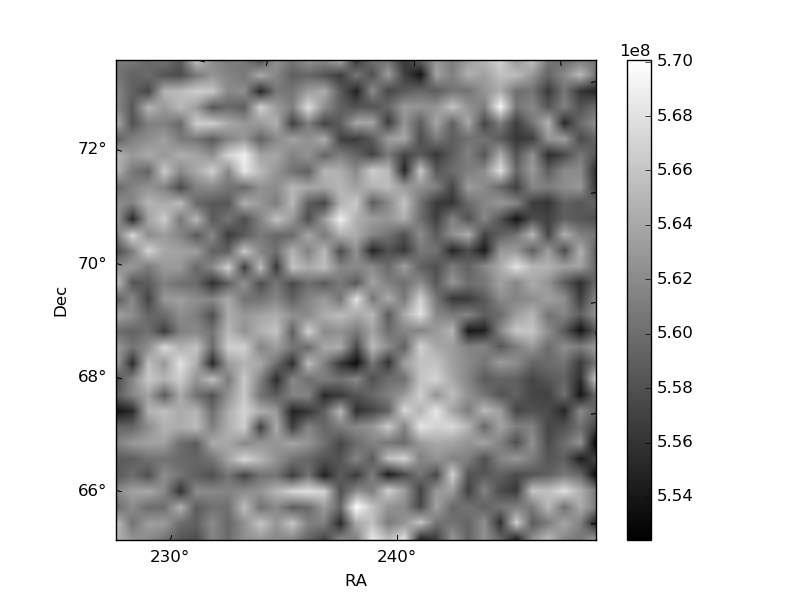
| Quadrant A | 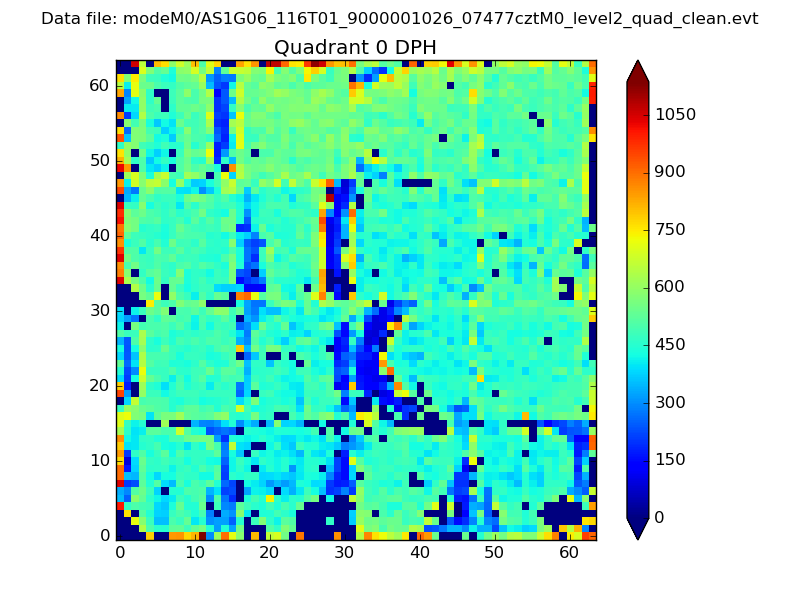 |
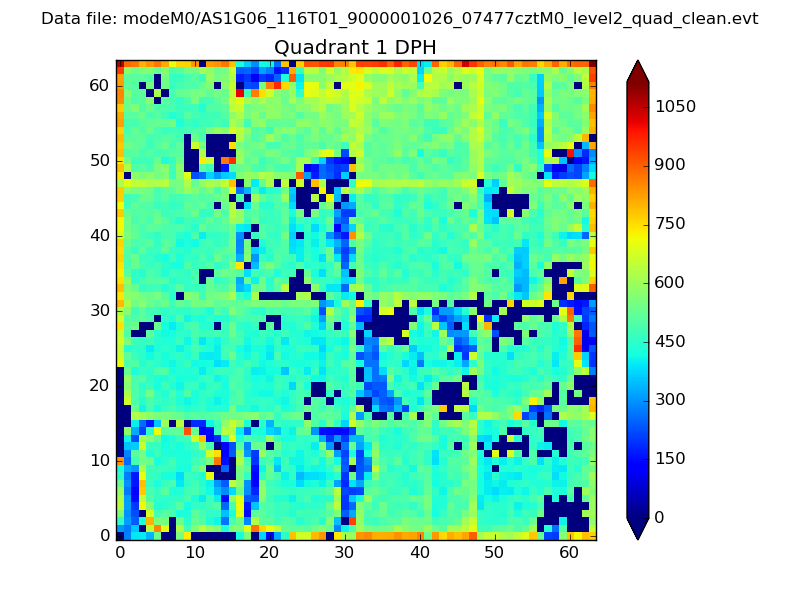 |
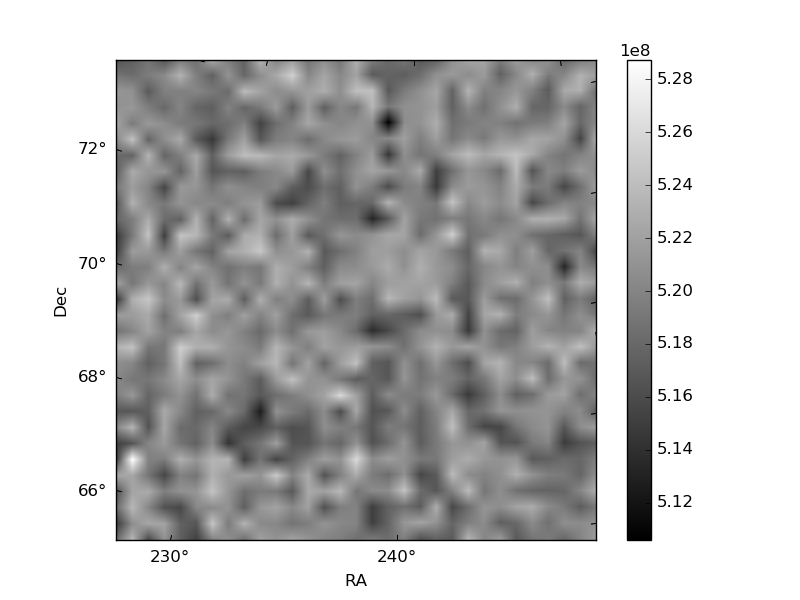
Quadrant B |
|---|---|---|---|
| Quadrant D | 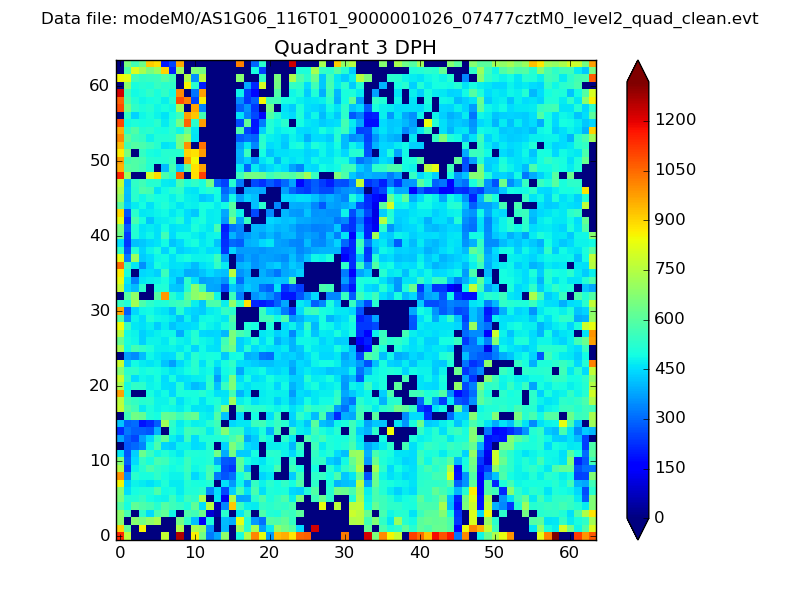 |
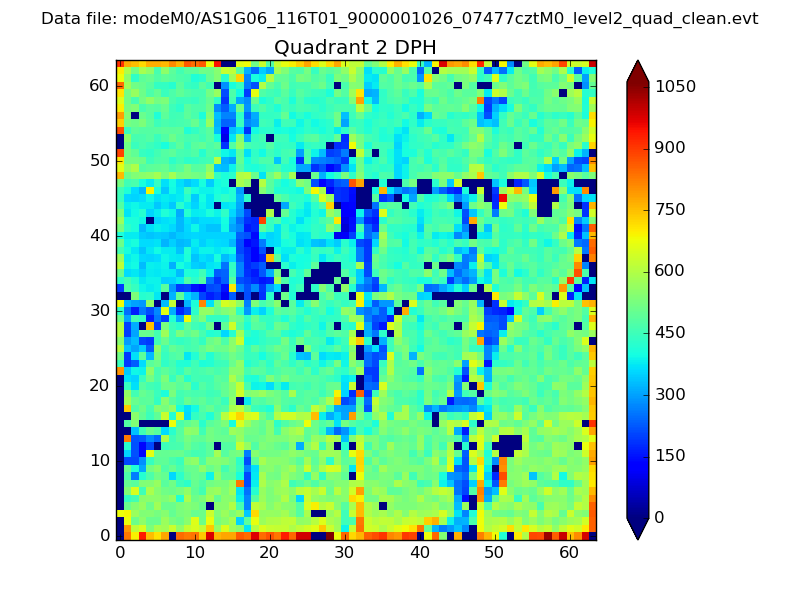 |
Quadrant C |
| Plot type | Count rate plots | Images |
|---|---|---|
| Comparison with Poisson distribution Blue bars denote a histogram of data divided into 1 sec bins. Red curve is a Poisson curve with rate = median count rate of data. |
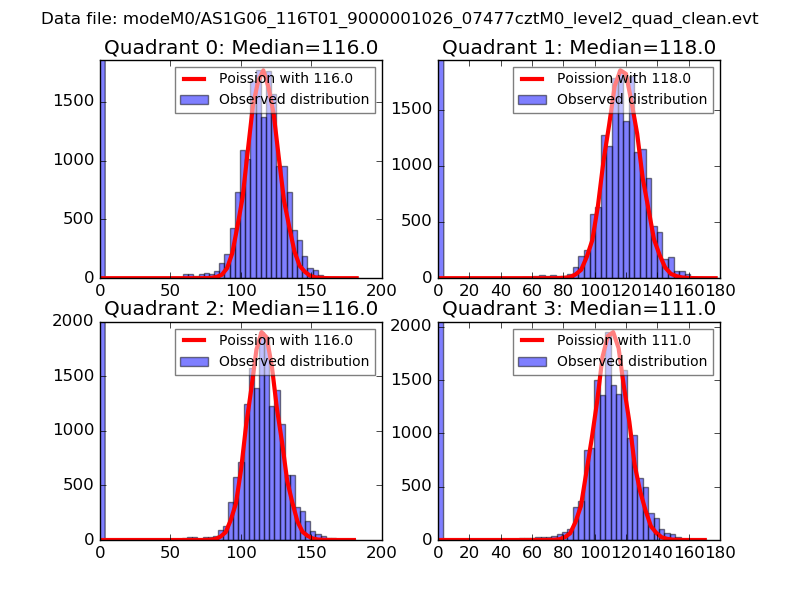 |
 |
| Quadrant-wise count rates Data is divided into 100 sec bins |
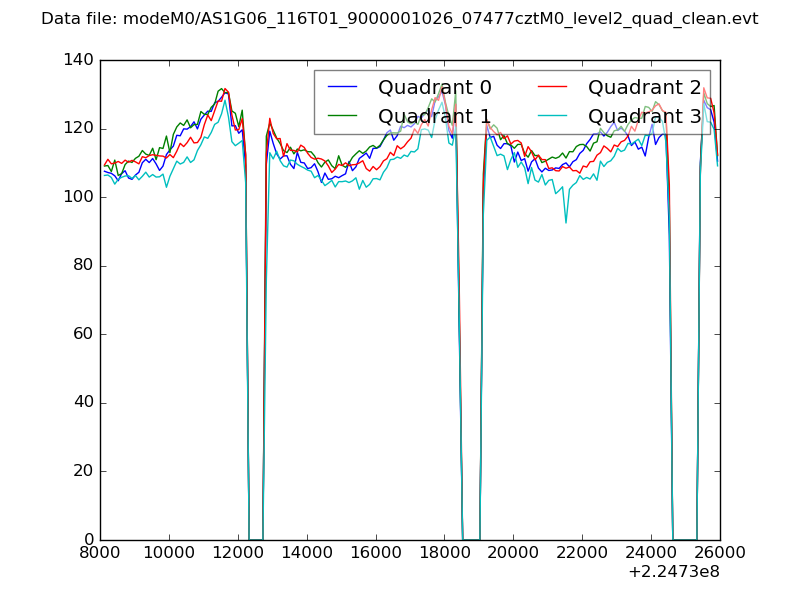 |
|
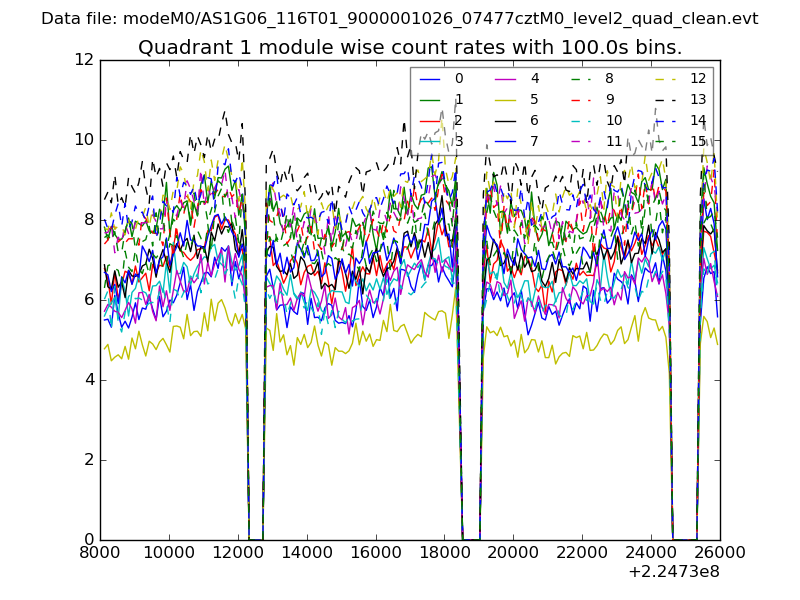
| Module-wise count rates for Quadrant A Data is divided into 100 sec bins |
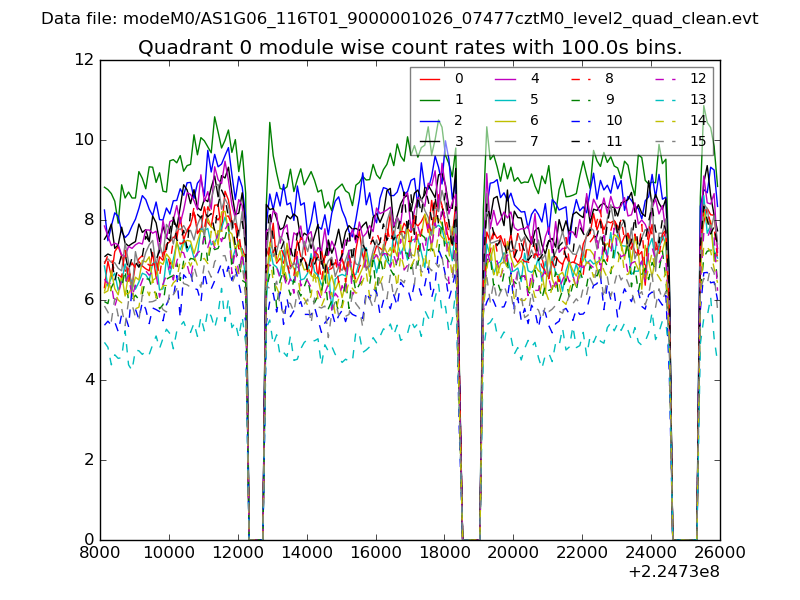 |
 |
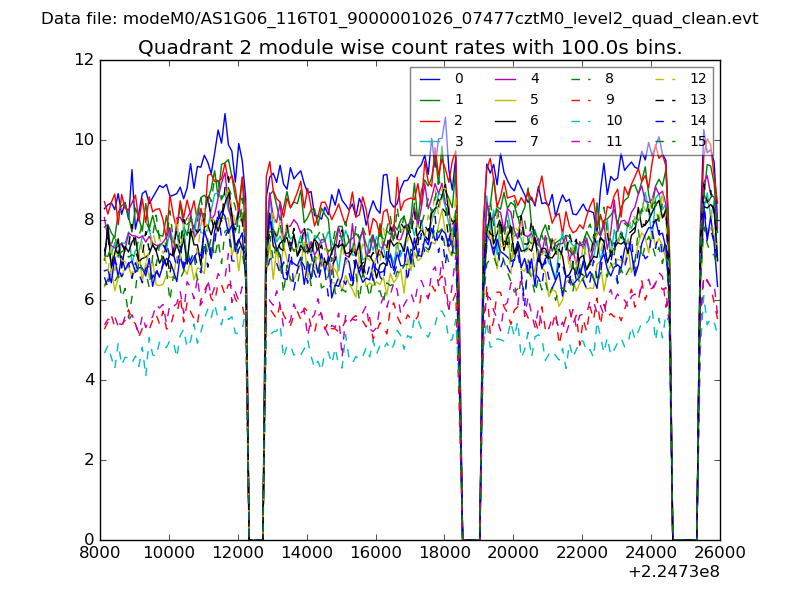
| Module-wise count rates for Quadrant B Data is divided into 100 sec bins |
 |
 |
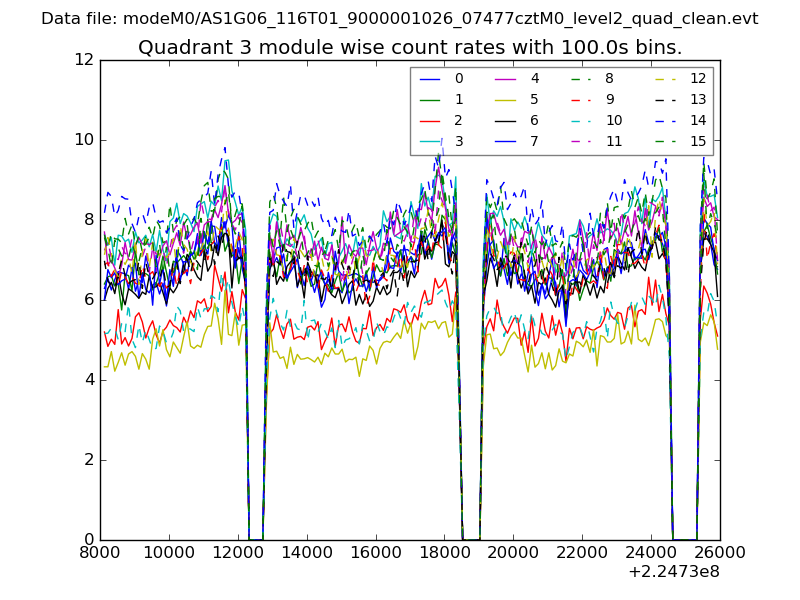
| Module-wise count rates for Quadrant C Data is divided into 100 sec bins |
 |
 |
| Module-wise count rates for Quadrant D Data is divided into 100 sec bins |
 |
 |
| Parameter | Plot |
|---|---|
| CZT HV Monitor | 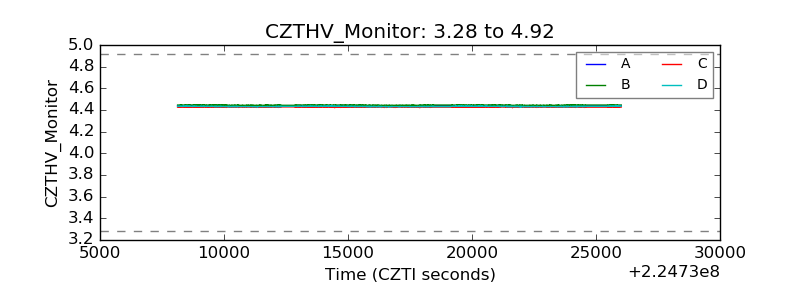 |
| D_VDD | 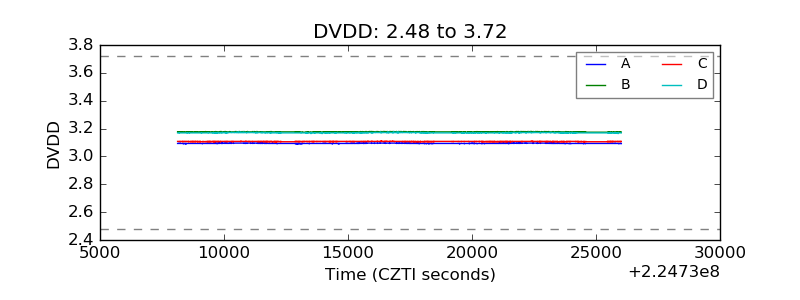 |
| Temperature 1 |  |
| Veto HV Monitor | 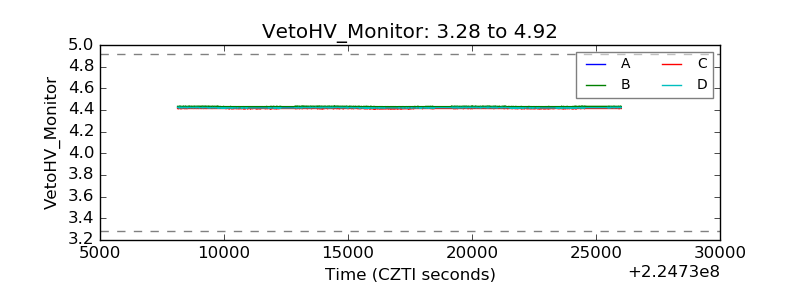 |
| Veto LLD | 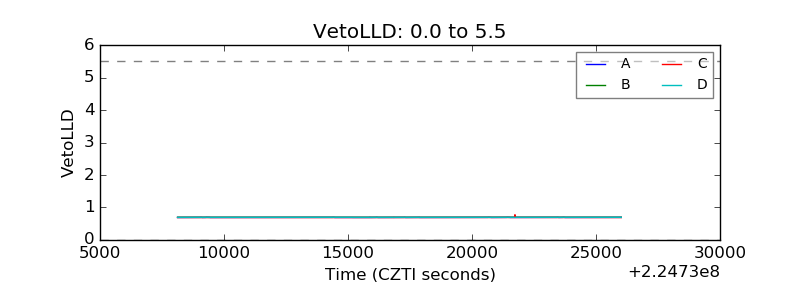 |
| Alpha Counter | 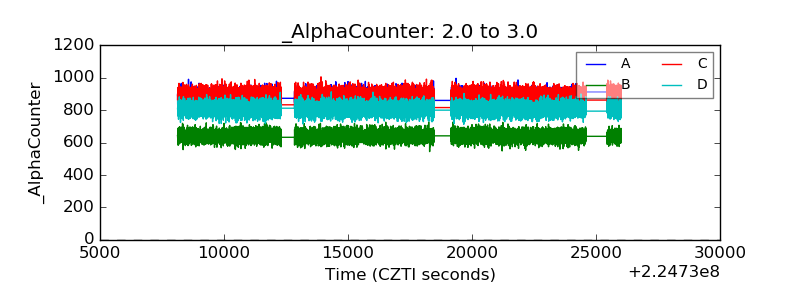 |
| _CPM_Rate | 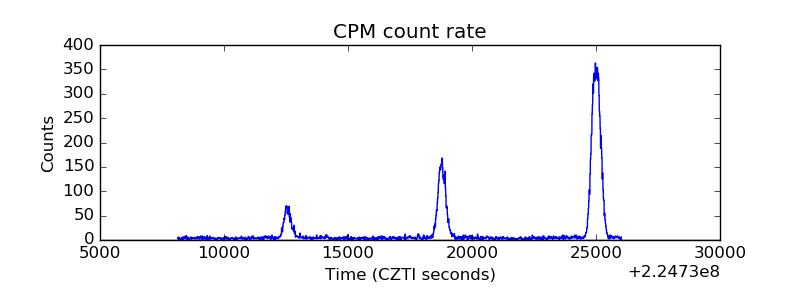 |
| CZT Counter |  |
| +2.5 Volts monitor |  |
| +5 Volts monitor |  |
| _ROLL_ROT | 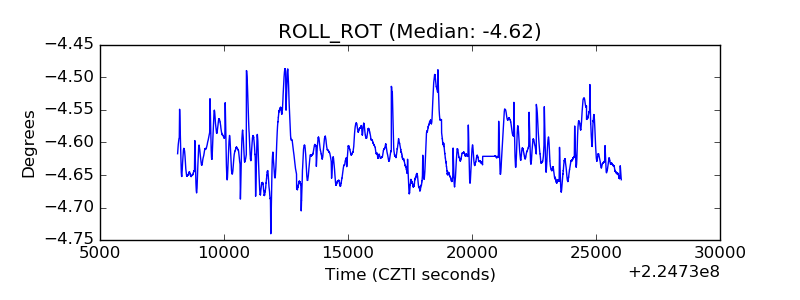 |
| _Roll_DEC | 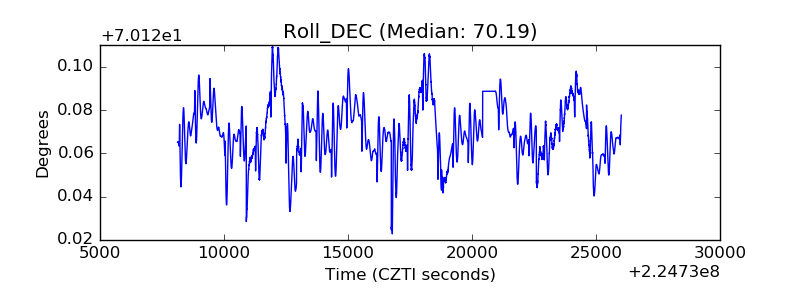 |
| _Roll_RA | 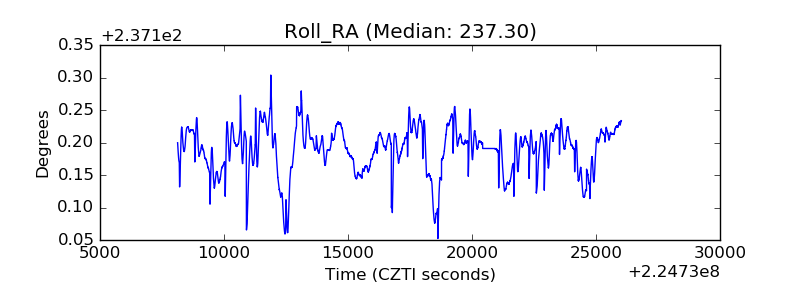 |
| Veto Counter | 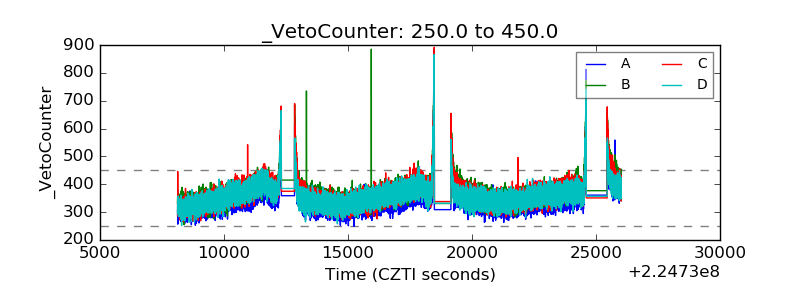 |