| Param | Original file | Final file |
|---|---|---|
| Filename | modeM0/AS1A02_058T02_9000001030cztM0_level2.fits | modeM0/AS1A02_058T02_9000001030cztM0_level2_quad_clean.evt |
| Size (bytes) | 107,426,880 | 109,494,720 |
| Size | 102.5 MB | 104.4 MB |
| Events in quadrant A | 644,746 | 655,258 |
| Events in quadrant B | 634,346 | 666,158 |
| Events in quadrant C | 651,858 | 642,653 |
| Events in quadrant D | 559,658 | 588,468 |
| Mode SS | |||
|---|---|---|---|
| Quadrant | BADHDUFLAG | Total packets | Discarded packets |
| A | 0 | 224 | 0 |
| B | 0 | 224 | 0 |
| C | 0 | 224 | 0 |
| D | 0 | 224 | 0 |
| Mode M0 | |||
|---|---|---|---|
| Quadrant | BADHDUFLAG | Total packets | Discarded packets |
| A | 0 | 23201 | 0 |
| B | 0 | 23642 | 0 |
| C | 0 | 22964 | 0 |
| D | 0 | 25289 | 0 |
| Mode M9 | |||
|---|---|---|---|
| Quadrant | BADHDUFLAG | Total packets | Discarded packets |
| A | 0 | 25 | 0 |
| B | 0 | 25 | 0 |
| C | 0 | 25 | 0 |
| D | 0 | 25 | 0 |
| Quadrant | Total seconds | Saturated seconds | Saturation percentage |
|---|---|---|---|
| A | 11024 | 160 | 1.451379% |
| B | 11024 | 196 | 1.777939% |
| C | 11024 | 126 | 1.142961% |
| D | 11024 | 259 | 2.349419% |
Noise dominated data is calculated using 1-second bins in cleaned event files. If a bin has >2000 counts, and if more than 50% of those come from <1% of pixels, then it is considered to be noise-dominated and hence unusable.
| Quadrant | # 1 sec bins | Bins with >0 counts | Bins with >2000 counts | High rate bins dominated by noise | Noise dominated (total time) | Noise dominated (detector-on time) | Marked lightcurve |
|---|---|---|---|---|---|---|---|
| A | 13494 | 11023 | 0 | 0 | 0.00% | 0.00% |  |
| B | 13494 | 11023 | 0 | 0 | 0.00% | 0.00% |  |
| C | 13494 | 11024 | 0 | 0 | 0.00% | 0.00% |  |
| D | 13494 | 11021 | 0 | 0 | 0.00% | 0.00% |  |
Top three noisy pixels from each quadrant. If the there are fewer than three noisy pixels in the level2.evt file, extra rows are filled as -1
| Pixel properties | Quadrant properties | ||||||
|---|---|---|---|---|---|---|---|
| Quadrant | DetID | PixID | Counts | Sigma | Mean | Median | Sigma |
| A | 0 | 29 | 656 | 11.43 | 168 | 158 | 43.6 |
| A | 7 | 110 | 576 | 9.59 | 168 | 158 | 43.6 |
| A | 0 | 28 | 468 | 7.12 | 168 | 158 | 43.6 |
| B | 2 | 9 | 521 | 10.0 | 167 | 159 | 36.2 |
| B | 3 | 17 | 452 | 8.1 | 167 | 159 | 36.2 |
| B | 12 | 226 | 427 | 7.41 | 167 | 159 | 36.2 |
| C | 1 | 65 | 452 | 6.33 | 172 | 161 | 45.9 |
| C | 12 | 241 | 448 | 6.25 | 172 | 161 | 45.9 |
| C | 7 | 111 | 446 | 6.2 | 172 | 161 | 45.9 |
| D | 3 | 14 | 424 | 6.34 | 159 | 145 | 44.0 |
| D | 10 | 189 | 418 | 6.2 | 159 | 145 | 44.0 |
| D | 1 | 3 | 410 | 6.02 | 159 | 145 | 44.0 |
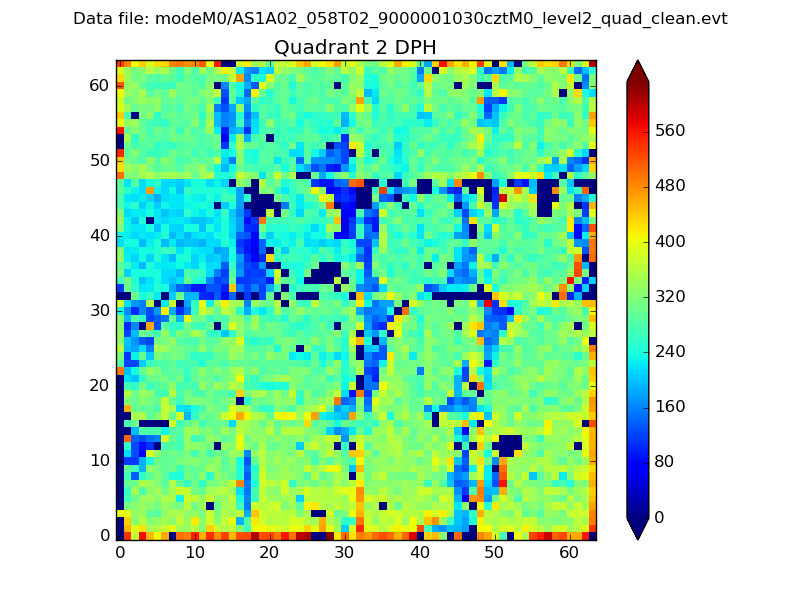
Histogram calculated using DETX and DETY for each event in the final _common_clean file
| Quadrant A |  |
 |
Quadrant B |
|---|---|---|---|
| Quadrant D | 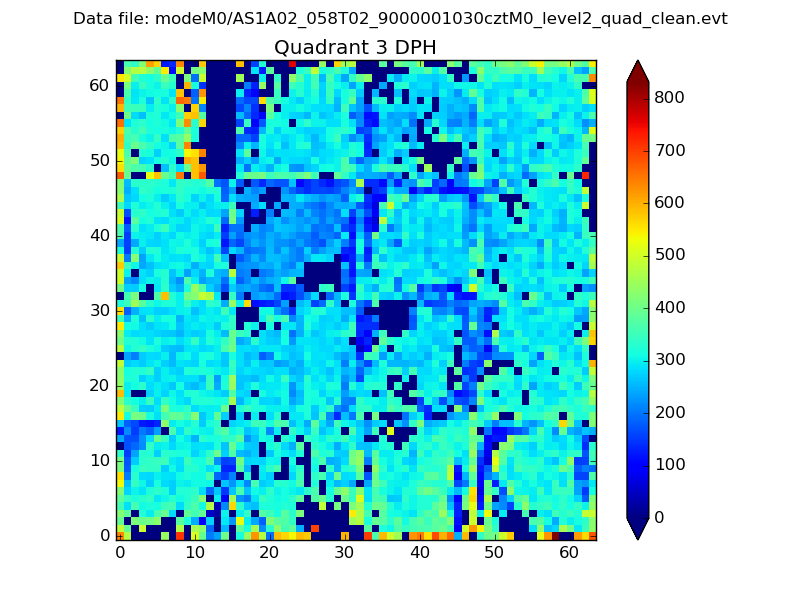 |
 |
Quadrant C |
| Plot type | Count rate plots | Images |
|---|---|---|
| Comparison with Poisson distribution Blue bars denote a histogram of data divided into 1 sec bins. Red curve is a Poisson curve with rate = median count rate of data. |
 |
 |
| Quadrant-wise count rates Data is divided into 100 sec bins |
 |
|
| Module-wise count rates for Quadrant A Data is divided into 100 sec bins |
 |
 |
| Module-wise count rates for Quadrant B Data is divided into 100 sec bins |
 |
 |
| Module-wise count rates for Quadrant C Data is divided into 100 sec bins |
 |
 |
| Module-wise count rates for Quadrant D Data is divided into 100 sec bins |
 |
 |
| Parameter | Plot |
|---|---|
| CZT HV Monitor |  |
| D_VDD |  |
| Temperature 1 |  |
| Veto HV Monitor |  |
| Veto LLD |  |
| Alpha Counter |  |
| _CPM_Rate |  |
| CZT Counter |  |
| +2.5 Volts monitor |  |
| +5 Volts monitor |  |
| _ROLL_ROT |  |
| _Roll_DEC |  |
| _Roll_RA |  |
| Veto Counter |  |