| Param | Original file | Final file |
|---|---|---|
| Filename | modeM0/AS1A02_058T02_9000001030_07485cztM0_level2.evt | modeM0/AS1A02_058T02_9000001030_07485cztM0_level2_quad_clean.evt |
| Size (bytes) | 264,991,680 | 54,034,560 |
| Size | 252.7 MB | 51.5 MB |
| Events in quadrant A | 1,874,831 | 341,215 |
| Events in quadrant B | 1,920,272 | 347,586 |
| Events in quadrant C | 1,821,400 | 345,677 |
| Events in quadrant D | 2,144,244 | 328,491 |
| Mode SS | |||
|---|---|---|---|
| Quadrant | BADHDUFLAG | Total packets | Discarded packets |
| A | 0 | 78 | 0 |
| B | 0 | 78 | 0 |
| C | 0 | 78 | 0 |
| D | 0 | 78 | 0 |
| Mode M0 | |||
|---|---|---|---|
| Quadrant | BADHDUFLAG | Total packets | Discarded packets |
| A | 0 | 8330 | 1 |
| B | 0 | 8388 | 1 |
| C | 0 | 8145 | 1 |
| D | 0 | 9269 | 1 |
| Mode M9 | |||
|---|---|---|---|
| Quadrant | BADHDUFLAG | Total packets | Discarded packets |
| A | 0 | 13 | 0 |
| B | 0 | 13 | 0 |
| C | 0 | 13 | 0 |
| D | 0 | 13 | 0 |
| Quadrant | Total seconds | Saturated seconds | Saturation percentage |
|---|---|---|---|
| A | 3872 | 61 | 1.575413% |
| B | 3872 | 78 | 2.014463% |
| C | 3872 | 38 | 0.981405% |
| D | 3872 | 120 | 3.099174% |
Noise dominated data is calculated using 1-second bins in cleaned event files. If a bin has >2000 counts, and if more than 50% of those come from <1% of pixels, then it is considered to be noise-dominated and hence unusable.
| Quadrant | # 1 sec bins | Bins with >0 counts | Bins with >2000 counts | High rate bins dominated by noise | Noise dominated (total time) | Noise dominated (detector-on time) | Marked lightcurve |
|---|---|---|---|---|---|---|---|
| A | 5082 | 3873 | 1 | 1 | 0.02% | 0.03% | 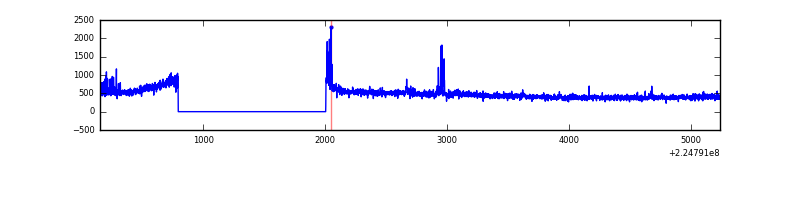 |
| B | 5082 | 3873 | 1 | 1 | 0.02% | 0.03% | 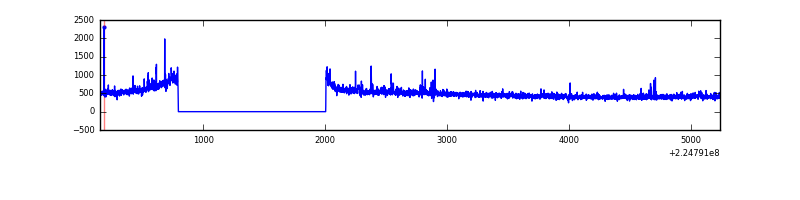 |
| C | 5082 | 3873 | 1 | 1 | 0.02% | 0.03% | 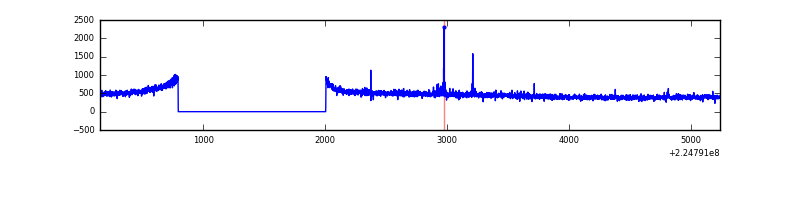 |
| D | 5082 | 3873 | 51 | 51 | 1.00% | 1.32% | 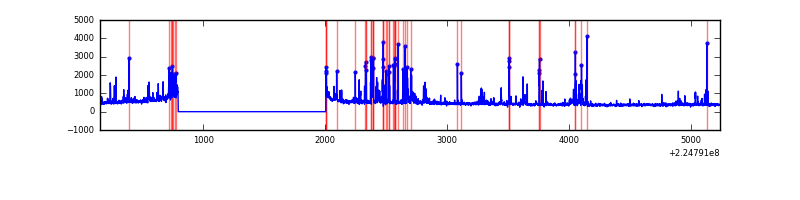 |
Top three noisy pixels from each quadrant. If the there are fewer than three noisy pixels in the level2.evt file, extra rows are filled as -1
| Pixel properties | Quadrant properties | ||||||
|---|---|---|---|---|---|---|---|
| Quadrant | DetID | PixID | Counts | Sigma | Mean | Median | Sigma |
| A | 15 | 234 | 44010 | 451.58 | 467 | 457 | 96.4 |
| A | 15 | 239 | 14550 | 146.12 | 467 | 457 | 96.4 |
| A | 0 | 23 | 9697 | 95.81 | 467 | 457 | 96.4 |
| B | 4 | 173 | 33446 | 356.83 | 475 | 465 | 92.4 |
| B | 0 | 214 | 30110 | 320.73 | 475 | 465 | 92.4 |
| B | 4 | 81 | 11640 | 120.9 | 475 | 465 | 92.4 |
| C | 1 | 16 | 16617 | 148.42 | 462 | 465 | 108.8 |
| C | 13 | 61 | 3624 | 29.03 | 462 | 465 | 108.8 |
| C | 8 | 222 | 2832 | 21.75 | 462 | 465 | 108.8 |
| D | 2 | 152 | 172311 | 1519.68 | 453 | 439 | 113.1 |
| D | 2 | 136 | 76346 | 671.16 | 453 | 439 | 113.1 |
| D | 2 | 14 | 63165 | 554.62 | 453 | 439 | 113.1 |
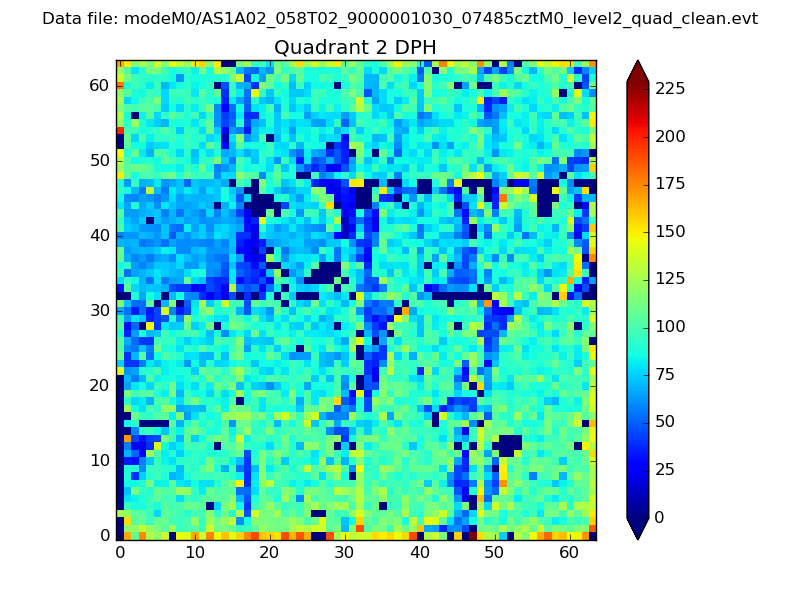
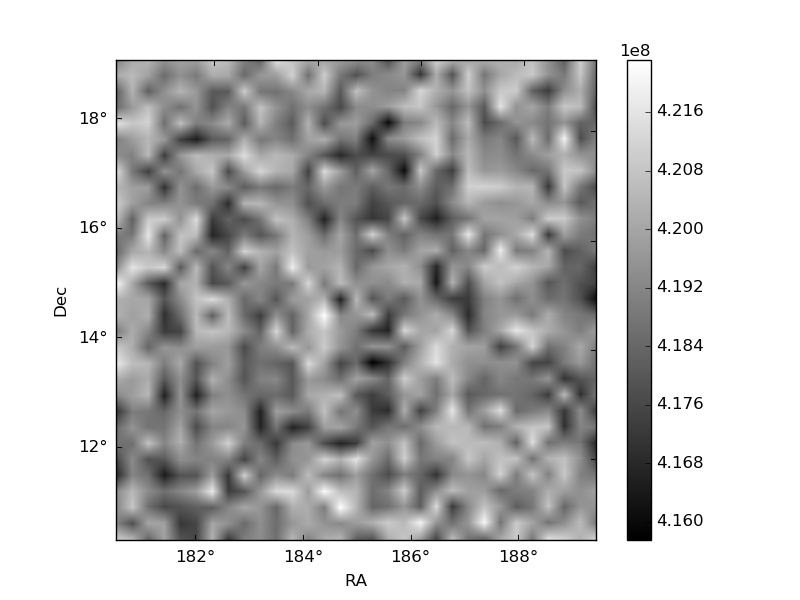
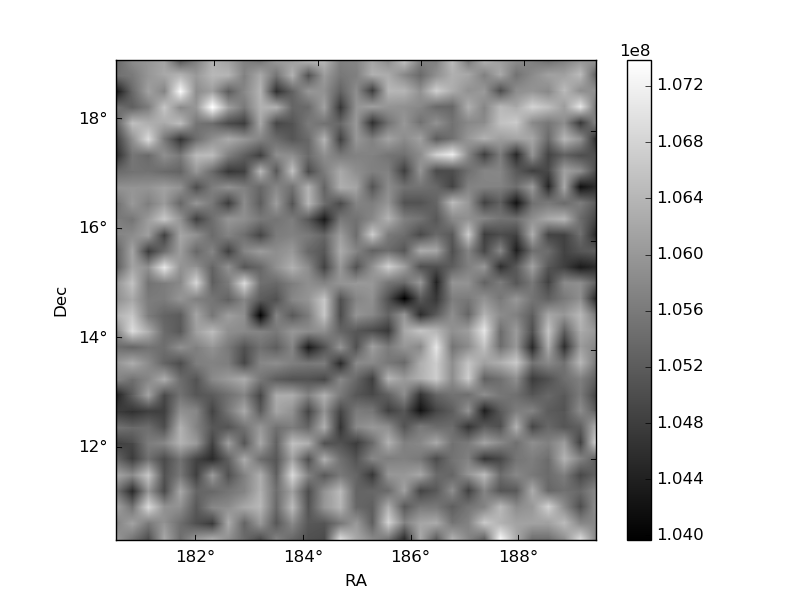
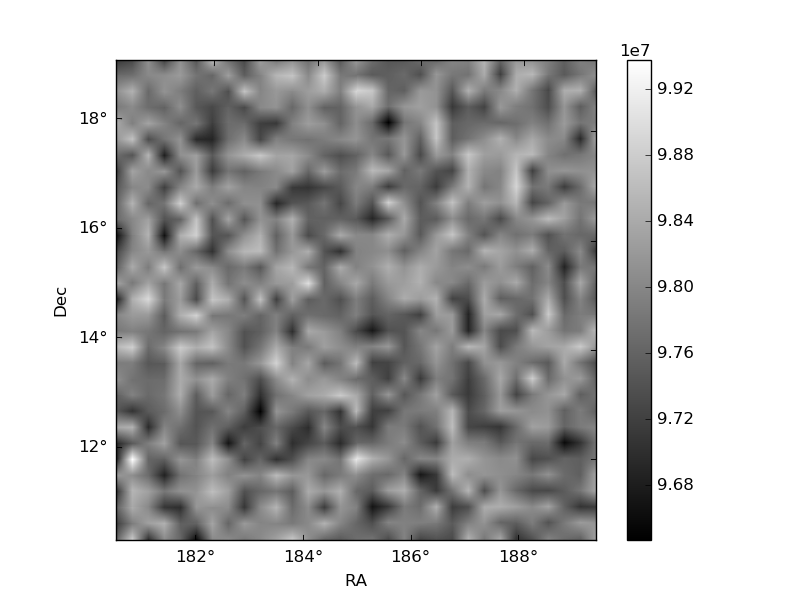
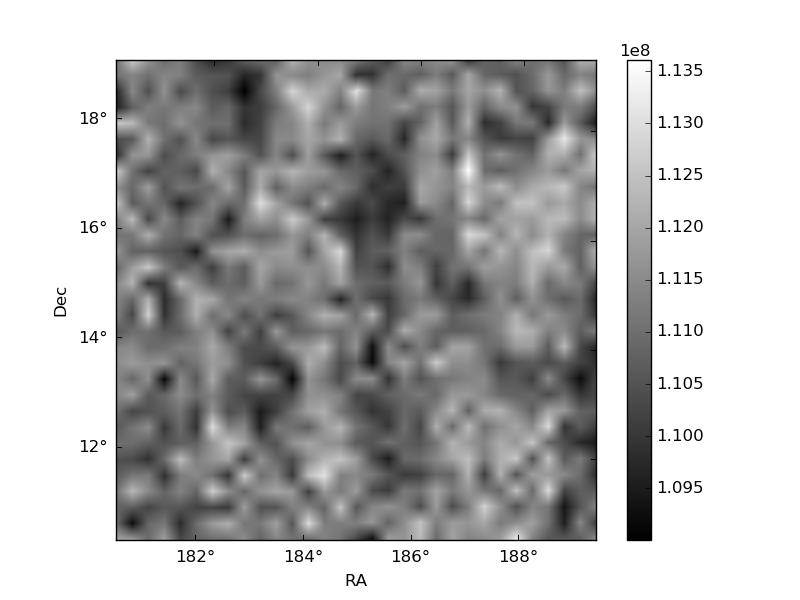
Histogram calculated using DETX and DETY for each event in the final _common_clean file
| Quadrant A | 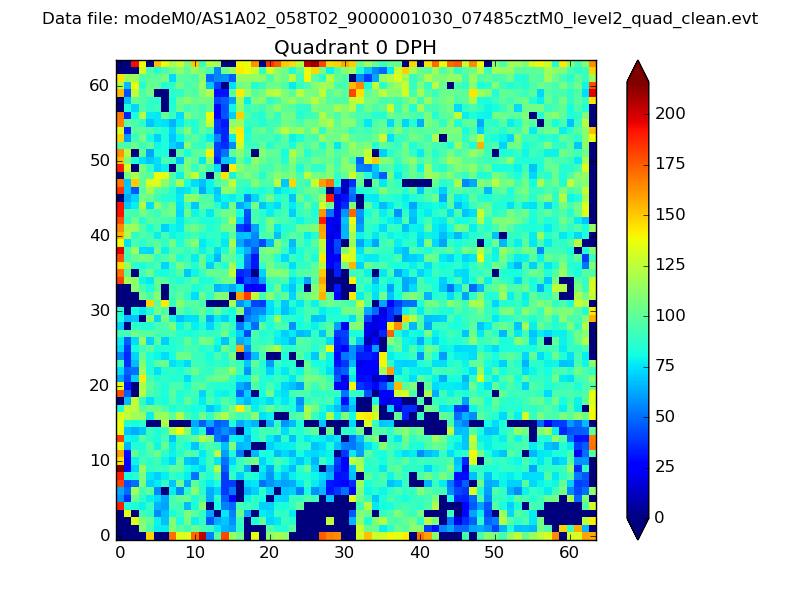 |
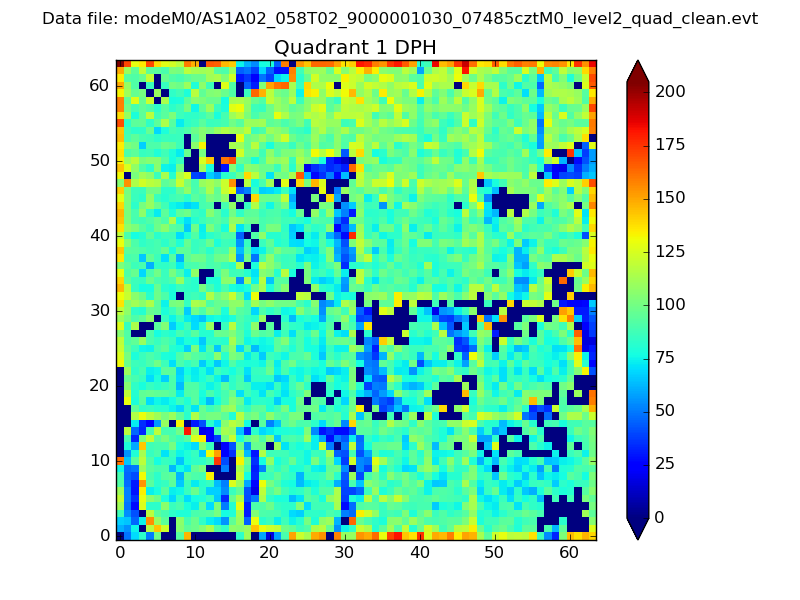 |
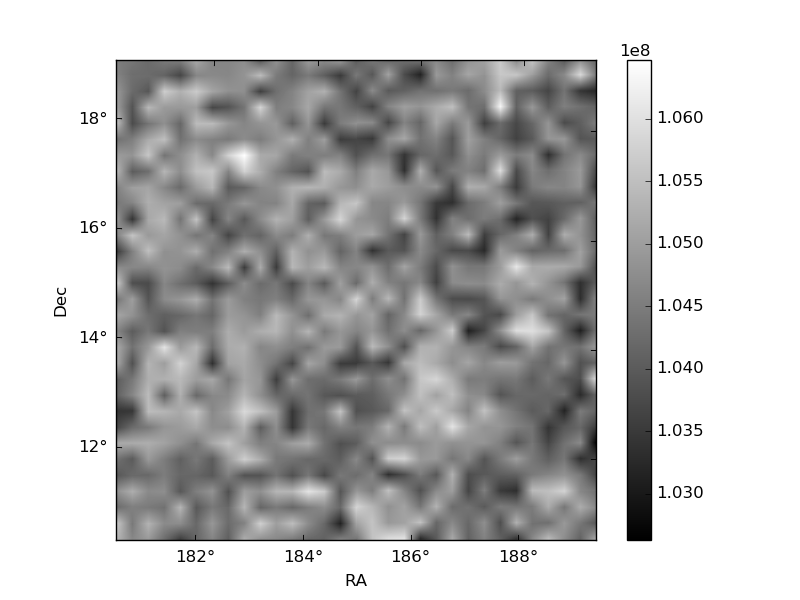
Quadrant B |
|---|---|---|---|
| Quadrant D | 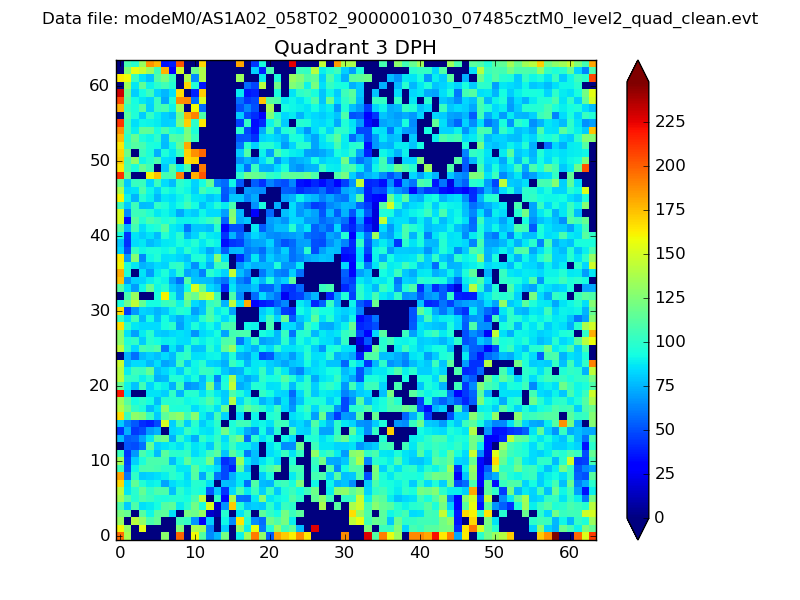 |
 |
Quadrant C |
| Plot type | Count rate plots | Images |
|---|---|---|
| Comparison with Poisson distribution Blue bars denote a histogram of data divided into 1 sec bins. Red curve is a Poisson curve with rate = median count rate of data. |
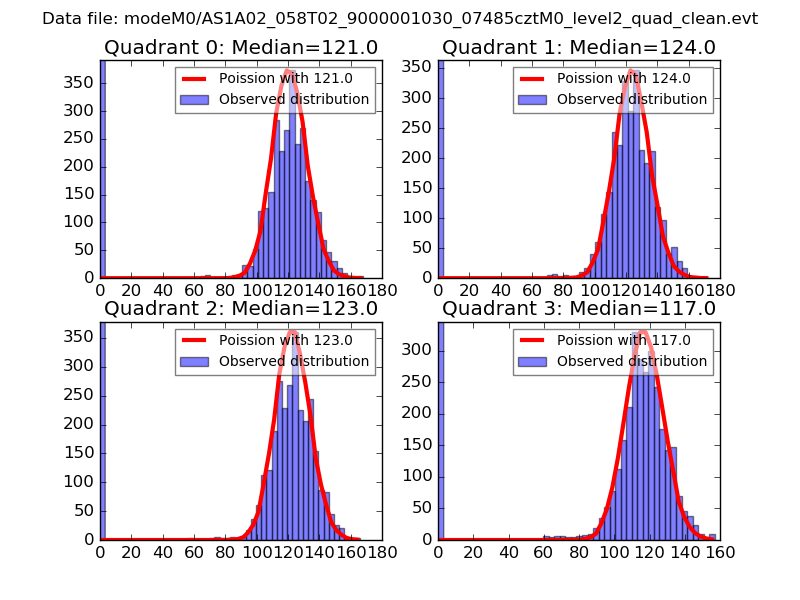 |
 |
| Quadrant-wise count rates Data is divided into 100 sec bins |
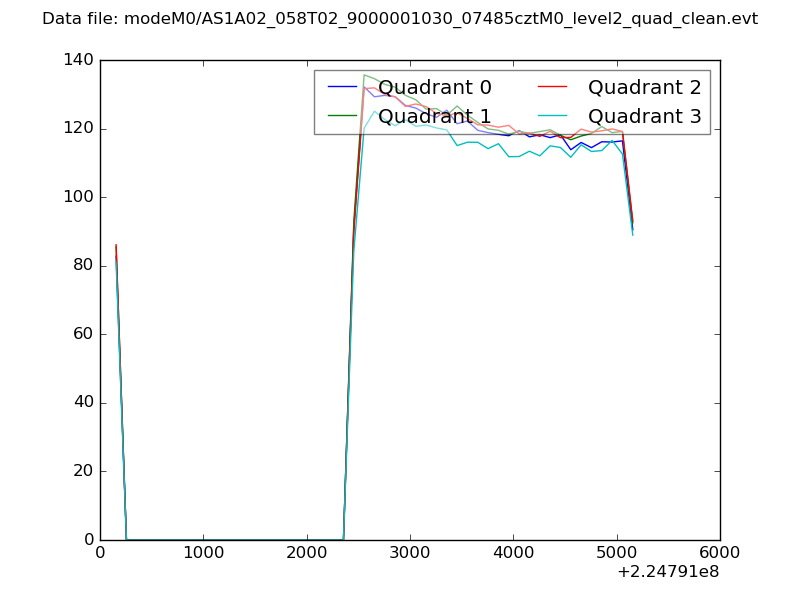 |
|
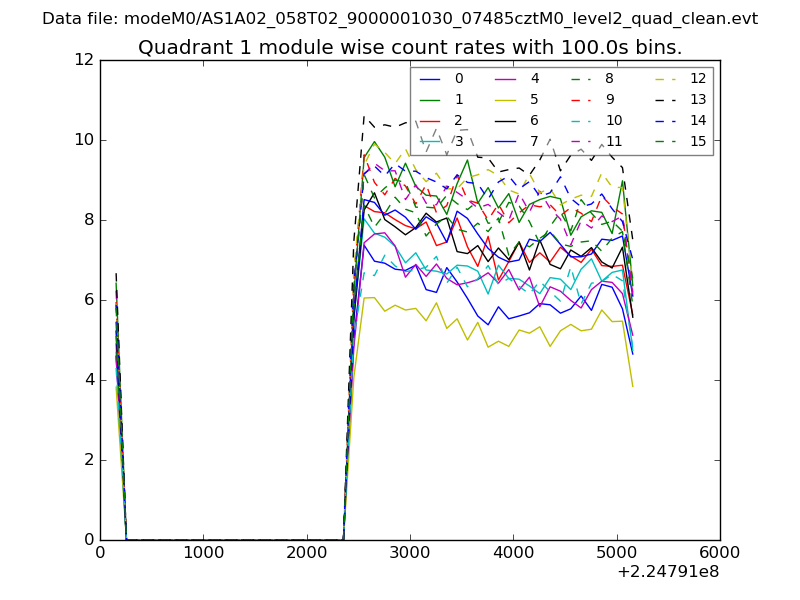
| Module-wise count rates for Quadrant A Data is divided into 100 sec bins |
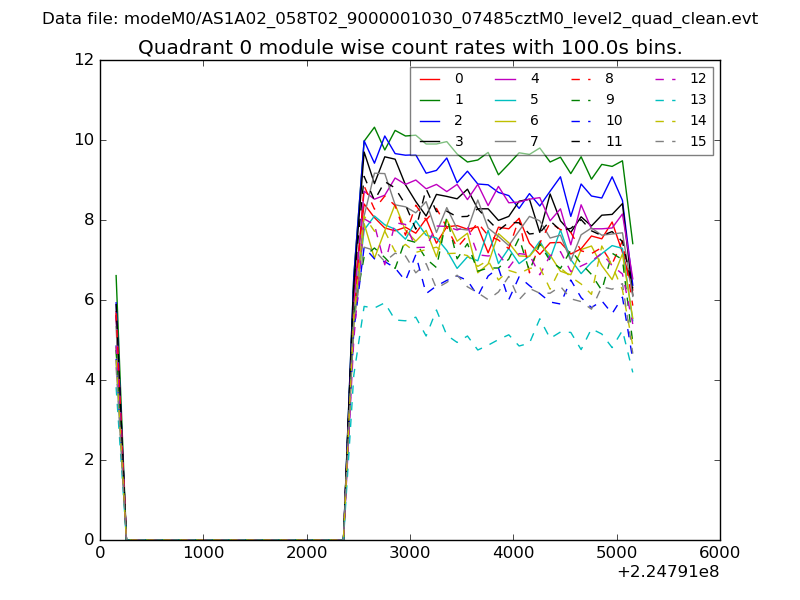 |
 |
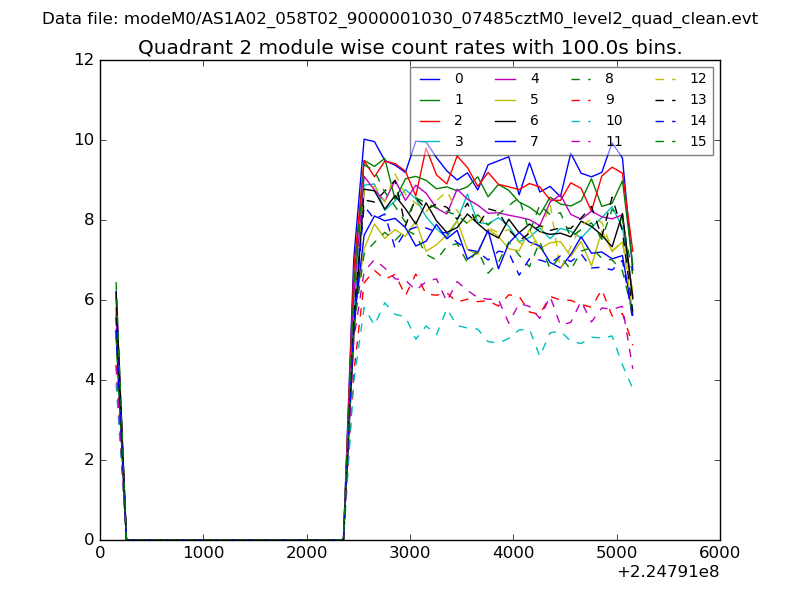
| Module-wise count rates for Quadrant B Data is divided into 100 sec bins |
 |
 |
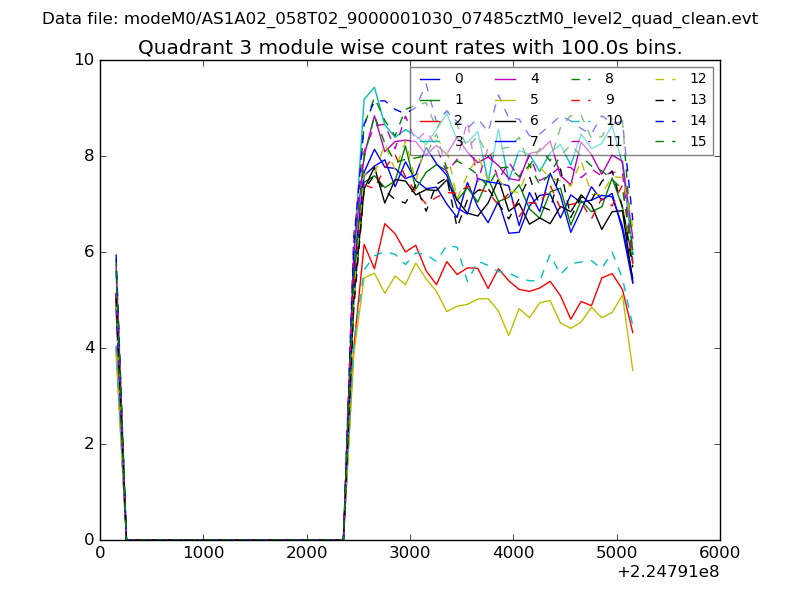
| Module-wise count rates for Quadrant C Data is divided into 100 sec bins |
 |
 |
| Module-wise count rates for Quadrant D Data is divided into 100 sec bins |
 |
 |
| Parameter | Plot |
|---|---|
| CZT HV Monitor | 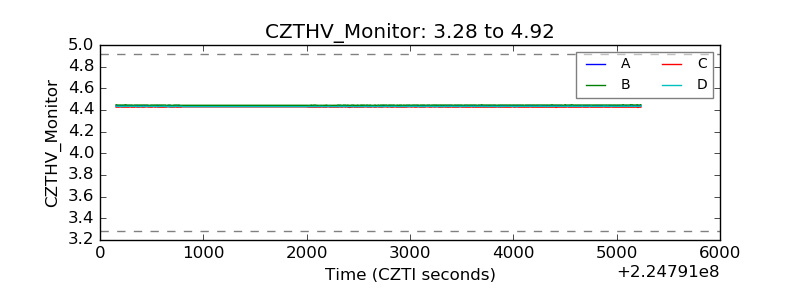 |
| D_VDD | 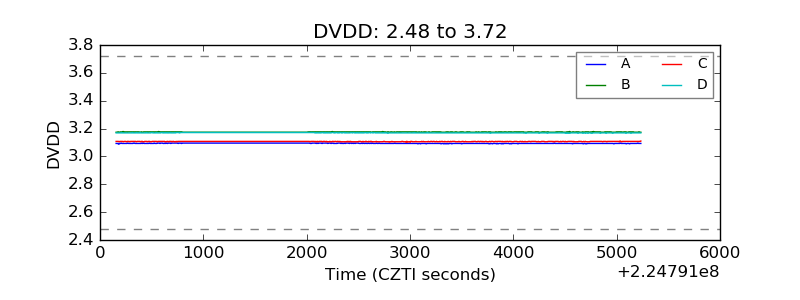 |
| Temperature 1 | 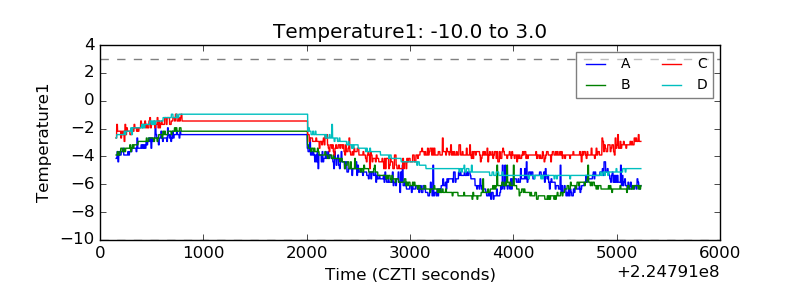 |
| Veto HV Monitor | 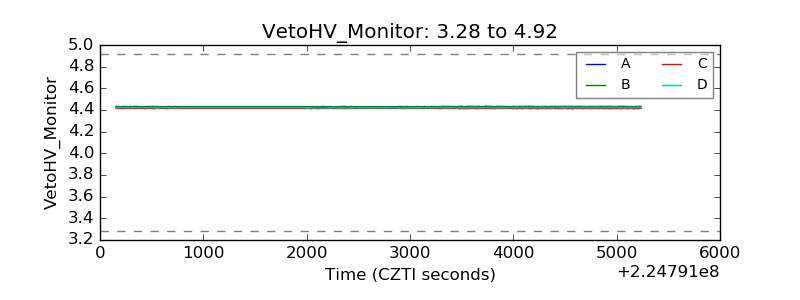 |
| Veto LLD | 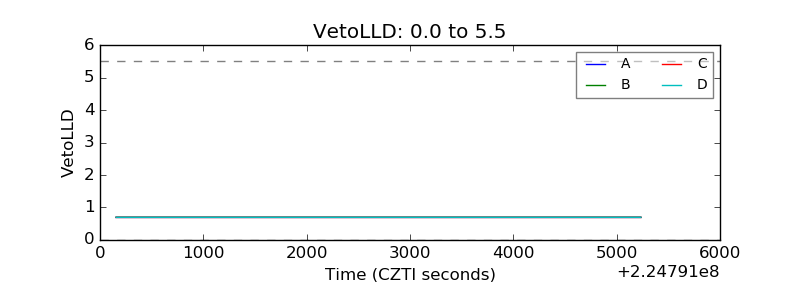 |
| Alpha Counter | 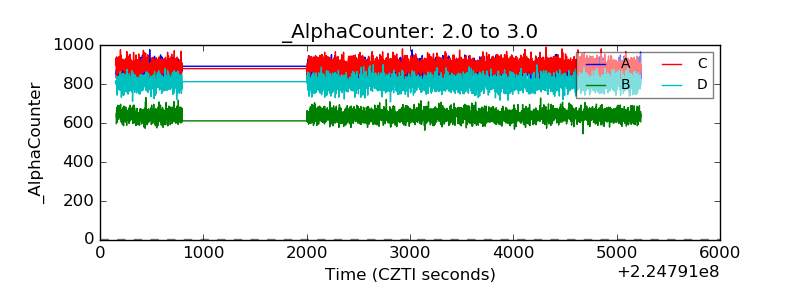 |
| _CPM_Rate | 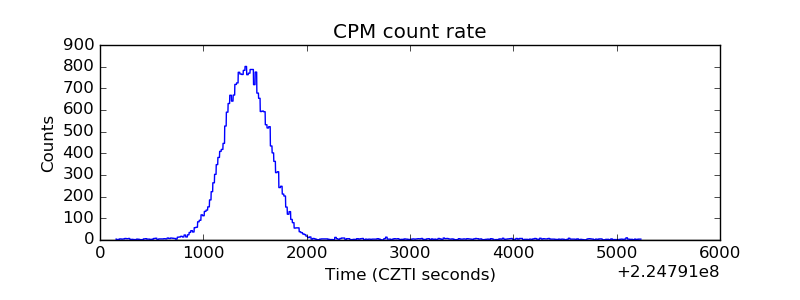 |
| CZT Counter | 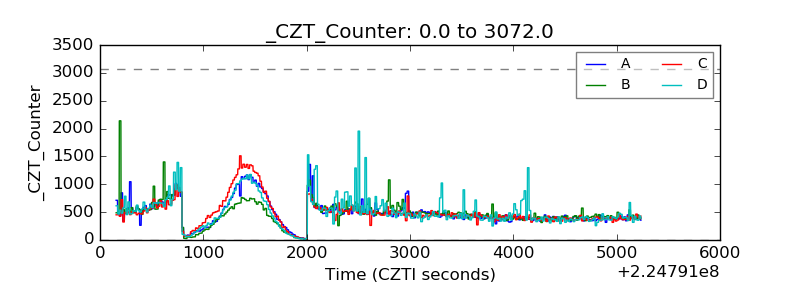 |
| +2.5 Volts monitor | 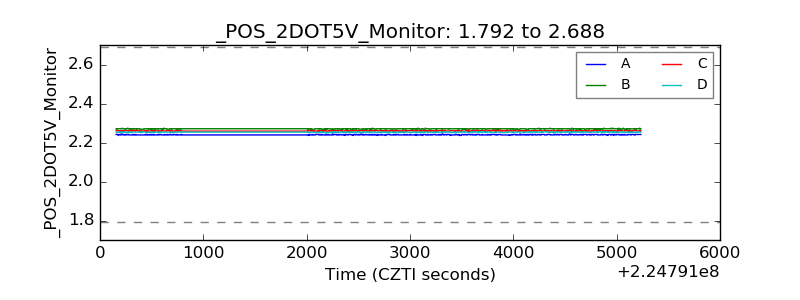 |
| +5 Volts monitor |  |
| _ROLL_ROT | 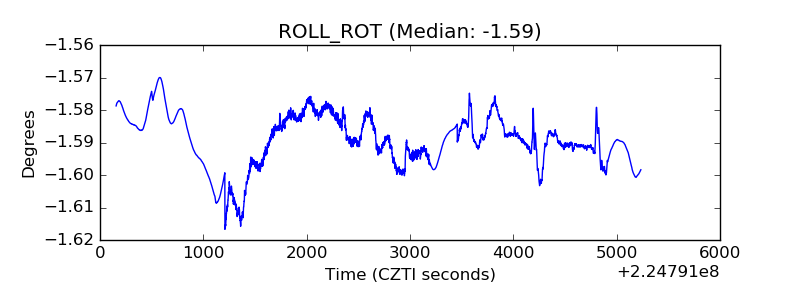 |
| _Roll_DEC | 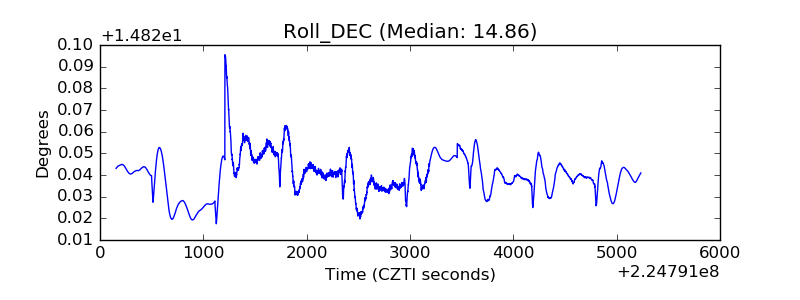 |
| _Roll_RA | 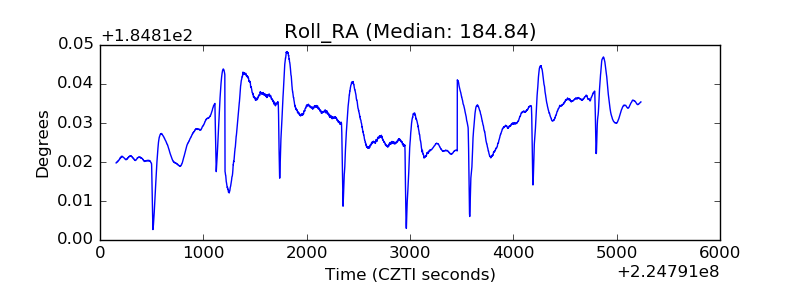 |
| Veto Counter | 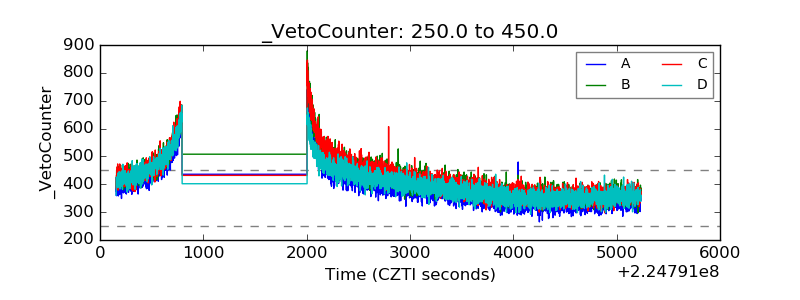 |