| Param | Original file | Final file |
|---|---|---|
| Filename | modeM0/AS1A02_165T03_9000001032cztM0_level2.fits | modeM0/AS1A02_165T03_9000001032cztM0_level2_quad_clean.evt |
| Size (bytes) | 142,704,000 | 141,523,200 |
| Size | 136.1 MB | 135.0 MB |
| Events in quadrant A | 845,186 | 820,408 |
| Events in quadrant B | 823,096 | 829,789 |
| Events in quadrant C | 846,718 | 811,338 |
| Events in quadrant D | 725,454 | 742,590 |
| Mode M9 | |||
|---|---|---|---|
| Quadrant | BADHDUFLAG | Total packets | Discarded packets |
| A | 0 | 19 | 0 |
| B | 0 | 19 | 0 |
| C | 0 | 19 | 0 |
| D | 0 | 19 | 0 |
| Mode SS | |||
|---|---|---|---|
| Quadrant | BADHDUFLAG | Total packets | Discarded packets |
| A | 0 | 322 | 0 |
| B | 0 | 322 | 0 |
| C | 0 | 322 | 0 |
| D | 0 | 322 | 0 |
| Mode M0 | |||
|---|---|---|---|
| Quadrant | BADHDUFLAG | Total packets | Discarded packets |
| A | 0 | 32260 | 0 |
| B | 0 | 33734 | 0 |
| C | 0 | 32267 | 0 |
| D | 0 | 36129 | 0 |
| Quadrant | Total seconds | Saturated seconds | Saturation percentage |
|---|---|---|---|
| A | 15673 | 86 | 0.548714% |
| B | 15673 | 266 | 1.697186% |
| C | 15673 | 86 | 0.548714% |
| D | 15673 | 343 | 2.188477% |
Noise dominated data is calculated using 1-second bins in cleaned event files. If a bin has >2000 counts, and if more than 50% of those come from <1% of pixels, then it is considered to be noise-dominated and hence unusable.
| Quadrant | # 1 sec bins | Bins with >0 counts | Bins with >2000 counts | High rate bins dominated by noise | Noise dominated (total time) | Noise dominated (detector-on time) | Marked lightcurve |
|---|---|---|---|---|---|---|---|
| A | 17538 | 15673 | 0 | 0 | 0.00% | 0.00% |  |
| B | 17538 | 15673 | 0 | 0 | 0.00% | 0.00% |  |
| C | 17538 | 15673 | 0 | 0 | 0.00% | 0.00% | 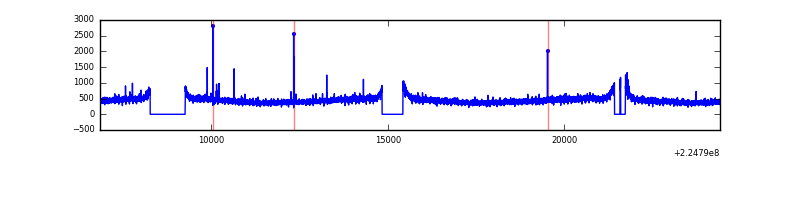 |
| D | 17538 | 15674 | 0 | 0 | 0.00% | 0.00% |  |
Top three noisy pixels from each quadrant. If the there are fewer than three noisy pixels in the level2.evt file, extra rows are filled as -1
| Pixel properties | Quadrant properties | ||||||
|---|---|---|---|---|---|---|---|
| Quadrant | DetID | PixID | Counts | Sigma | Mean | Median | Sigma |
| A | 0 | 29 | 862 | 11.22 | 220 | 205 | 58.5 |
| A | 7 | 110 | 697 | 8.4 | 220 | 205 | 58.5 |
| A | 0 | 30 | 682 | 8.15 | 220 | 205 | 58.5 |
| B | 2 | 9 | 723 | 11.2 | 216 | 205 | 46.3 |
| B | 14 | 254 | 558 | 7.63 | 216 | 205 | 46.3 |
| B | 5 | 232 | 554 | 7.54 | 216 | 205 | 46.3 |
| C | 1 | 80 | 643 | 7.04 | 223 | 206 | 62.1 |
| C | 12 | 241 | 635 | 6.91 | 223 | 206 | 62.1 |
| C | 1 | 81 | 595 | 6.27 | 223 | 206 | 62.1 |
| D | 10 | 189 | 537 | 6.07 | 206 | 186 | 57.8 |
| D | 6 | 231 | 524 | 5.85 | 206 | 186 | 57.8 |
| D | 1 | 19 | 519 | 5.76 | 206 | 186 | 57.8 |
Histogram calculated using DETX and DETY for each event in the final _common_clean file
| Quadrant A | 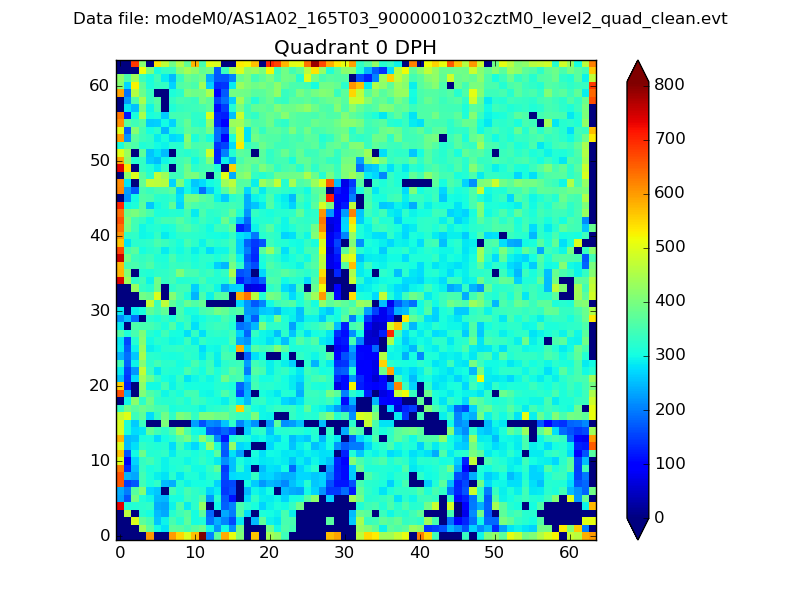 |
 |
Quadrant B |
|---|---|---|---|
| Quadrant D |  |
 |
Quadrant C |
| Plot type | Count rate plots | Images |
|---|---|---|
| Comparison with Poisson distribution Blue bars denote a histogram of data divided into 1 sec bins. Red curve is a Poisson curve with rate = median count rate of data. |
 |
 |
| Quadrant-wise count rates Data is divided into 100 sec bins |
 |
|
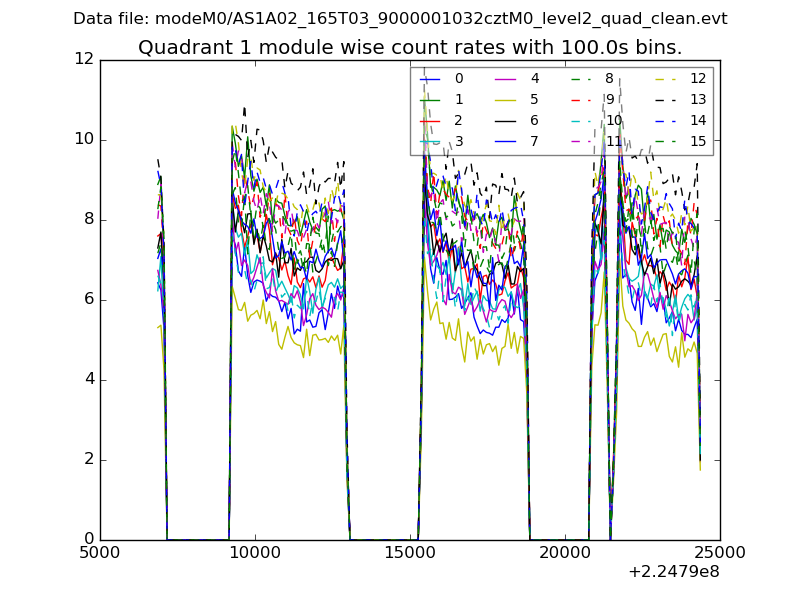
| Module-wise count rates for Quadrant A Data is divided into 100 sec bins |
 |
 |
| Module-wise count rates for Quadrant B Data is divided into 100 sec bins |
 |
 |
| Module-wise count rates for Quadrant C Data is divided into 100 sec bins |
 |
 |
| Module-wise count rates for Quadrant D Data is divided into 100 sec bins |
 |
 |
| Parameter | Plot |
|---|---|
| CZT HV Monitor |  |
| D_VDD |  |
| Temperature 1 |  |
| Veto HV Monitor |  |
| Veto LLD |  |
| Alpha Counter |  |
| _CPM_Rate |  |
| CZT Counter |  |
| +2.5 Volts monitor |  |
| +5 Volts monitor |  |
| _ROLL_ROT |  |
| _Roll_DEC |  |
| _Roll_RA |  |
| Veto Counter |  |