| Param | Original file | Final file |
|---|---|---|
| Filename | modeM0/AS1A02_165T03_9000001032_07485cztM0_level2.evt | modeM0/AS1A02_165T03_9000001032_07485cztM0_level2_quad_clean.evt |
| Size (bytes) | 201,916,800 | 32,333,760 |
| Size | 192.6 MB | 30.8 MB |
| Events in quadrant A | 1,334,671 | 197,994 |
| Events in quadrant B | 1,406,851 | 202,797 |
| Events in quadrant C | 1,322,780 | 199,591 |
| Events in quadrant D | 1,863,814 | 183,731 |
| Mode M9 | |||
|---|---|---|---|
| Quadrant | BADHDUFLAG | Total packets | Discarded packets |
| A | 0 | 10 | 0 |
| B | 0 | 10 | 0 |
| C | 0 | 10 | 0 |
| D | 0 | 10 | 0 |
| Mode SS | |||
|---|---|---|---|
| Quadrant | BADHDUFLAG | Total packets | Discarded packets |
| A | 0 | 56 | 0 |
| B | 0 | 56 | 0 |
| C | 0 | 56 | 0 |
| D | 0 | 56 | 0 |
| Mode M0 | |||
|---|---|---|---|
| Quadrant | BADHDUFLAG | Total packets | Discarded packets |
| A | 0 | 5657 | 2 |
| B | 0 | 5892 | 1 |
| C | 0 | 5672 | 1 |
| D | 0 | 7419 | 1 |
| Quadrant | Total seconds | Saturated seconds | Saturation percentage |
|---|---|---|---|
| A | 2719 | 20 | 0.735565% |
| B | 2719 | 50 | 1.838911% |
| C | 2719 | 26 | 0.956234% |
| D | 2719 | 160 | 5.884516% |
Noise dominated data is calculated using 1-second bins in cleaned event files. If a bin has >2000 counts, and if more than 50% of those come from <1% of pixels, then it is considered to be noise-dominated and hence unusable.
| Quadrant | # 1 sec bins | Bins with >0 counts | Bins with >2000 counts | High rate bins dominated by noise | Noise dominated (total time) | Noise dominated (detector-on time) | Marked lightcurve |
|---|---|---|---|---|---|---|---|
| A | 3709 | 2720 | 0 | 0 | 0.00% | 0.00% | 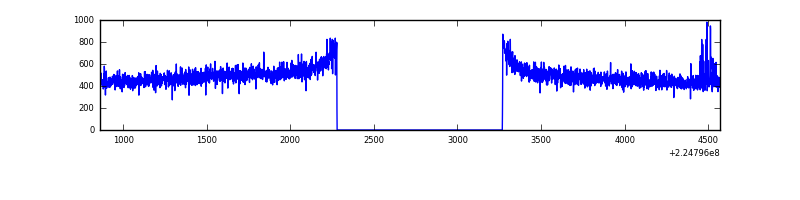 |
| B | 3709 | 2720 | 2 | 2 | 0.05% | 0.07% | 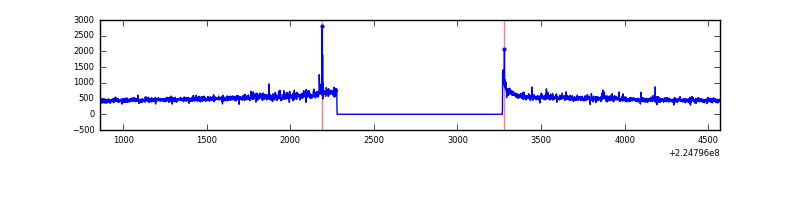 |
| C | 3709 | 2720 | 1 | 1 | 0.03% | 0.04% | 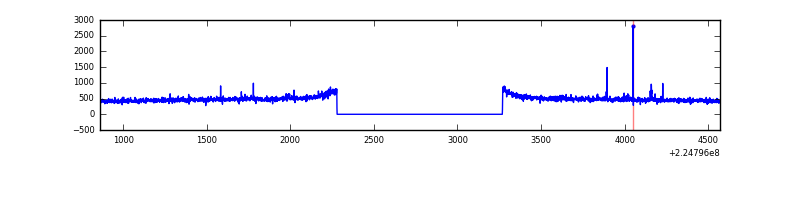 |
| D | 3709 | 2720 | 110 | 110 | 2.97% | 4.04% | 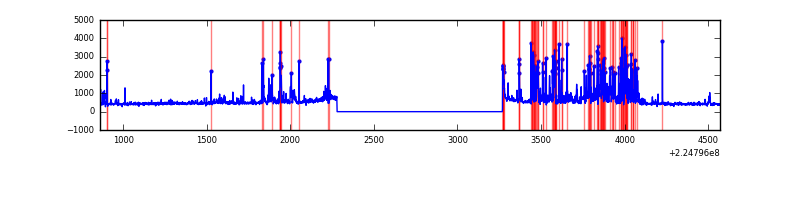 |
Top three noisy pixels from each quadrant. If the there are fewer than three noisy pixels in the level2.evt file, extra rows are filled as -1
| Pixel properties | Quadrant properties | ||||||
|---|---|---|---|---|---|---|---|
| Quadrant | DetID | PixID | Counts | Sigma | Mean | Median | Sigma |
| A | 15 | 239 | 11519 | 155.63 | 343 | 334 | 71.9 |
| A | 0 | 226 | 3185 | 39.67 | 343 | 334 | 71.9 |
| A | 12 | 194 | 3097 | 38.44 | 343 | 334 | 71.9 |
| B | 0 | 214 | 54022 | 786.75 | 345 | 337 | 68.2 |
| B | 12 | 111 | 6746 | 93.92 | 345 | 337 | 68.2 |
| B | 4 | 173 | 5986 | 82.79 | 345 | 337 | 68.2 |
| C | 1 | 16 | 11570 | 140.75 | 335 | 335 | 79.8 |
| C | 10 | 22 | 2909 | 32.25 | 335 | 335 | 79.8 |
| C | 13 | 61 | 2517 | 27.34 | 335 | 335 | 79.8 |
| D | 2 | 152 | 286804 | 3507.51 | 329 | 317 | 81.7 |
| D | 12 | 233 | 180544 | 2206.55 | 329 | 317 | 81.7 |
| D | 1 | 52 | 70496 | 859.21 | 329 | 317 | 81.7 |
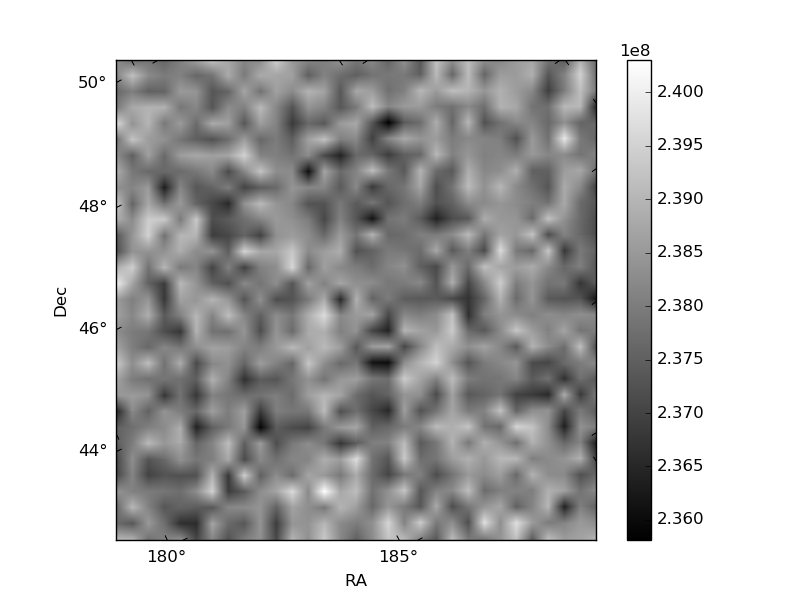
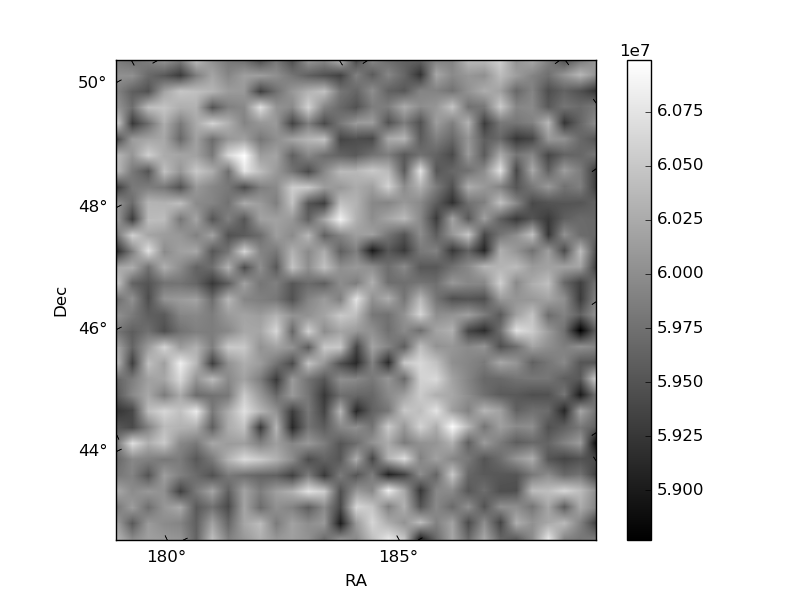
Histogram calculated using DETX and DETY for each event in the final _common_clean file
| Quadrant A | 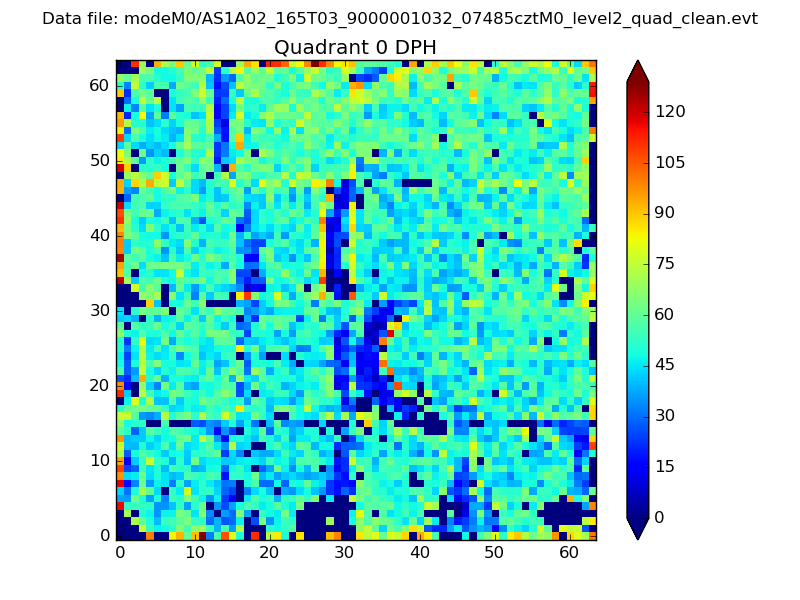 |
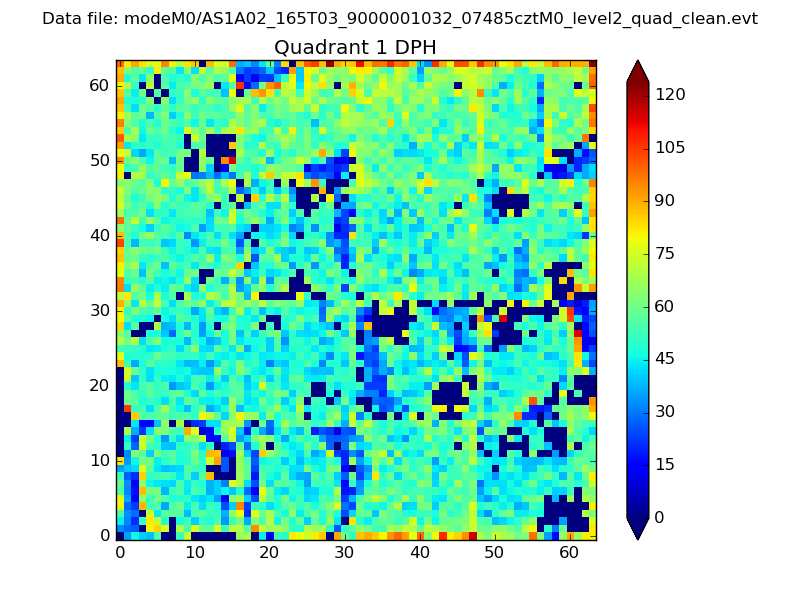 |
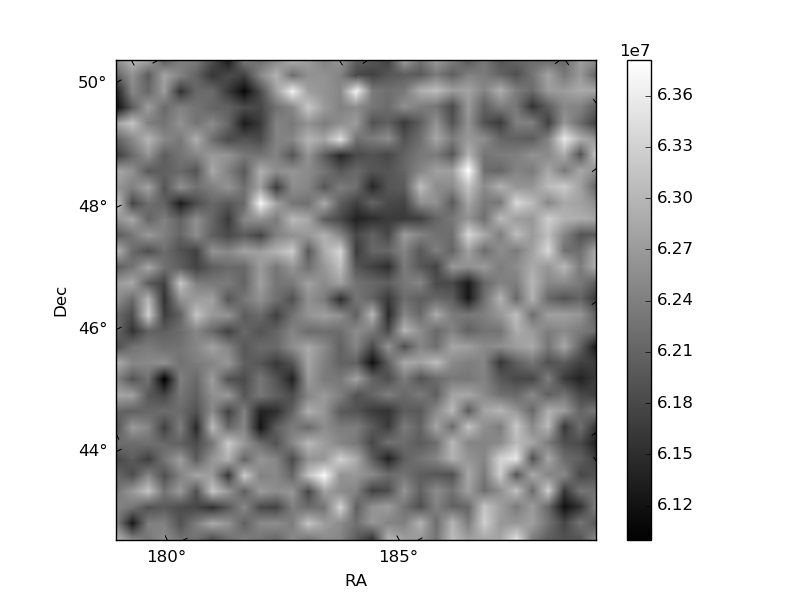
Quadrant B |
|---|---|---|---|
| Quadrant D | 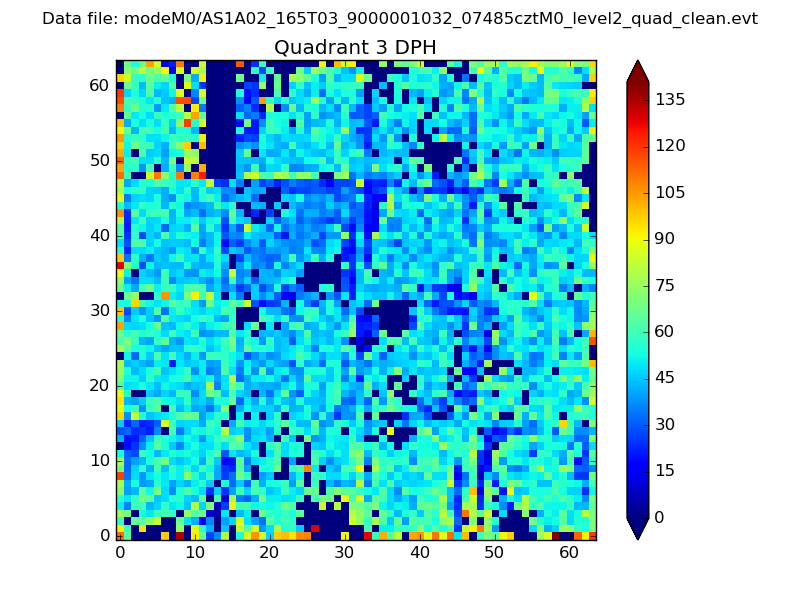 |
 |
Quadrant C |
| Plot type | Count rate plots | Images |
|---|---|---|
| Comparison with Poisson distribution Blue bars denote a histogram of data divided into 1 sec bins. Red curve is a Poisson curve with rate = median count rate of data. |
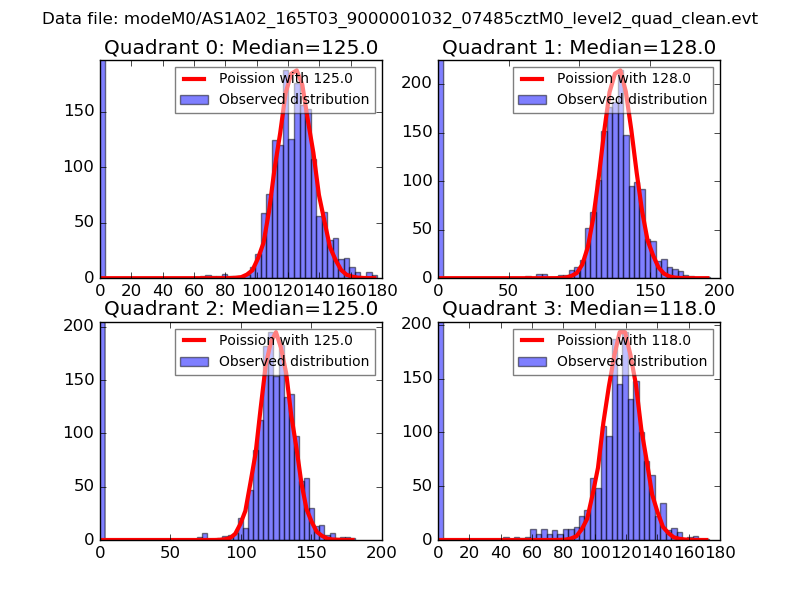 |
 |
| Quadrant-wise count rates Data is divided into 100 sec bins |
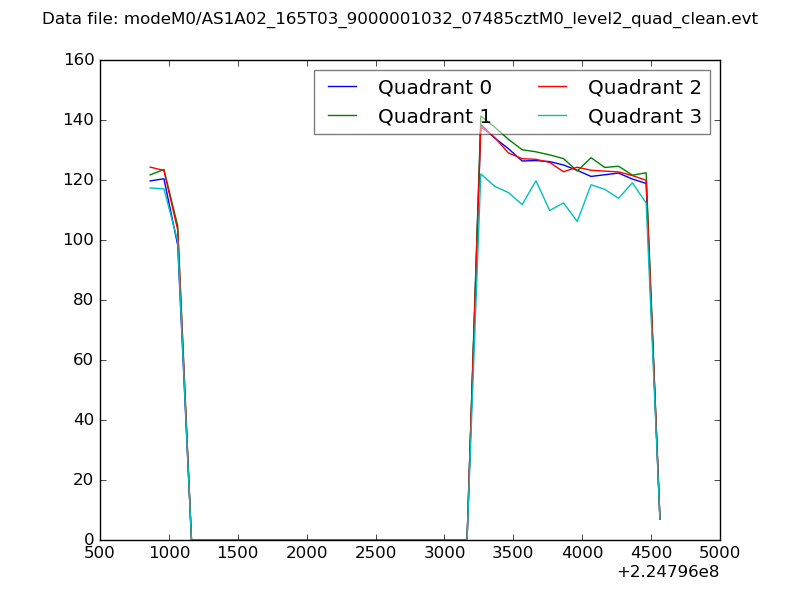 |
|
| Module-wise count rates for Quadrant A Data is divided into 100 sec bins |
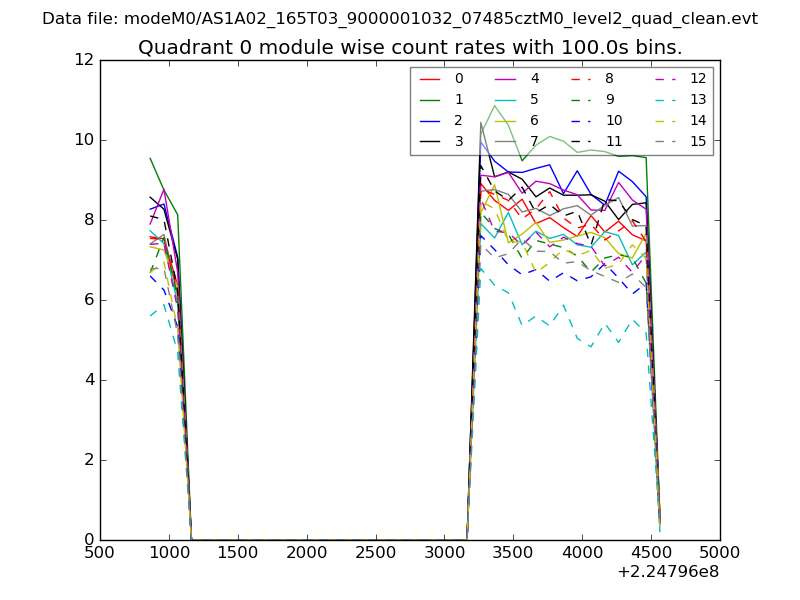 |
 |
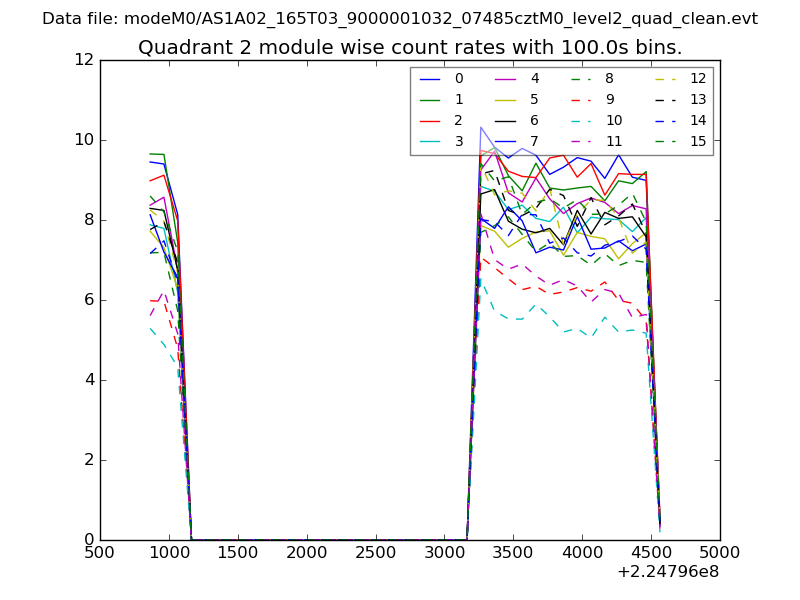
| Module-wise count rates for Quadrant B Data is divided into 100 sec bins |
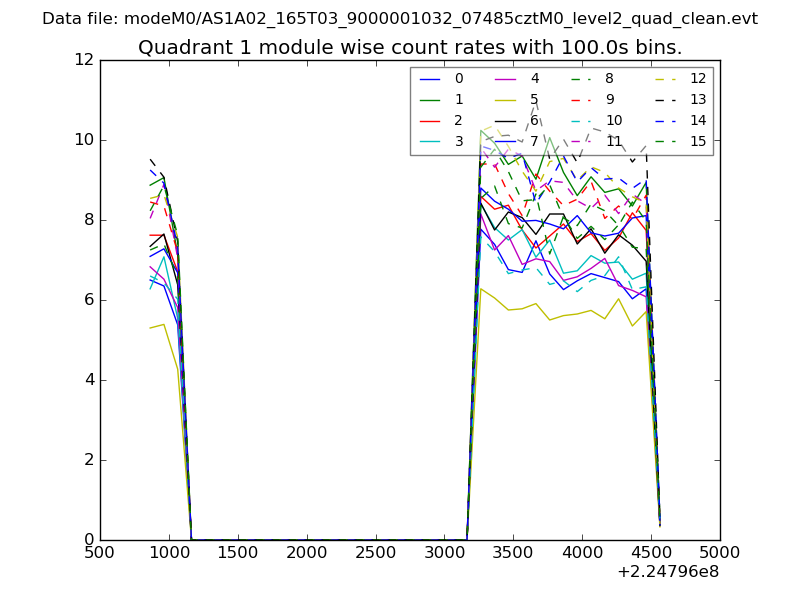 |
 |
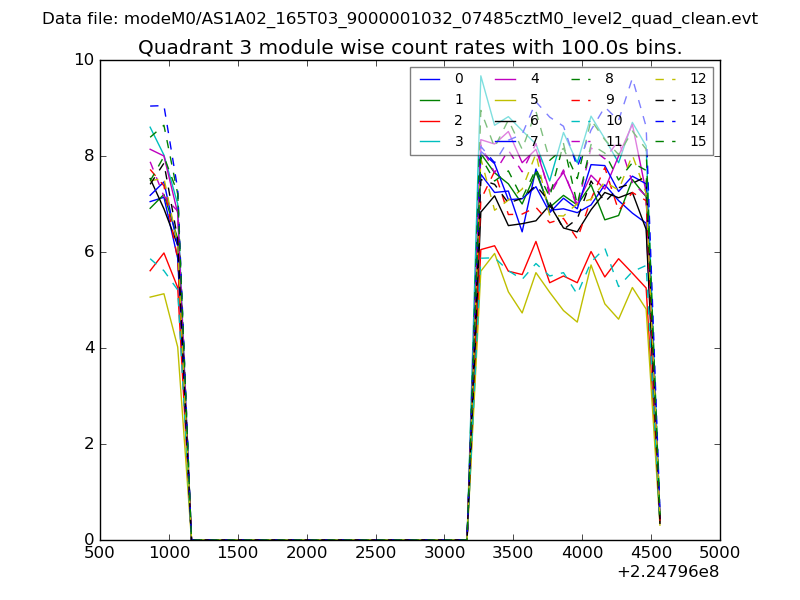
| Module-wise count rates for Quadrant C Data is divided into 100 sec bins |
 |
 |
| Module-wise count rates for Quadrant D Data is divided into 100 sec bins |
 |
 |
| Parameter | Plot |
|---|---|
| CZT HV Monitor | 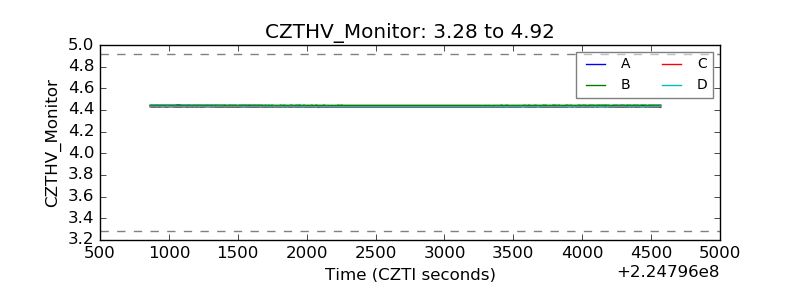 |
| D_VDD | 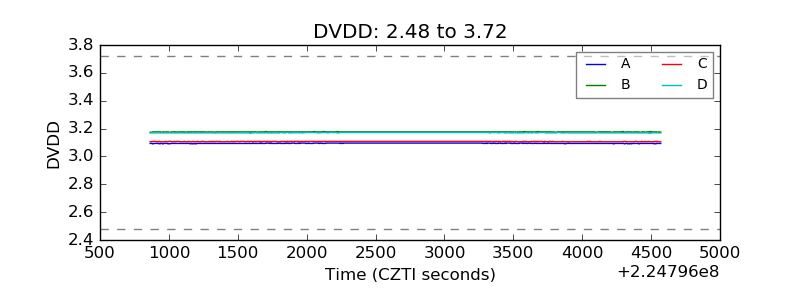 |
| Temperature 1 | 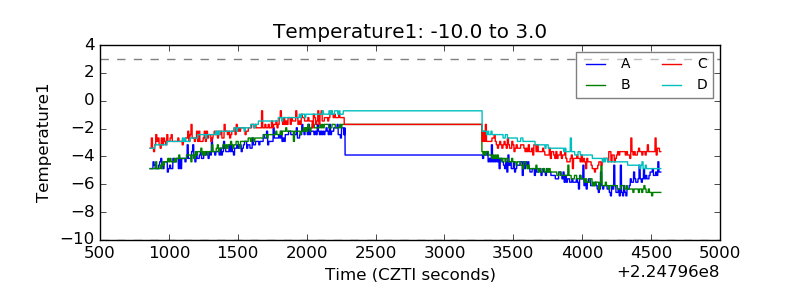 |
| Veto HV Monitor | 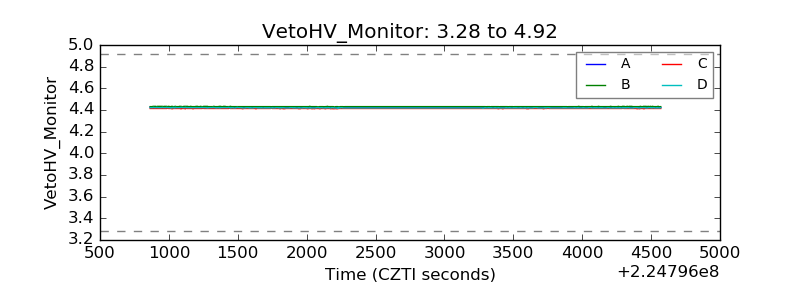 |
| Veto LLD | 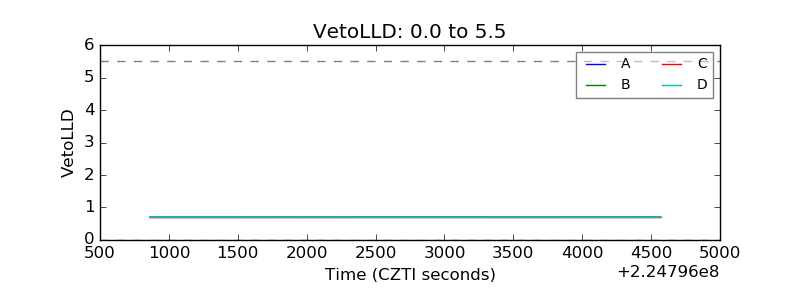 |
| Alpha Counter | 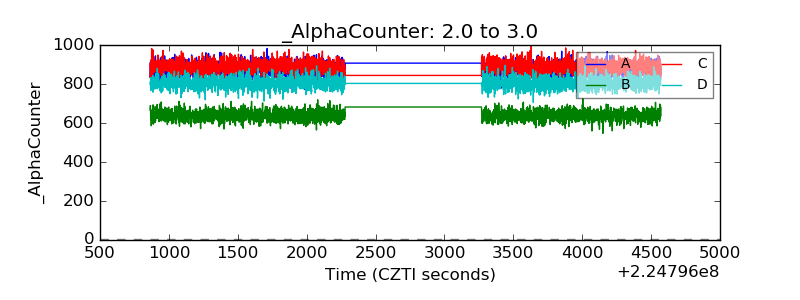 |
| _CPM_Rate | 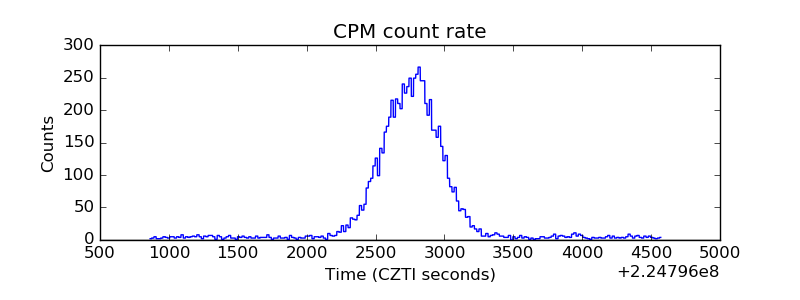 |
| CZT Counter | 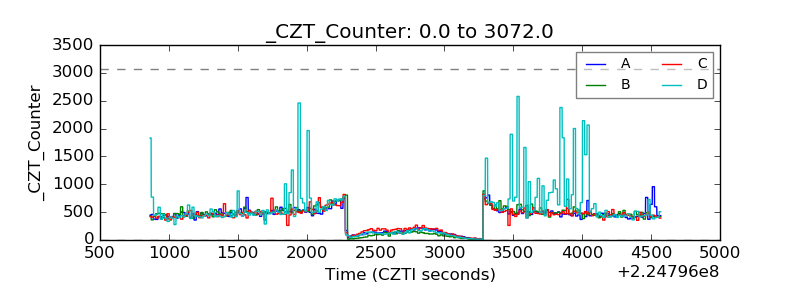 |
| +2.5 Volts monitor |  |
| +5 Volts monitor |  |
| _ROLL_ROT | 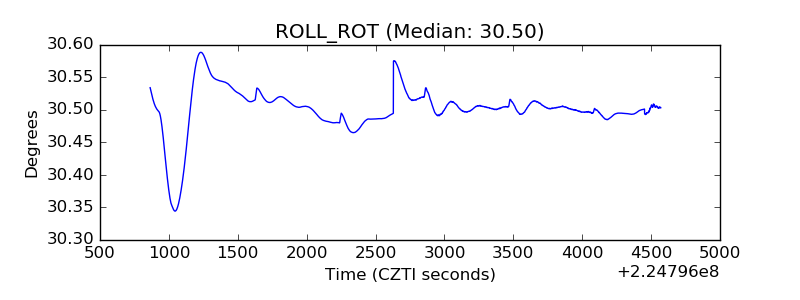 |
| _Roll_DEC | 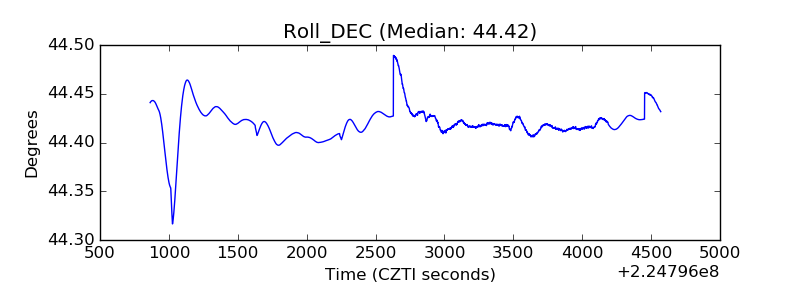 |
| _Roll_RA | 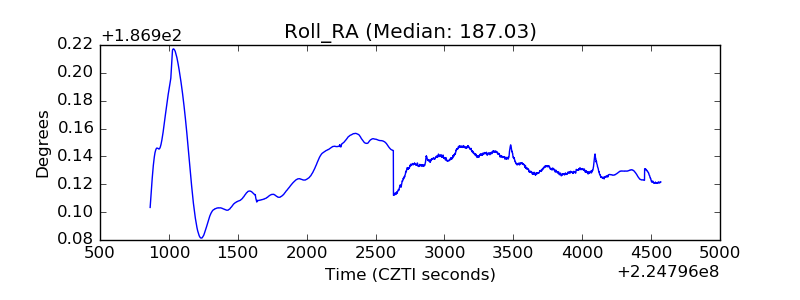 |
| Veto Counter | 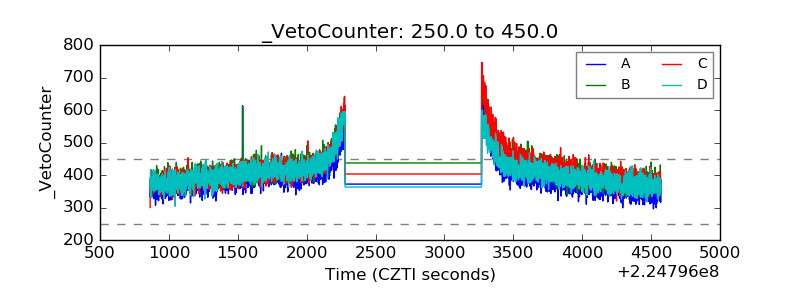 |