| Param | Original file | Final file |
|---|---|---|
| Filename | modeM0/AS1A02_165T03_9000001032_07486cztM0_level2.evt | modeM0/AS1A02_165T03_9000001032_07486cztM0_level2_quad_clean.evt |
| Size (bytes) | 463,847,040 | 97,551,360 |
| Size | 442.4 MB | 93.0 MB |
| Events in quadrant A | 3,178,069 | 617,105 |
| Events in quadrant B | 3,339,390 | 629,895 |
| Events in quadrant C | 3,175,087 | 626,648 |
| Events in quadrant D | 3,877,304 | 591,057 |
| Mode M9 | |||
|---|---|---|---|
| Quadrant | BADHDUFLAG | Total packets | Discarded packets |
| A | 0 | 7 | 0 |
| B | 0 | 7 | 0 |
| C | 0 | 7 | 0 |
| D | 0 | 8 | 0 |
| Mode SS | |||
|---|---|---|---|
| Quadrant | BADHDUFLAG | Total packets | Discarded packets |
| A | 0 | 142 | 0 |
| B | 0 | 142 | 0 |
| C | 0 | 142 | 0 |
| D | 0 | 142 | 0 |
| Mode M0 | |||
|---|---|---|---|
| Quadrant | BADHDUFLAG | Total packets | Discarded packets |
| A | 0 | 14479 | 3 |
| B | 0 | 14834 | 2 |
| C | 0 | 14496 | 2 |
| D | 0 | 16847 | 2 |
| Quadrant | Total seconds | Saturated seconds | Saturation percentage |
|---|---|---|---|
| A | 7031 | 28 | 0.398236% |
| B | 7031 | 83 | 1.180486% |
| C | 7031 | 38 | 0.540464% |
| D | 7031 | 201 | 2.858768% |
Noise dominated data is calculated using 1-second bins in cleaned event files. If a bin has >2000 counts, and if more than 50% of those come from <1% of pixels, then it is considered to be noise-dominated and hence unusable.
| Quadrant | # 1 sec bins | Bins with >0 counts | Bins with >2000 counts | High rate bins dominated by noise | Noise dominated (total time) | Noise dominated (detector-on time) | Marked lightcurve |
|---|---|---|---|---|---|---|---|
| A | 7621 | 7032 | 0 | 0 | 0.00% | 0.00% | 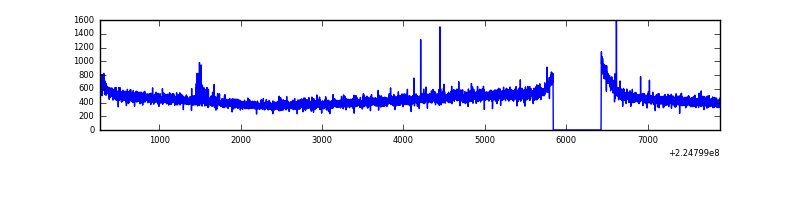 |
| B | 7621 | 7032 | 9 | 9 | 0.12% | 0.13% | 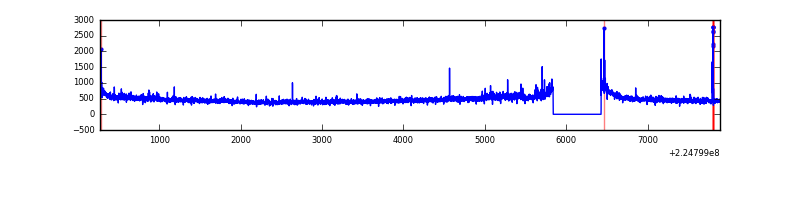 |
| C | 7621 | 7032 | 2 | 2 | 0.03% | 0.03% | 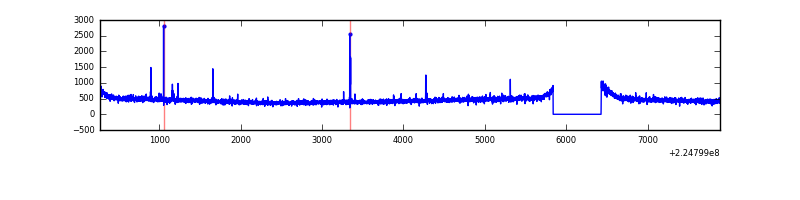 |
| D | 7621 | 7032 | 142 | 142 | 1.86% | 2.02% | 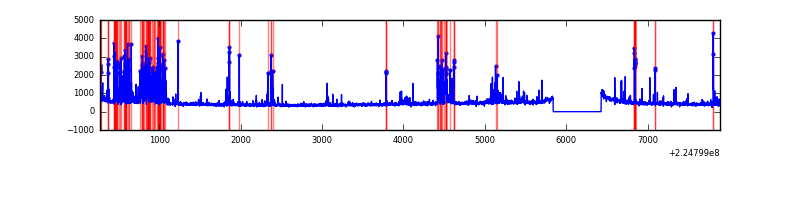 |
Top three noisy pixels from each quadrant. If the there are fewer than three noisy pixels in the level2.evt file, extra rows are filled as -1
| Pixel properties | Quadrant properties | ||||||
|---|---|---|---|---|---|---|---|
| Quadrant | DetID | PixID | Counts | Sigma | Mean | Median | Sigma |
| A | 15 | 239 | 19128 | 109.75 | 818 | 800 | 167.0 |
| A | 0 | 226 | 7790 | 41.86 | 818 | 800 | 167.0 |
| A | 12 | 194 | 7264 | 38.71 | 818 | 800 | 167.0 |
| B | 0 | 214 | 59035 | 366.41 | 830 | 808 | 158.9 |
| B | 0 | 85 | 26810 | 163.62 | 830 | 808 | 158.9 |
| B | 12 | 111 | 16818 | 100.75 | 830 | 808 | 158.9 |
| C | 1 | 16 | 20446 | 103.98 | 807 | 810 | 188.8 |
| C | 13 | 61 | 6135 | 28.2 | 807 | 810 | 188.8 |
| C | 12 | 4 | 4341 | 18.7 | 807 | 810 | 188.8 |
| D | 2 | 152 | 324271 | 1649.14 | 793 | 765 | 196.2 |
| D | 12 | 233 | 313960 | 1596.58 | 793 | 765 | 196.2 |
| D | 2 | 14 | 101887 | 515.49 | 793 | 765 | 196.2 |
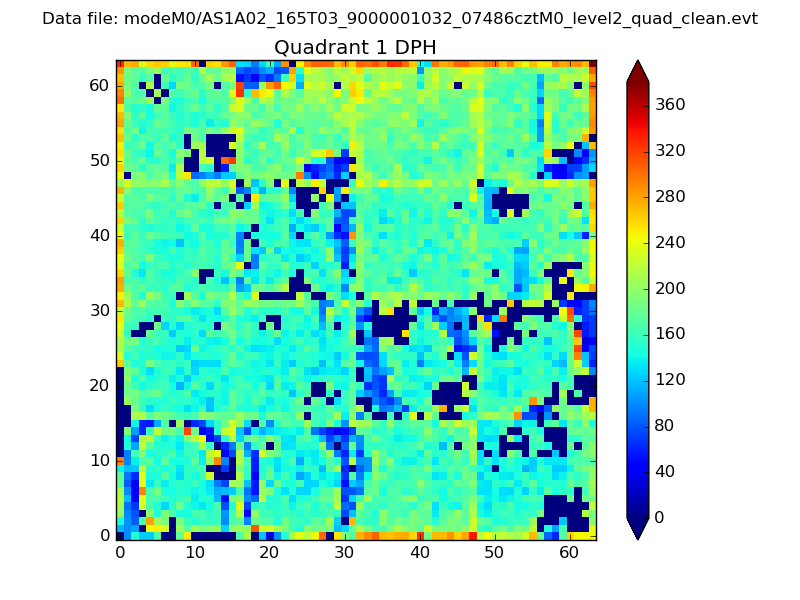
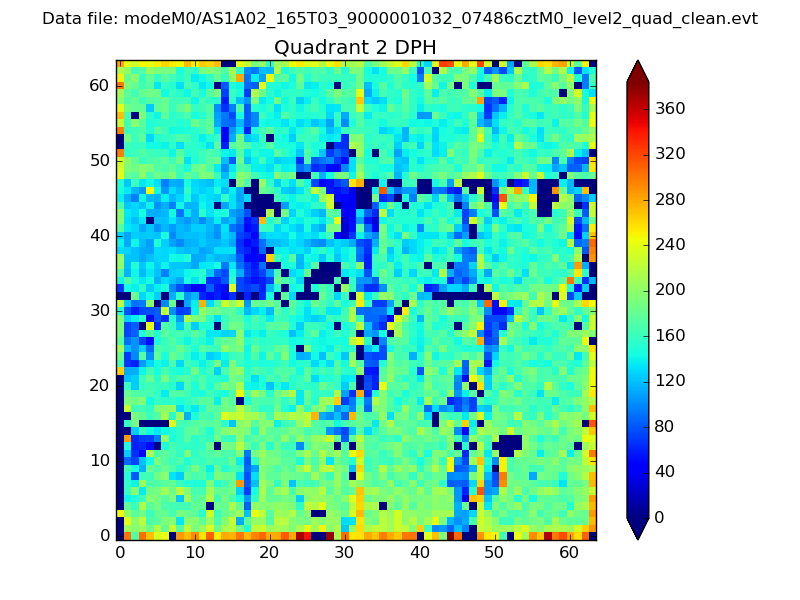
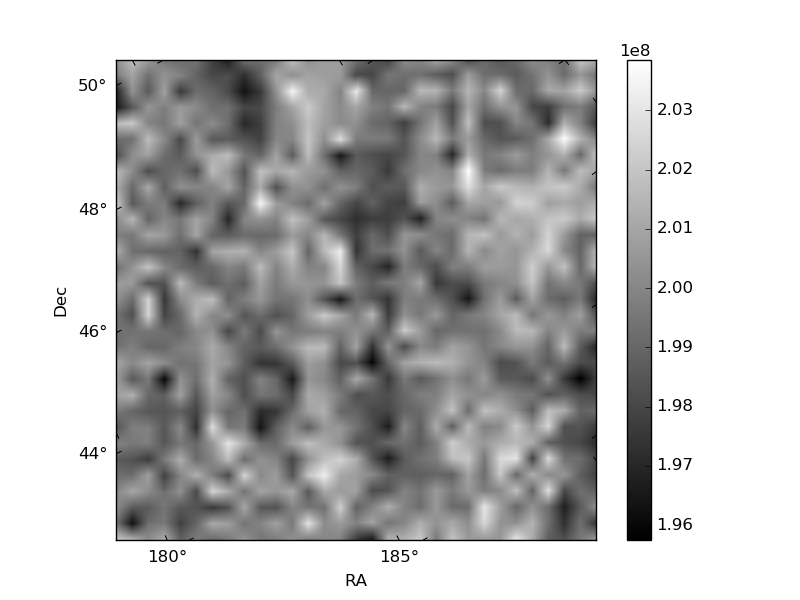
Histogram calculated using DETX and DETY for each event in the final _common_clean file
| Quadrant A |  |
 |
Quadrant B |
|---|---|---|---|
| Quadrant D |  |
 |
Quadrant C |
| Plot type | Count rate plots | Images |
|---|---|---|
| Comparison with Poisson distribution Blue bars denote a histogram of data divided into 1 sec bins. Red curve is a Poisson curve with rate = median count rate of data. |
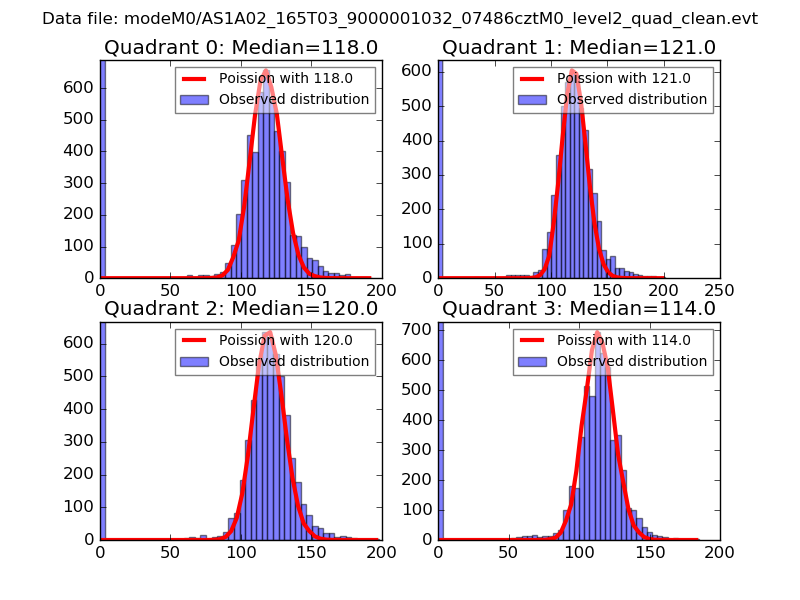 |
 |
| Quadrant-wise count rates Data is divided into 100 sec bins |
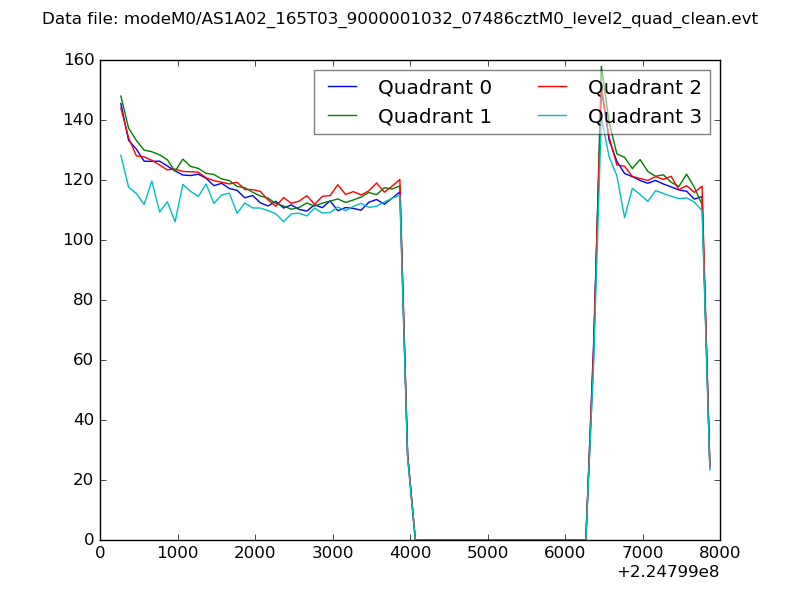 |
|
| Module-wise count rates for Quadrant A Data is divided into 100 sec bins |
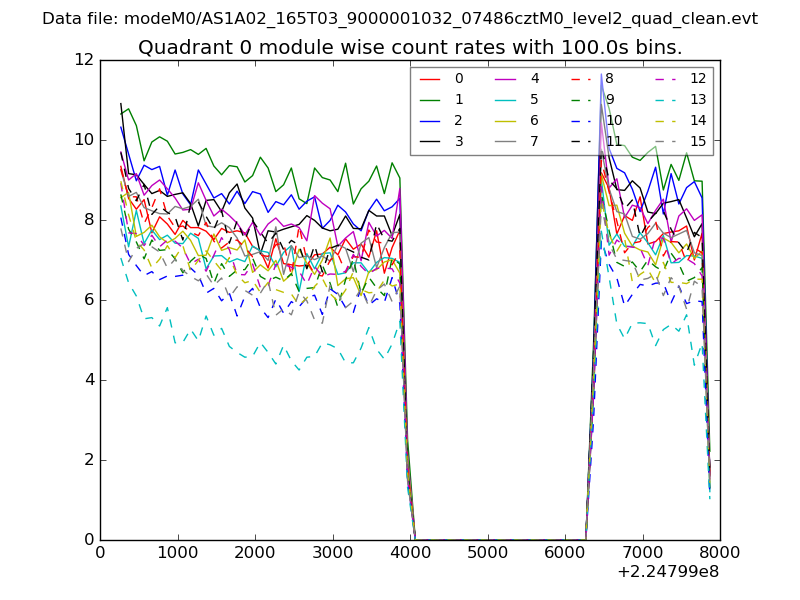 |
 |
| Module-wise count rates for Quadrant B Data is divided into 100 sec bins |
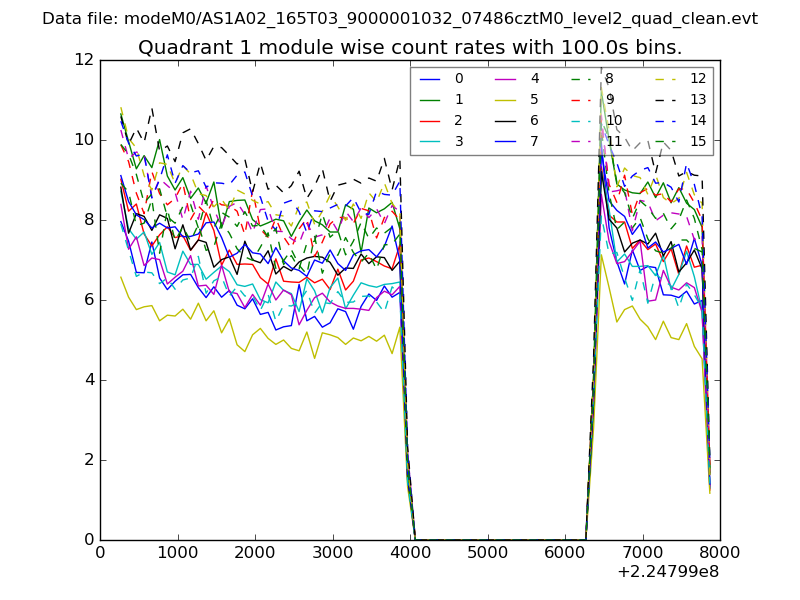 |
 |
| Module-wise count rates for Quadrant C Data is divided into 100 sec bins |
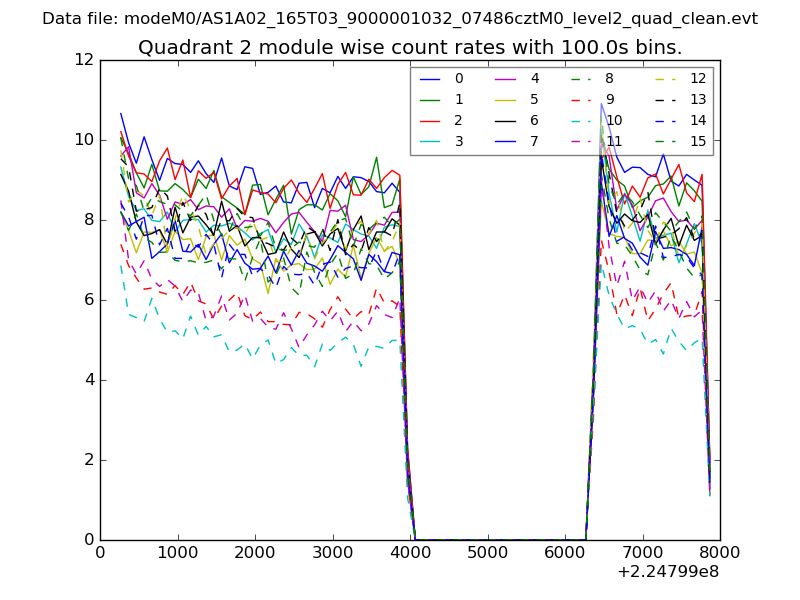 |
 |
| Module-wise count rates for Quadrant D Data is divided into 100 sec bins |
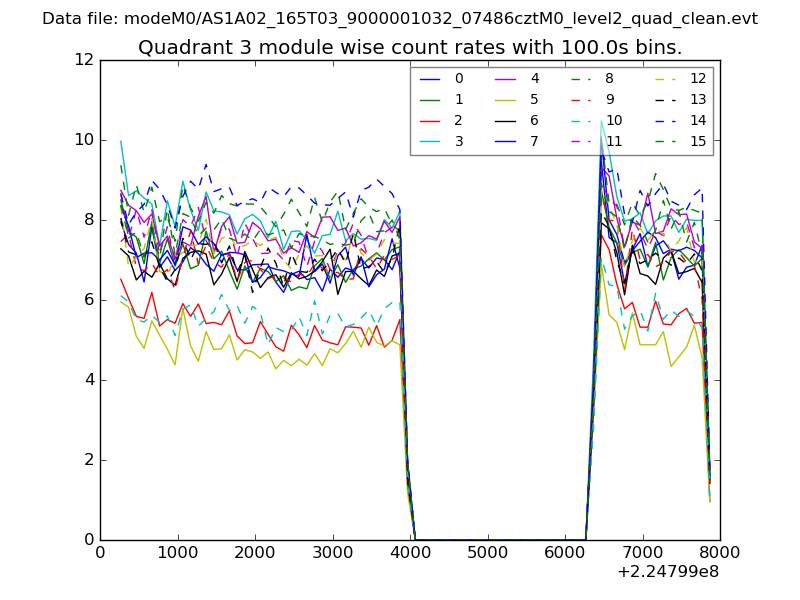 |
 |
| Parameter | Plot |
|---|---|
| CZT HV Monitor | 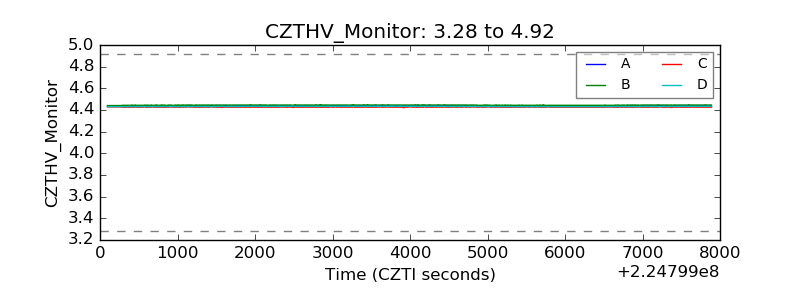 |
| D_VDD | 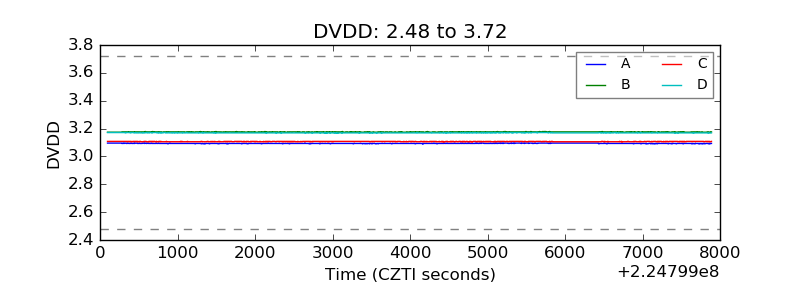 |
| Temperature 1 | 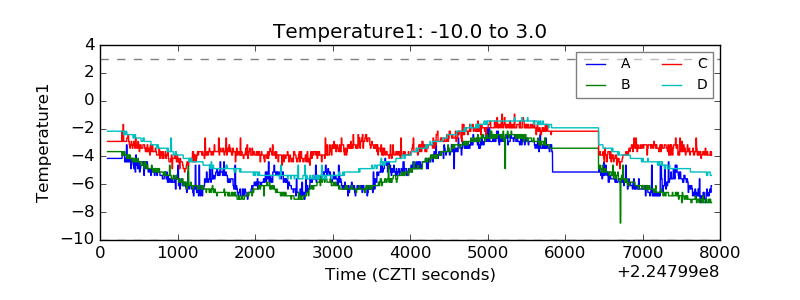 |
| Veto HV Monitor | 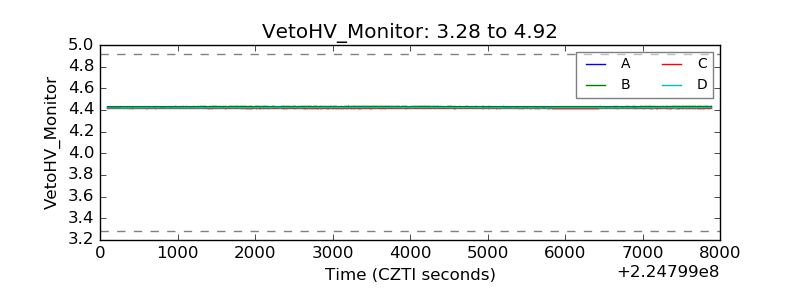 |
| Veto LLD | 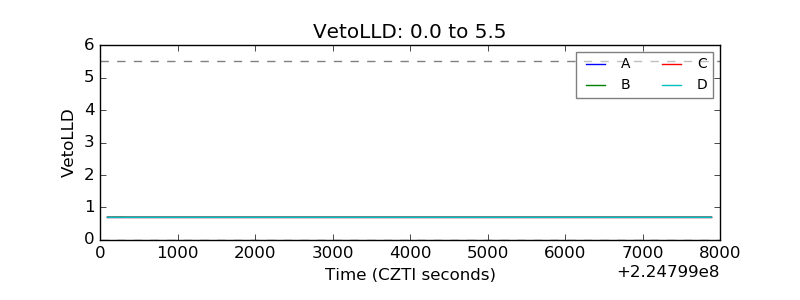 |
| Alpha Counter | 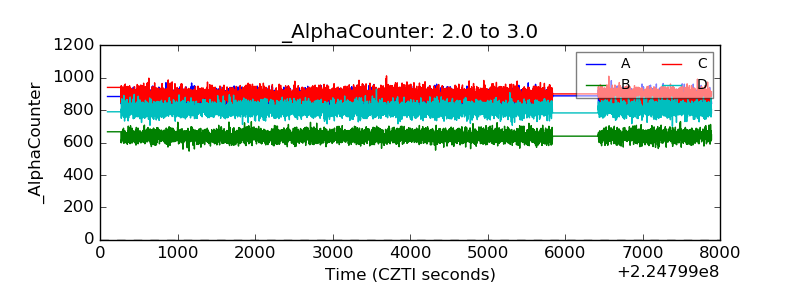 |
| _CPM_Rate | 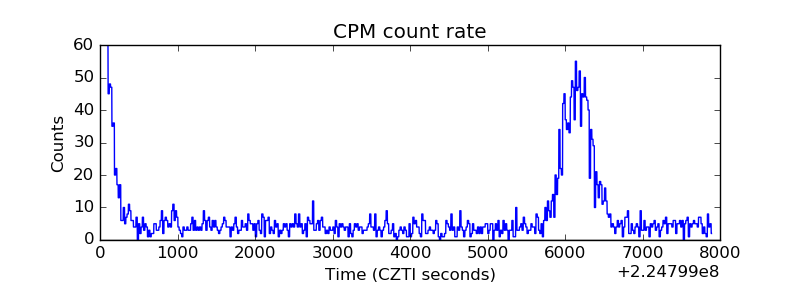 |
| CZT Counter | 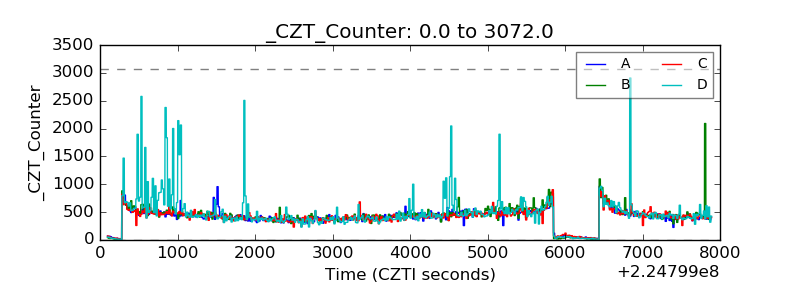 |
| +2.5 Volts monitor |  |
| +5 Volts monitor |  |
| _ROLL_ROT | 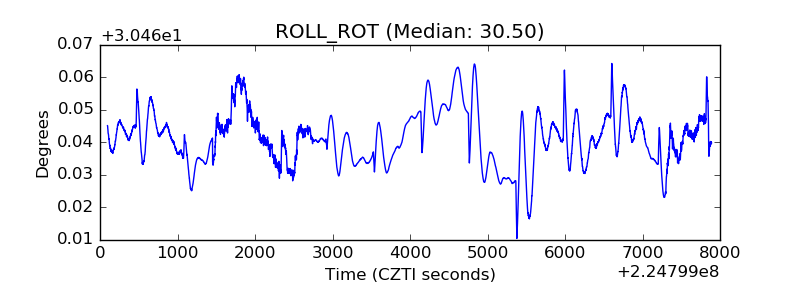 |
| _Roll_DEC | 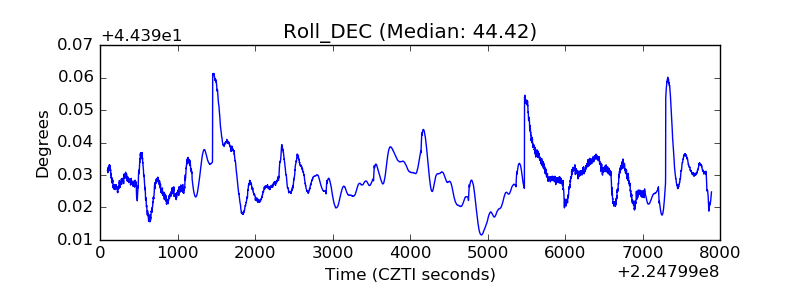 |
| _Roll_RA | 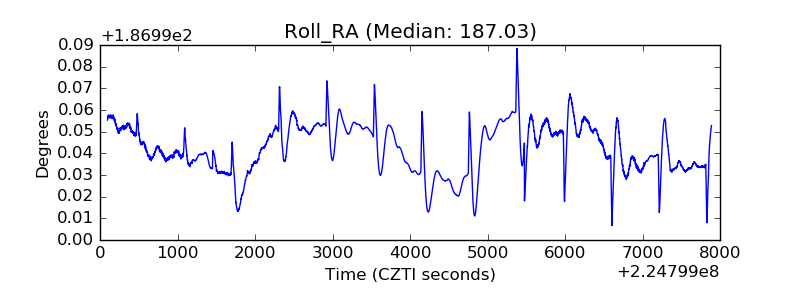 |
| Veto Counter | 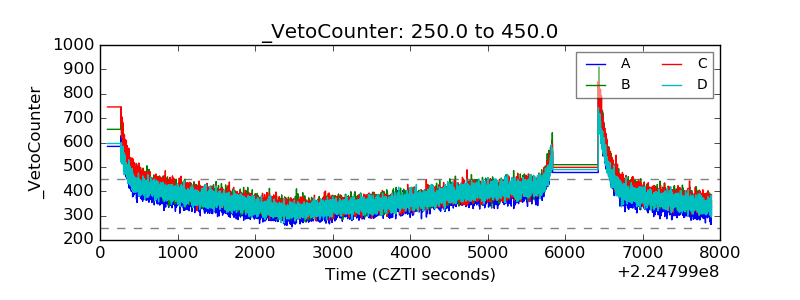 |