| Param | Original file | Final file |
|---|---|---|
| Filename | modeM0/AS1A02_165T03_9000001032_07487cztM0_level2.evt | modeM0/AS1A02_165T03_9000001032_07487cztM0_level2_quad_clean.evt |
| Size (bytes) | 519,759,360 | 103,829,760 |
| Size | 495.7 MB | 99.0 MB |
| Events in quadrant A | 3,608,990 | 647,071 |
| Events in quadrant B | 4,036,580 | 663,560 |
| Events in quadrant C | 3,583,420 | 659,744 |
| Events in quadrant D | 3,977,467 | 627,188 |
| Mode M9 | |||
|---|---|---|---|
| Quadrant | BADHDUFLAG | Total packets | Discarded packets |
| A | 0 | 9 | 0 |
| B | 0 | 9 | 0 |
| C | 0 | 9 | 0 |
| D | 0 | 9 | 0 |
| Mode SS | |||
|---|---|---|---|
| Quadrant | BADHDUFLAG | Total packets | Discarded packets |
| A | 0 | 162 | 0 |
| B | 0 | 162 | 0 |
| C | 0 | 162 | 0 |
| D | 0 | 162 | 0 |
| Mode M0 | |||
|---|---|---|---|
| Quadrant | BADHDUFLAG | Total packets | Discarded packets |
| A | 0 | 16420 | 3 |
| B | 0 | 17514 | 2 |
| C | 0 | 16398 | 2 |
| D | 0 | 17801 | 2 |
| Quadrant | Total seconds | Saturated seconds | Saturation percentage |
|---|---|---|---|
| A | 7870 | 63 | 0.800508% |
| B | 7870 | 209 | 2.655654% |
| C | 7870 | 56 | 0.711563% |
| D | 7870 | 150 | 1.905972% |
Noise dominated data is calculated using 1-second bins in cleaned event files. If a bin has >2000 counts, and if more than 50% of those come from <1% of pixels, then it is considered to be noise-dominated and hence unusable.
| Quadrant | # 1 sec bins | Bins with >0 counts | Bins with >2000 counts | High rate bins dominated by noise | Noise dominated (total time) | Noise dominated (detector-on time) | Marked lightcurve |
|---|---|---|---|---|---|---|---|
| A | 8745 | 7873 | 0 | 0 | 0.00% | 0.00% | 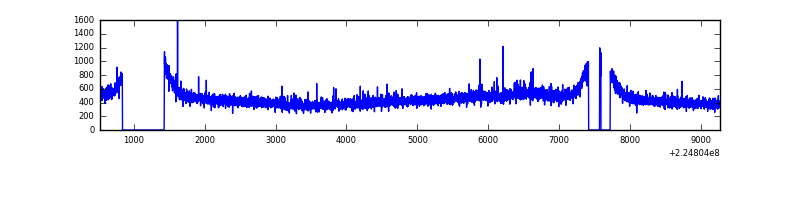 |
| B | 8745 | 7873 | 83 | 83 | 0.95% | 1.05% | 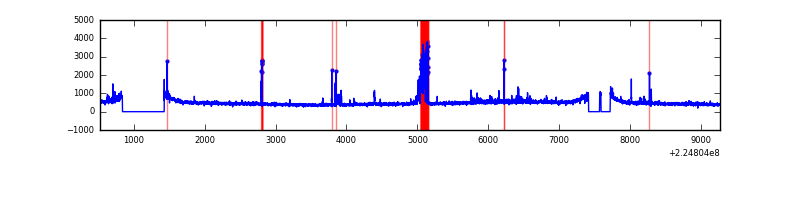 |
| C | 8745 | 7873 | 1 | 1 | 0.01% | 0.01% | 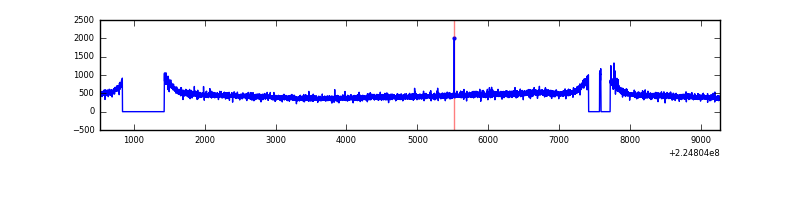 |
| D | 8745 | 7873 | 68 | 68 | 0.78% | 0.86% | 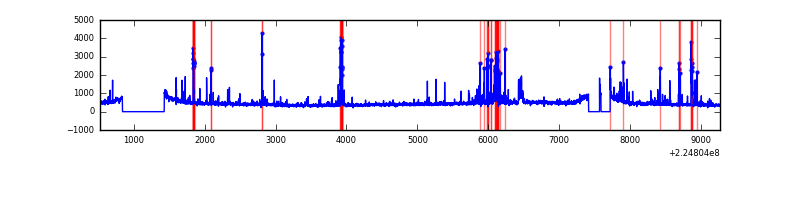 |
Top three noisy pixels from each quadrant. If the there are fewer than three noisy pixels in the level2.evt file, extra rows are filled as -1
| Pixel properties | Quadrant properties | ||||||
|---|---|---|---|---|---|---|---|
| Quadrant | DetID | PixID | Counts | Sigma | Mean | Median | Sigma |
| A | 15 | 234 | 12335 | 59.87 | 929 | 904 | 190.9 |
| A | 15 | 239 | 11455 | 55.26 | 929 | 904 | 190.9 |
| A | 0 | 226 | 8587 | 40.24 | 929 | 904 | 190.9 |
| B | 0 | 85 | 289723 | 1594.65 | 937 | 909 | 181.1 |
| B | 0 | 214 | 67479 | 367.56 | 937 | 909 | 181.1 |
| B | 4 | 173 | 20717 | 109.36 | 937 | 909 | 181.1 |
| C | 13 | 61 | 6871 | 27.63 | 915 | 920 | 215.4 |
| C | 8 | 222 | 5383 | 20.72 | 915 | 920 | 215.4 |
| C | 10 | 22 | 5275 | 20.22 | 915 | 920 | 215.4 |
| D | 2 | 14 | 181835 | 808.46 | 903 | 874 | 223.8 |
| D | 1 | 52 | 151844 | 674.48 | 903 | 874 | 223.8 |
| D | 2 | 136 | 72516 | 320.07 | 903 | 874 | 223.8 |
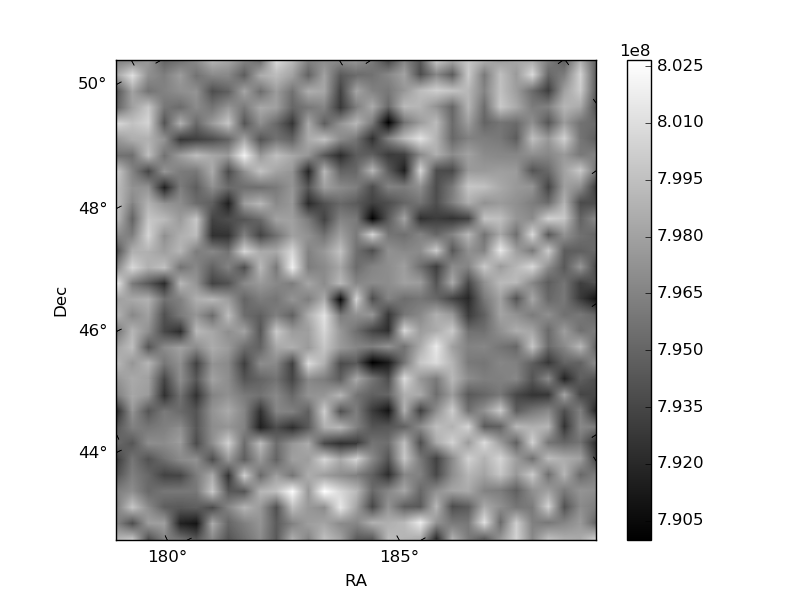
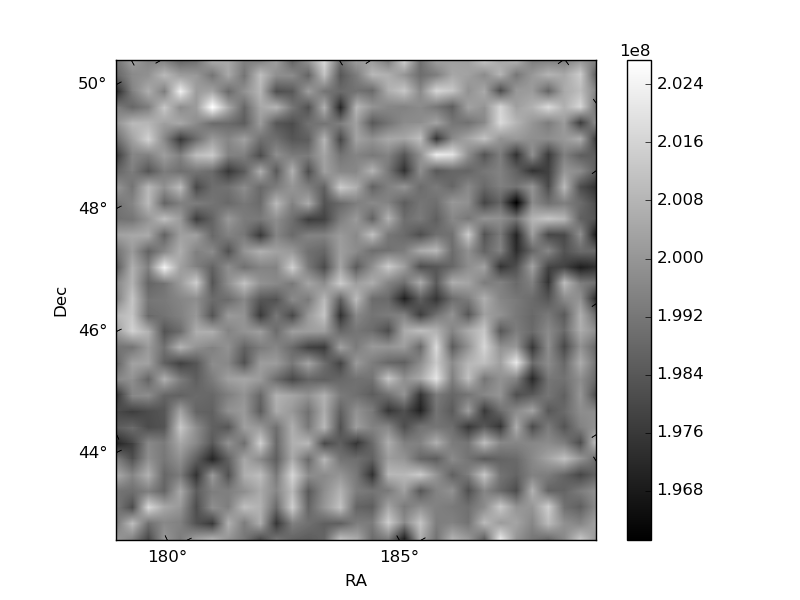
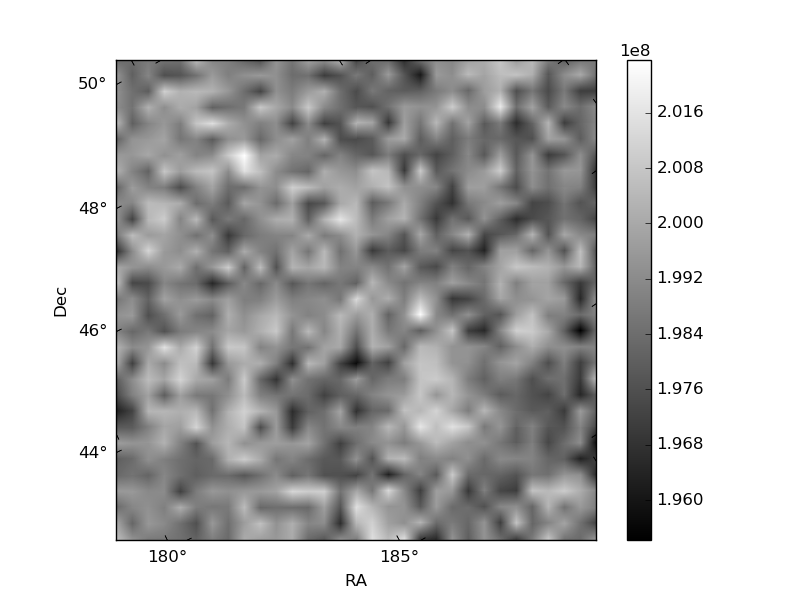
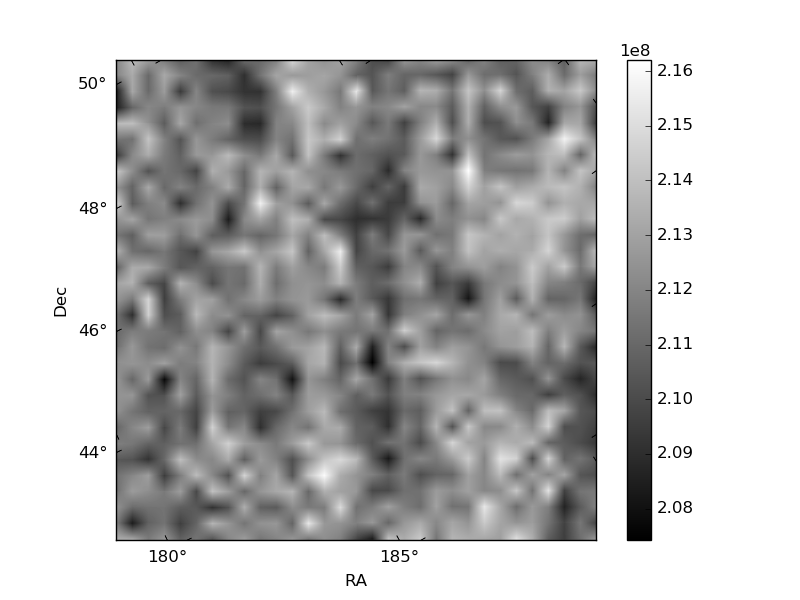
Histogram calculated using DETX and DETY for each event in the final _common_clean file
| Quadrant A | 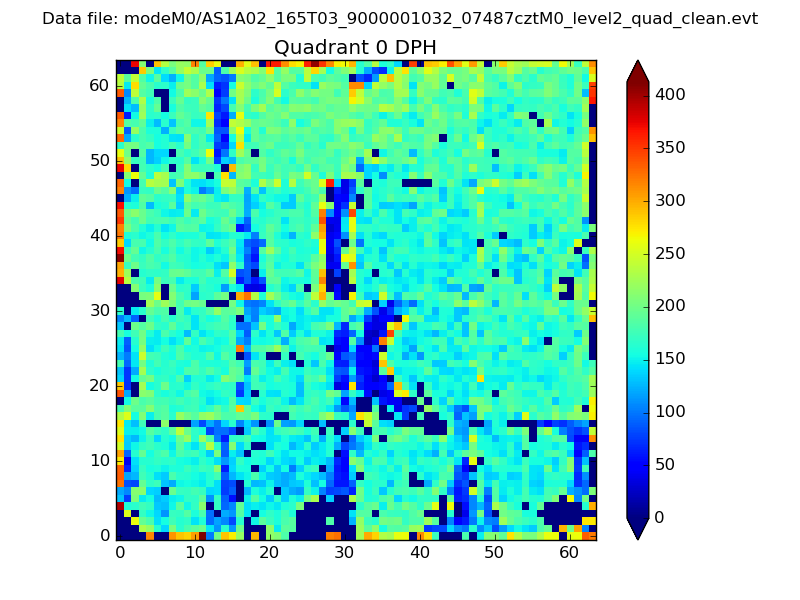 |
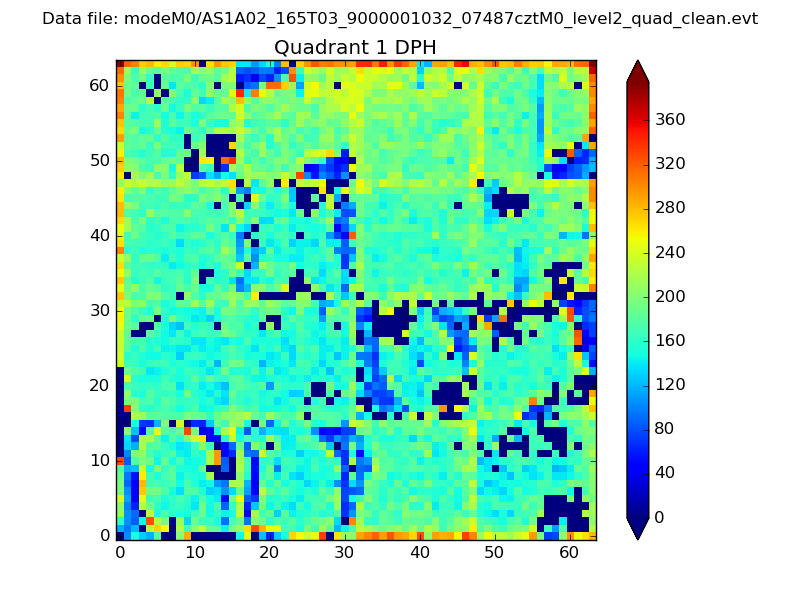 |
Quadrant B |
|---|---|---|---|
| Quadrant D | 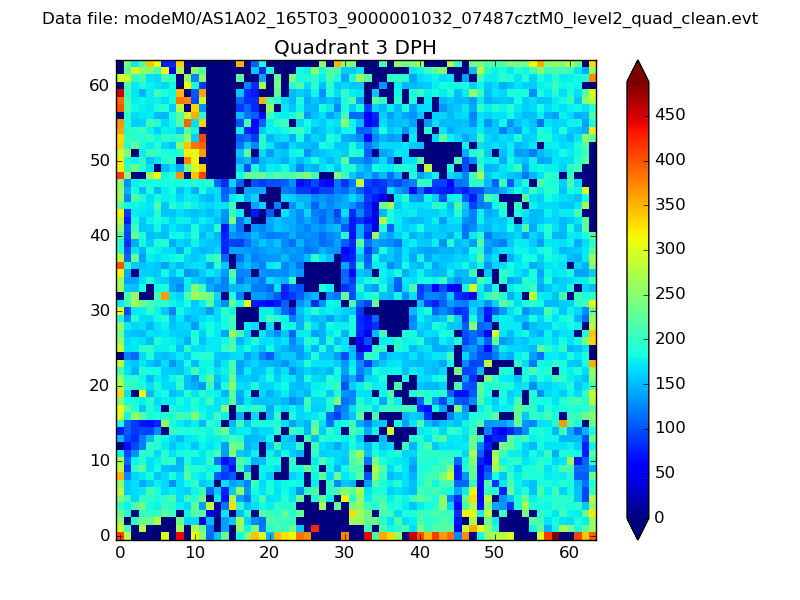 |
 |
Quadrant C |
| Plot type | Count rate plots | Images |
|---|---|---|
| Comparison with Poisson distribution Blue bars denote a histogram of data divided into 1 sec bins. Red curve is a Poisson curve with rate = median count rate of data. |
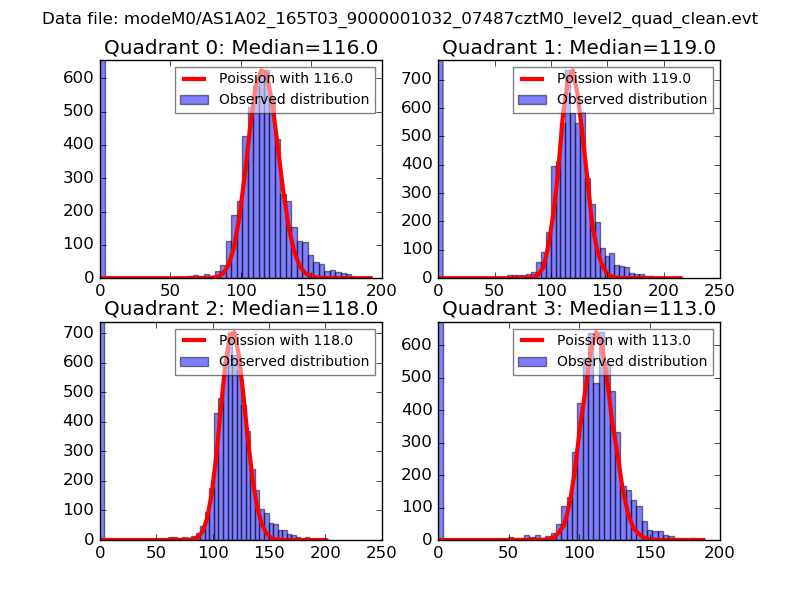 |
 |
| Quadrant-wise count rates Data is divided into 100 sec bins |
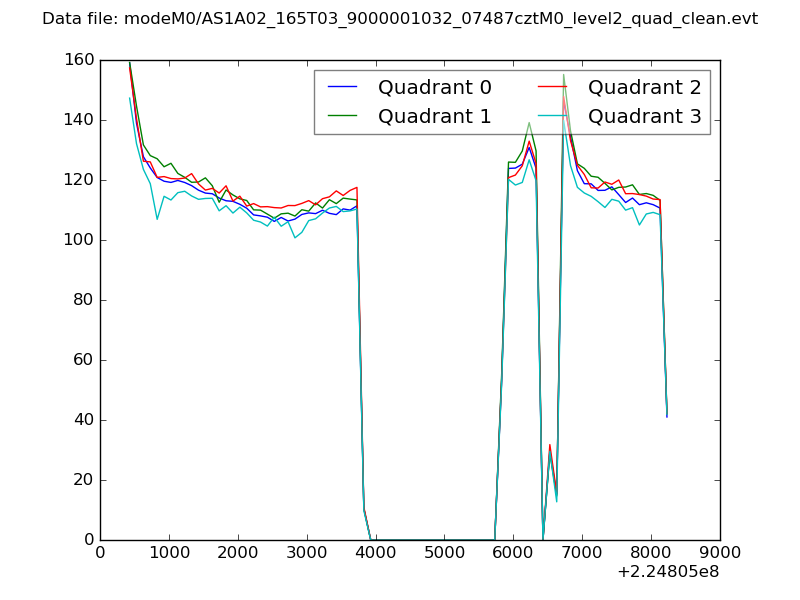 |
|
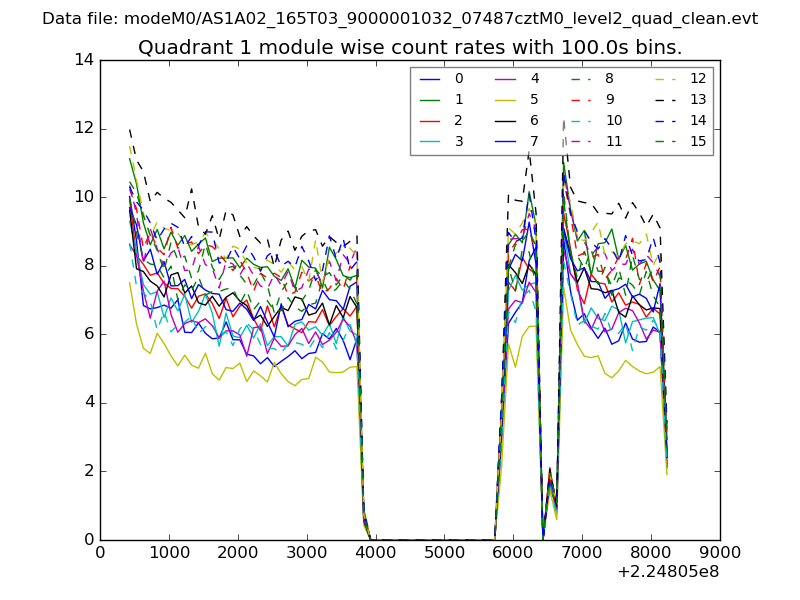
| Module-wise count rates for Quadrant A Data is divided into 100 sec bins |
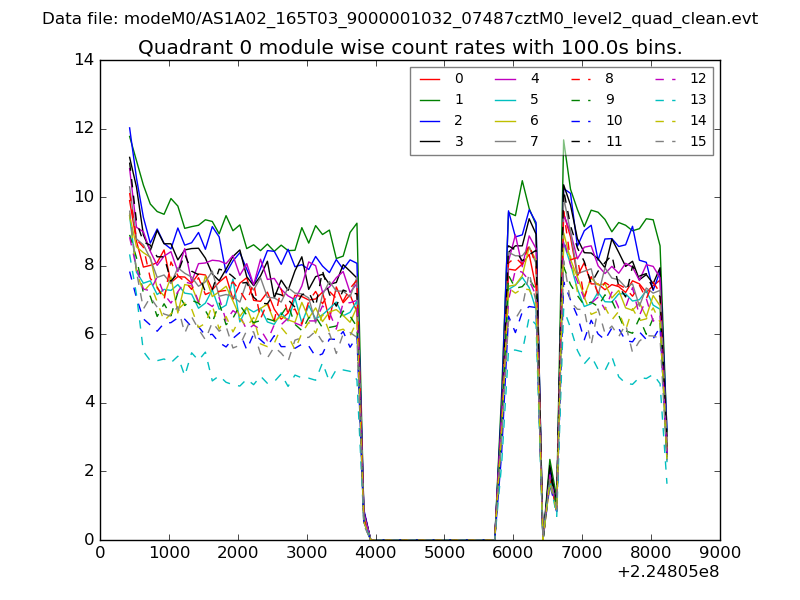 |
 |
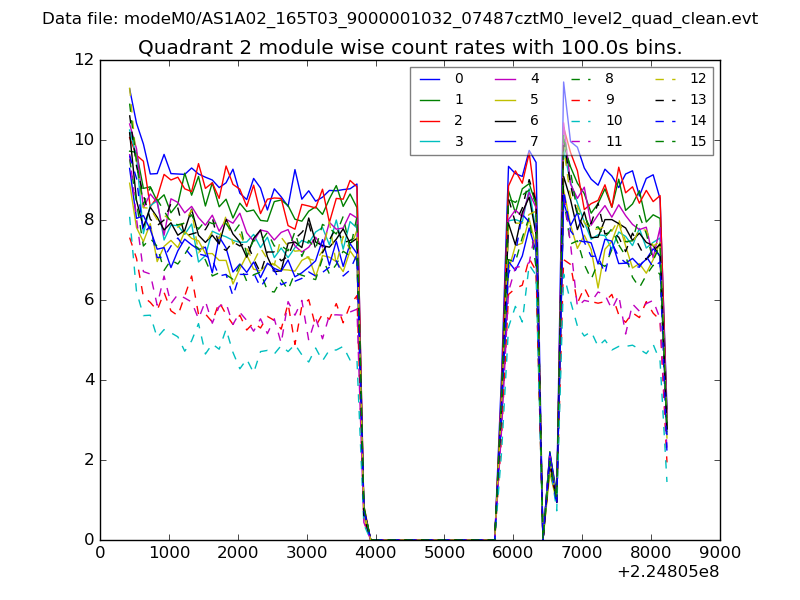
| Module-wise count rates for Quadrant B Data is divided into 100 sec bins |
 |
 |
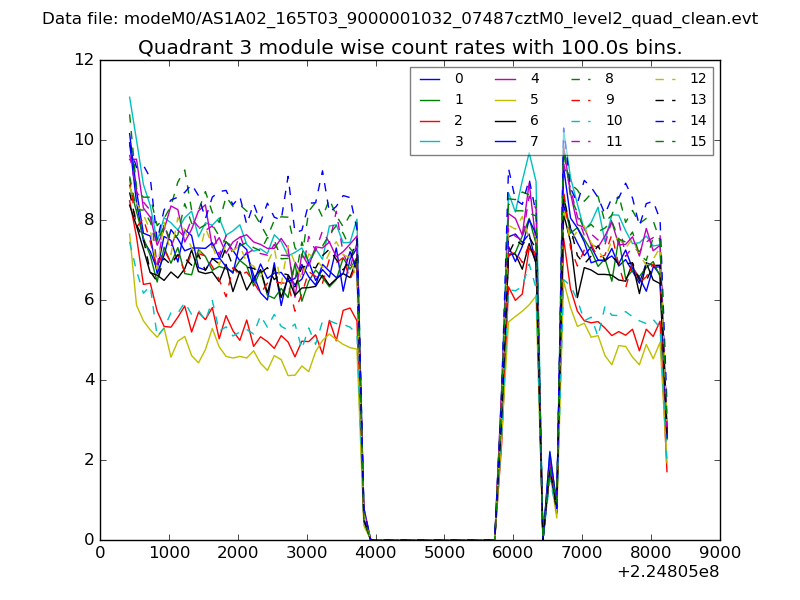
| Module-wise count rates for Quadrant C Data is divided into 100 sec bins |
 |
 |
| Module-wise count rates for Quadrant D Data is divided into 100 sec bins |
 |
 |
| Parameter | Plot |
|---|---|
| CZT HV Monitor | 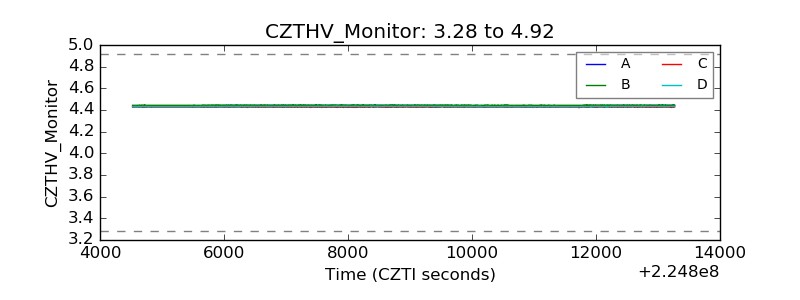 |
| D_VDD | 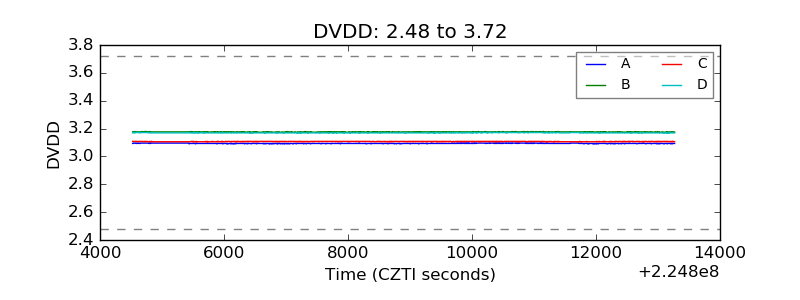 |
| Temperature 1 | 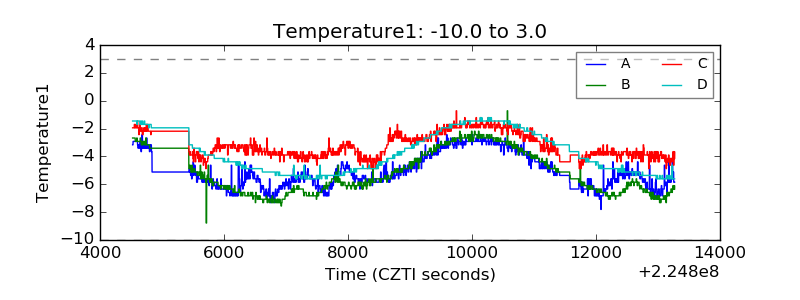 |
| Veto HV Monitor |  |
| Veto LLD | 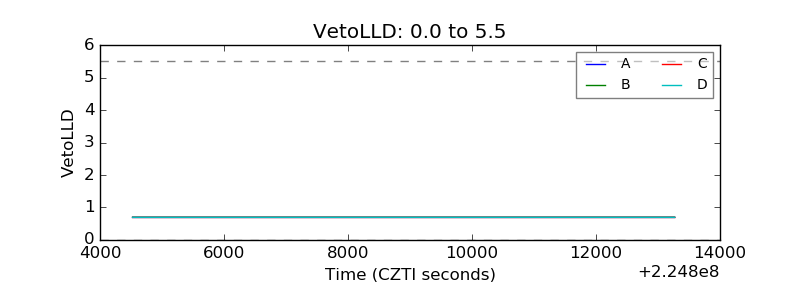 |
| Alpha Counter | 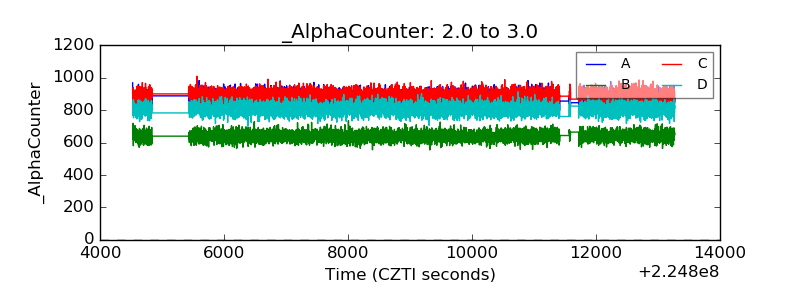 |
| _CPM_Rate | 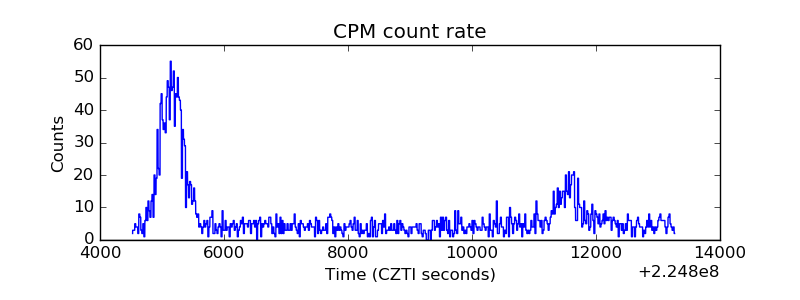 |
| CZT Counter |  |
| +2.5 Volts monitor |  |
| +5 Volts monitor |  |
| _ROLL_ROT | 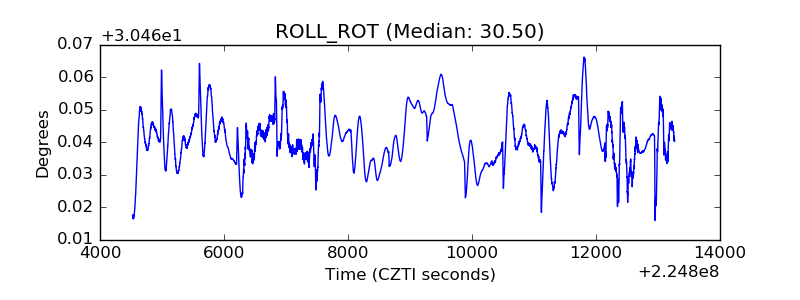 |
| _Roll_DEC | 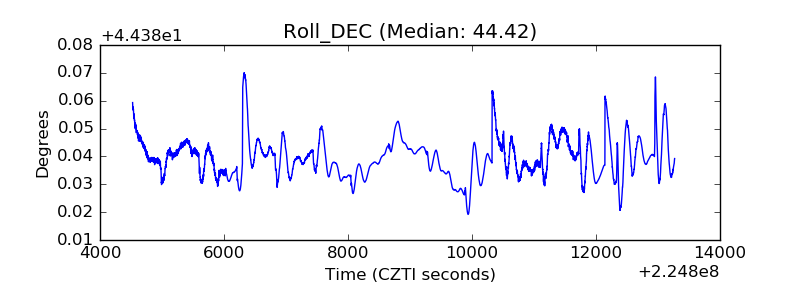 |
| _Roll_RA |  |
| Veto Counter | 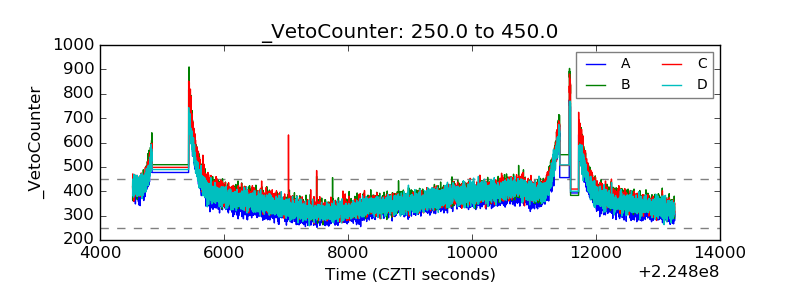 |