| Param | Original file | Final file |
|---|---|---|
| Filename | modeM0/AS1A02_165T03_9000001032_07488cztM0_level2.evt | modeM0/AS1A02_165T03_9000001032_07488cztM0_level2_quad_clean.evt |
| Size (bytes) | 255,375,360 | 59,126,400 |
| Size | 243.5 MB | 56.4 MB |
| Events in quadrant A | 1,803,226 | 375,680 |
| Events in quadrant B | 1,906,490 | 385,940 |
| Events in quadrant C | 1,800,911 | 383,229 |
| Events in quadrant D | 1,952,665 | 366,064 |
| Mode M9 | |||
|---|---|---|---|
| Quadrant | BADHDUFLAG | Total packets | Discarded packets |
| A | 0 | 3 | 0 |
| B | 0 | 3 | 0 |
| C | 0 | 3 | 0 |
| D | 0 | 3 | 0 |
| Mode SS | |||
|---|---|---|---|
| Quadrant | BADHDUFLAG | Total packets | Discarded packets |
| A | 0 | 84 | 0 |
| B | 0 | 84 | 0 |
| C | 0 | 84 | 0 |
| D | 0 | 84 | 0 |
| Mode M0 | |||
|---|---|---|---|
| Quadrant | BADHDUFLAG | Total packets | Discarded packets |
| A | 0 | 8287 | 1 |
| B | 0 | 8492 | 1 |
| C | 0 | 8274 | 1 |
| D | 0 | 8829 | 1 |
| Quadrant | Total seconds | Saturated seconds | Saturation percentage |
|---|---|---|---|
| A | 3954 | 39 | 0.986343% |
| B | 3954 | 57 | 1.441578% |
| C | 3954 | 27 | 0.682853% |
| D | 3954 | 58 | 1.466869% |
Noise dominated data is calculated using 1-second bins in cleaned event files. If a bin has >2000 counts, and if more than 50% of those come from <1% of pixels, then it is considered to be noise-dominated and hence unusable.
| Quadrant | # 1 sec bins | Bins with >0 counts | Bins with >2000 counts | High rate bins dominated by noise | Noise dominated (total time) | Noise dominated (detector-on time) | Marked lightcurve |
|---|---|---|---|---|---|---|---|
| A | 4239 | 3956 | 0 | 0 | 0.00% | 0.00% | 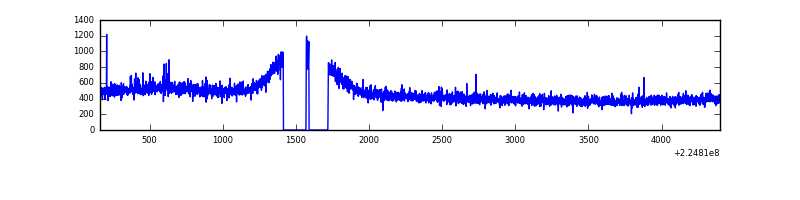 |
| B | 4239 | 3956 | 4 | 4 | 0.09% | 0.10% | 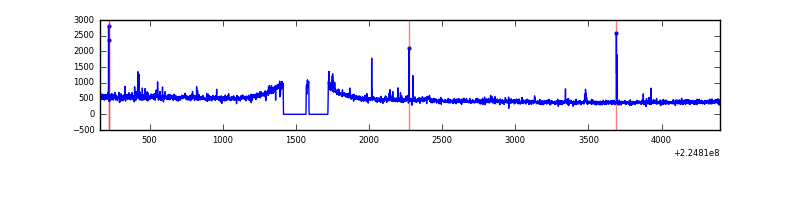 |
| C | 4239 | 3956 | 0 | 0 | 0.00% | 0.00% |  |
| D | 4239 | 3956 | 16 | 16 | 0.38% | 0.40% |  |
Top three noisy pixels from each quadrant. If the there are fewer than three noisy pixels in the level2.evt file, extra rows are filled as -1
| Pixel properties | Quadrant properties | ||||||
|---|---|---|---|---|---|---|---|
| Quadrant | DetID | PixID | Counts | Sigma | Mean | Median | Sigma |
| A | 15 | 234 | 8491 | 83.56 | 464 | 454 | 96.2 |
| A | 15 | 239 | 5799 | 55.57 | 464 | 454 | 96.2 |
| A | 0 | 226 | 4251 | 39.48 | 464 | 454 | 96.2 |
| B | 0 | 214 | 31370 | 331.05 | 472 | 458 | 93.4 |
| B | 4 | 173 | 15114 | 156.96 | 472 | 458 | 93.4 |
| B | 4 | 81 | 12447 | 128.4 | 472 | 458 | 93.4 |
| C | 10 | 22 | 4978 | 41.38 | 459 | 460 | 109.2 |
| C | 12 | 4 | 4153 | 33.82 | 459 | 460 | 109.2 |
| C | 13 | 61 | 3446 | 27.35 | 459 | 460 | 109.2 |
| D | 2 | 14 | 77516 | 689.75 | 452 | 437 | 111.7 |
| D | 2 | 136 | 53264 | 472.73 | 452 | 437 | 111.7 |
| D | 1 | 52 | 41888 | 370.93 | 452 | 437 | 111.7 |
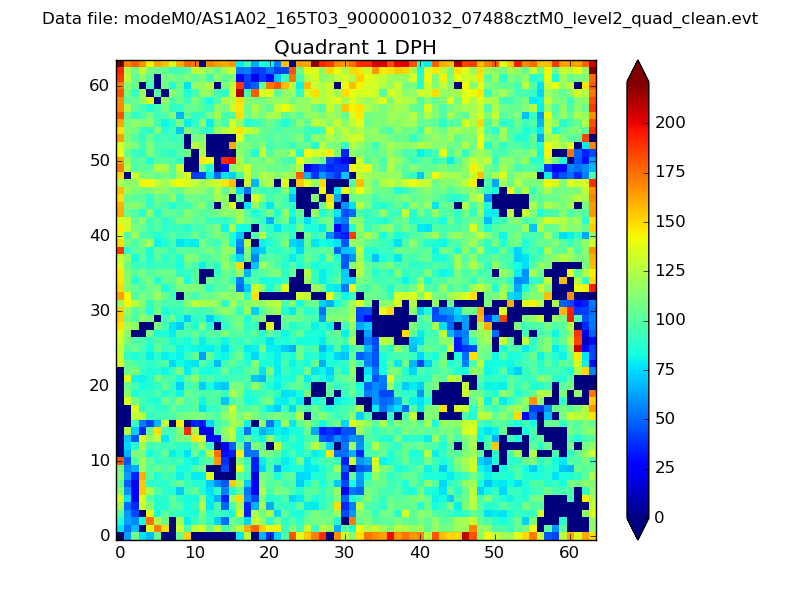
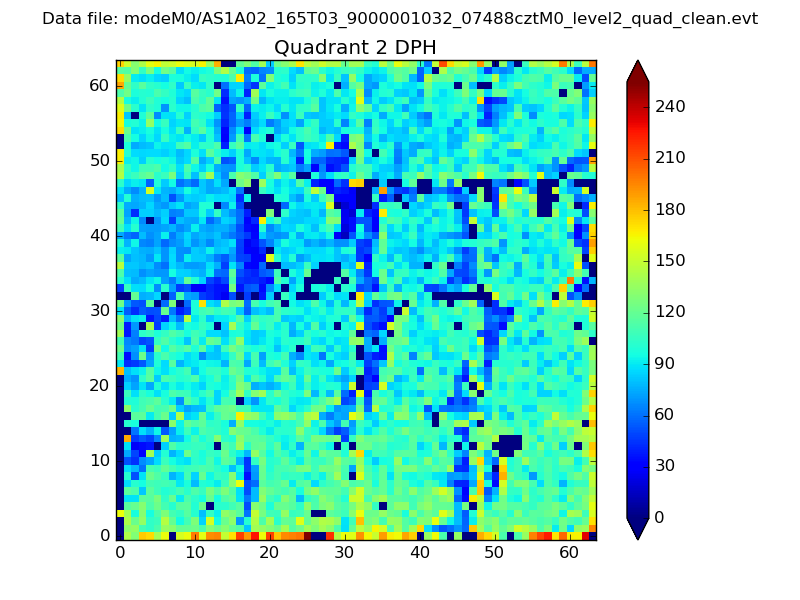
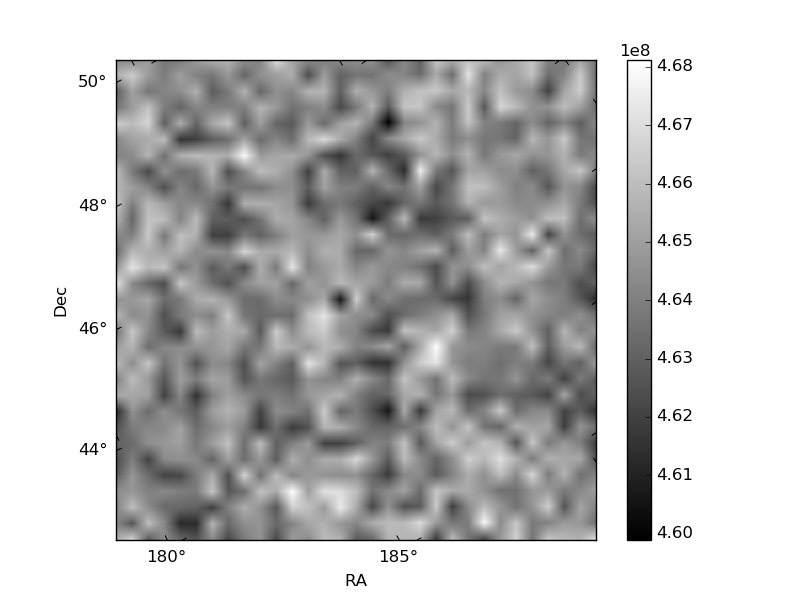
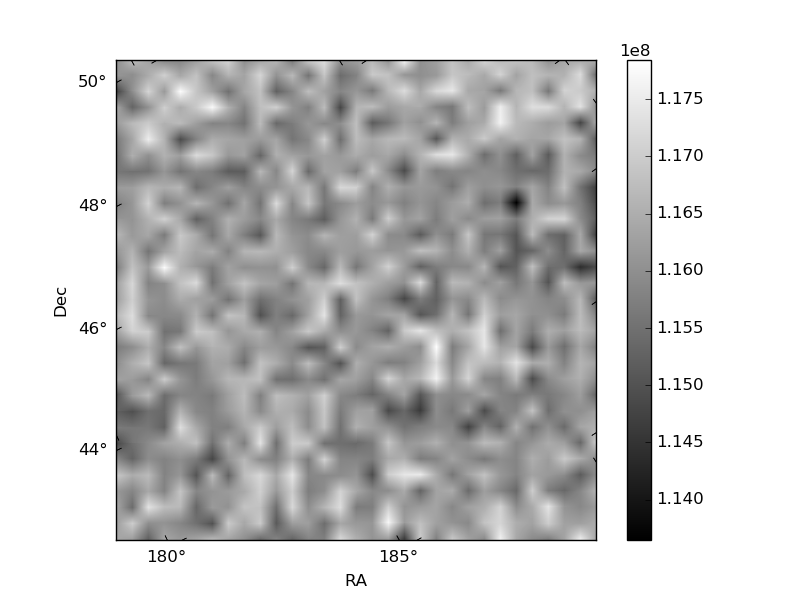
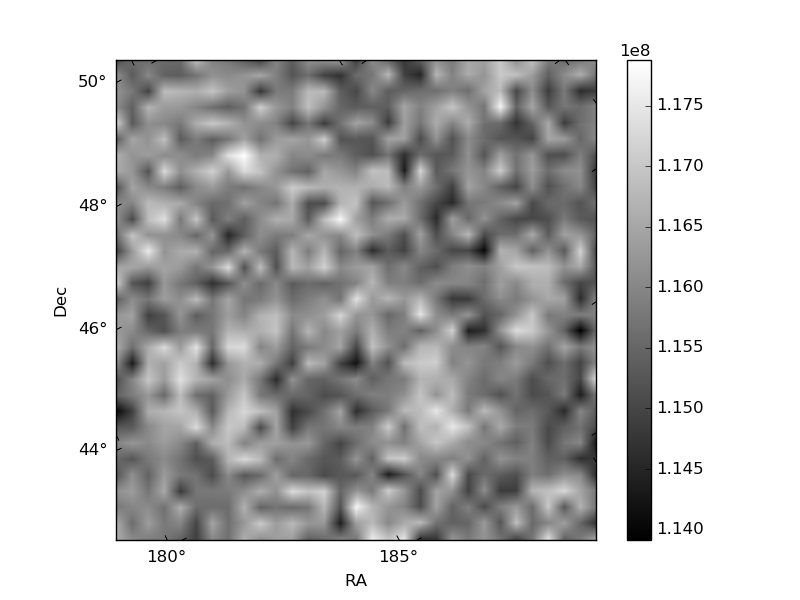
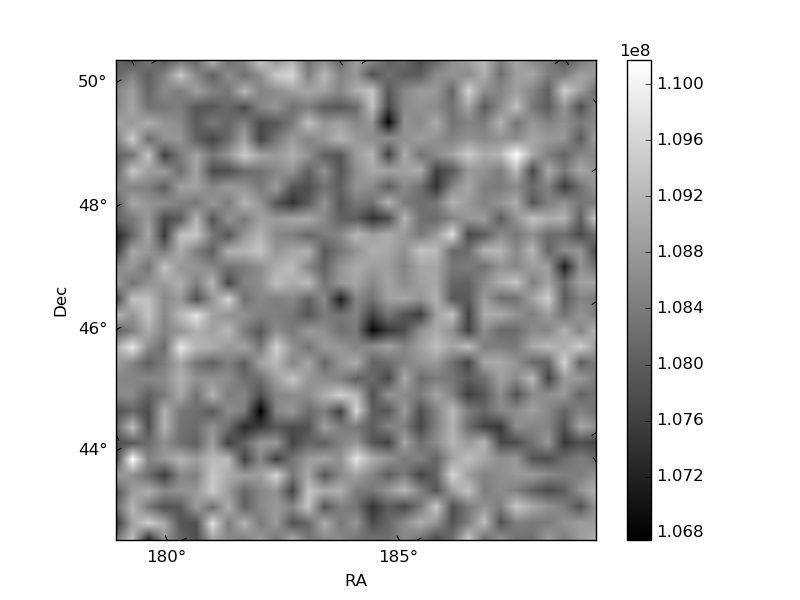
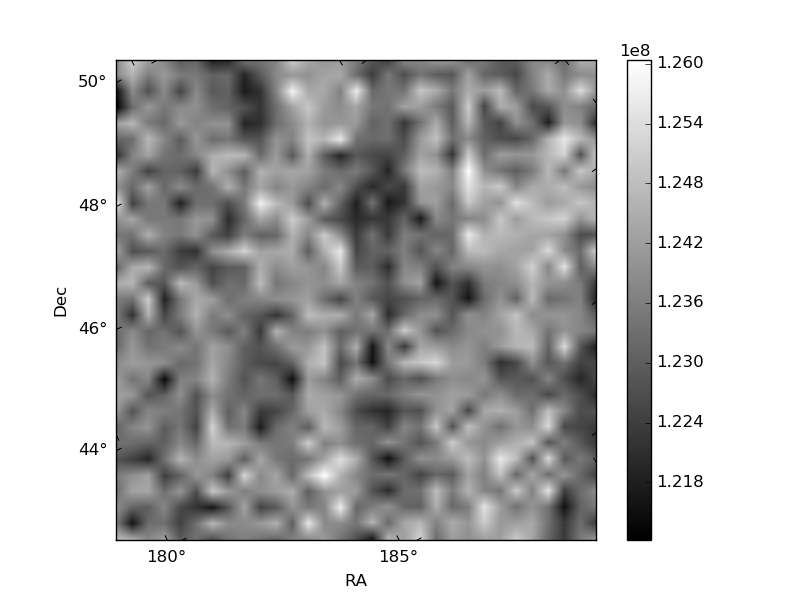
Histogram calculated using DETX and DETY for each event in the final _common_clean file
| Quadrant A | 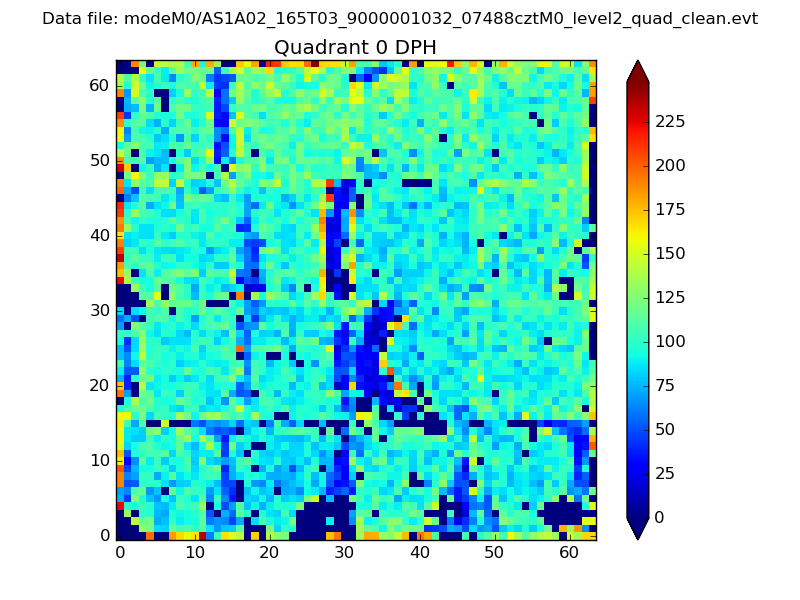 |
 |
Quadrant B |
|---|---|---|---|
| Quadrant D | 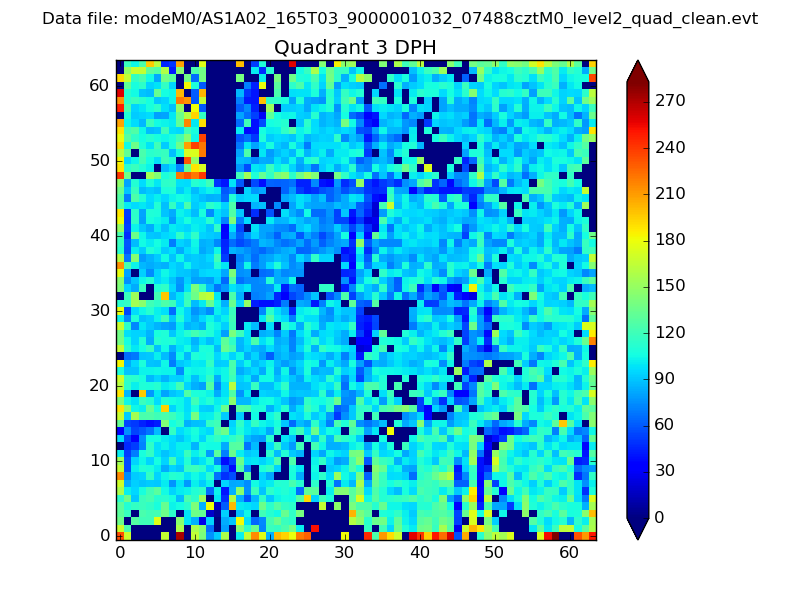 |
 |
Quadrant C |
| Plot type | Count rate plots | Images |
|---|---|---|
| Comparison with Poisson distribution Blue bars denote a histogram of data divided into 1 sec bins. Red curve is a Poisson curve with rate = median count rate of data. |
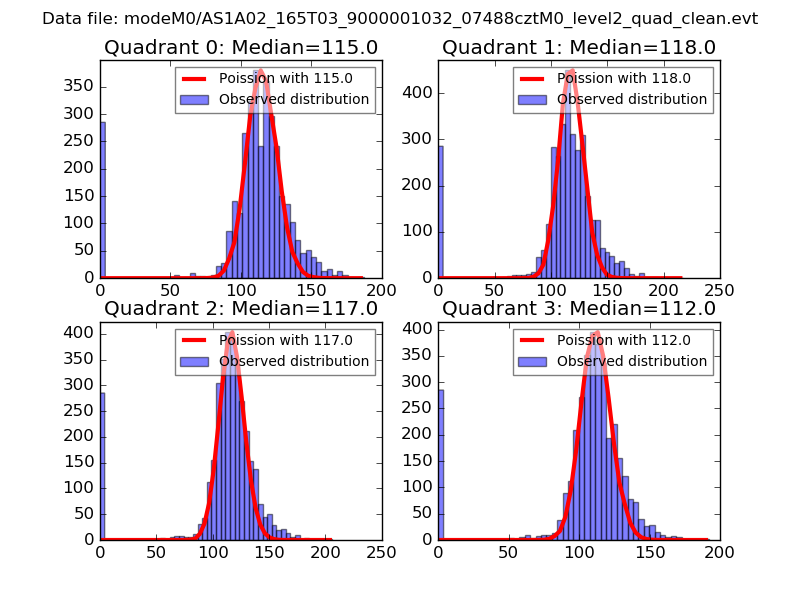 |
 |
| Quadrant-wise count rates Data is divided into 100 sec bins |
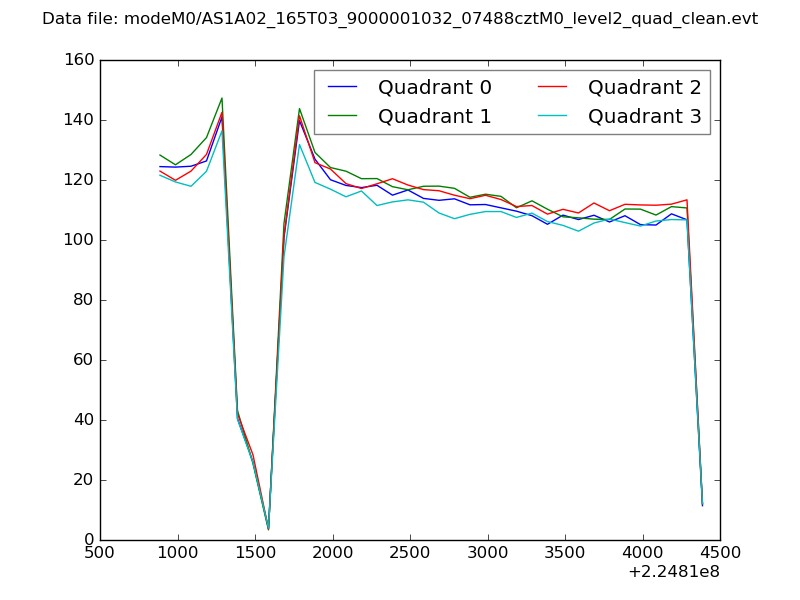 |
|
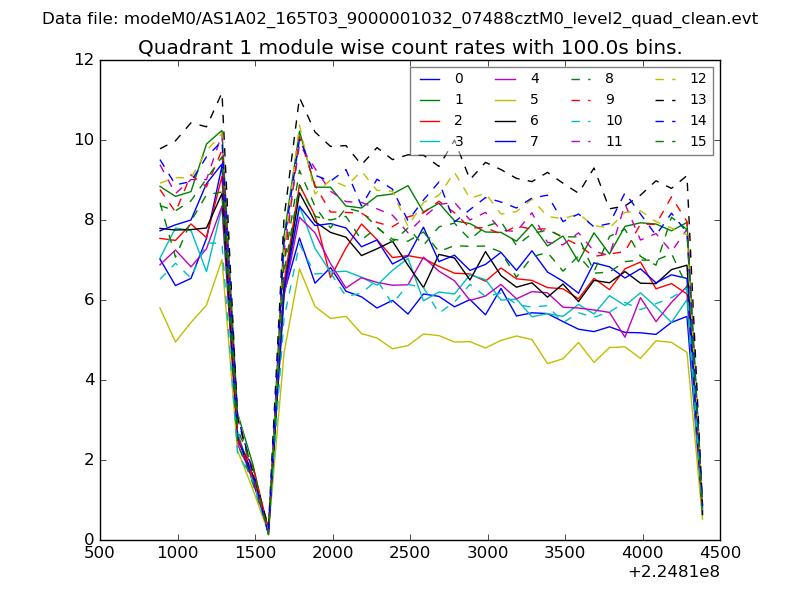
| Module-wise count rates for Quadrant A Data is divided into 100 sec bins |
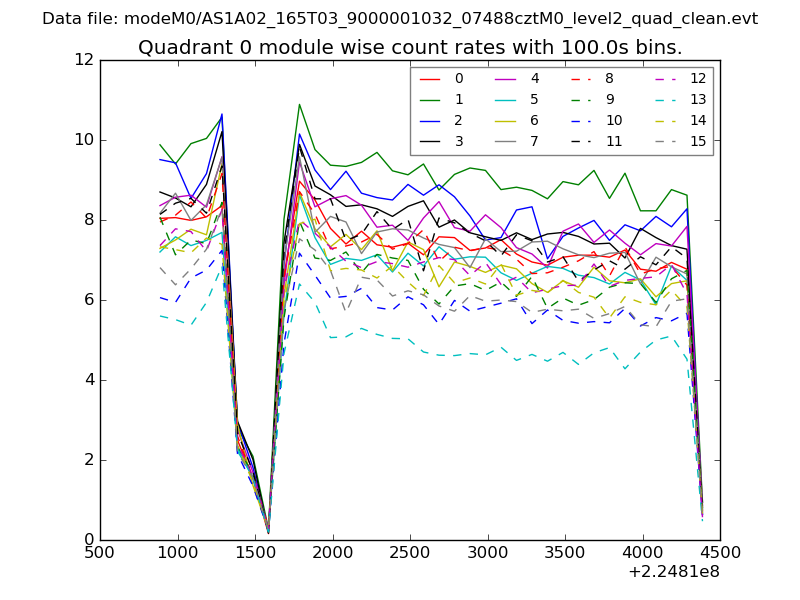 |
 |
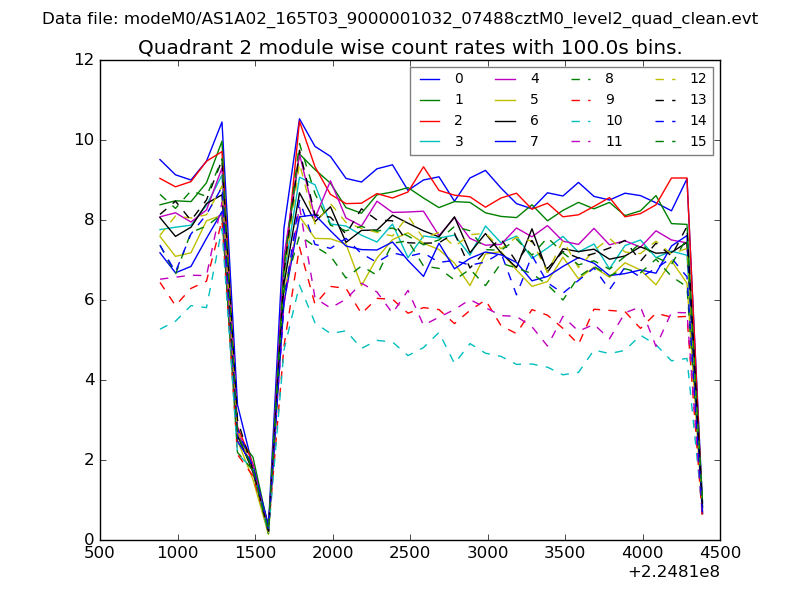
| Module-wise count rates for Quadrant B Data is divided into 100 sec bins |
 |
 |
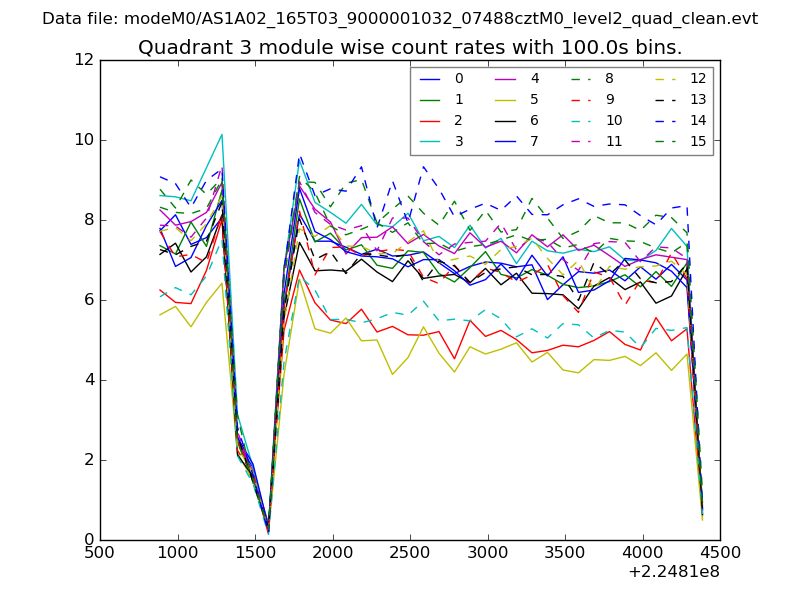
| Module-wise count rates for Quadrant C Data is divided into 100 sec bins |
 |
 |
| Module-wise count rates for Quadrant D Data is divided into 100 sec bins |
 |
 |
| Parameter | Plot |
|---|---|
| CZT HV Monitor | 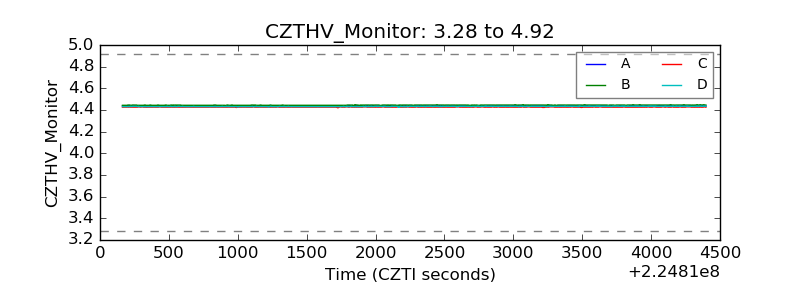 |
| D_VDD | 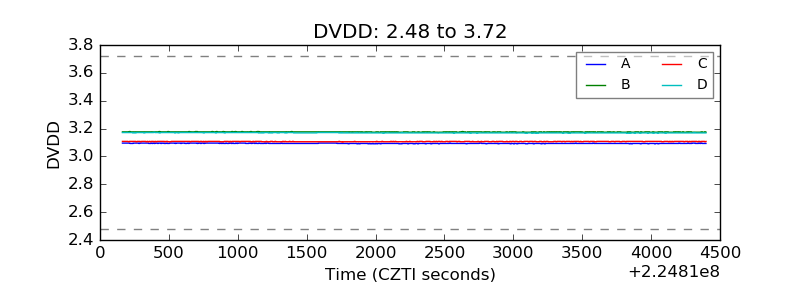 |
| Temperature 1 | 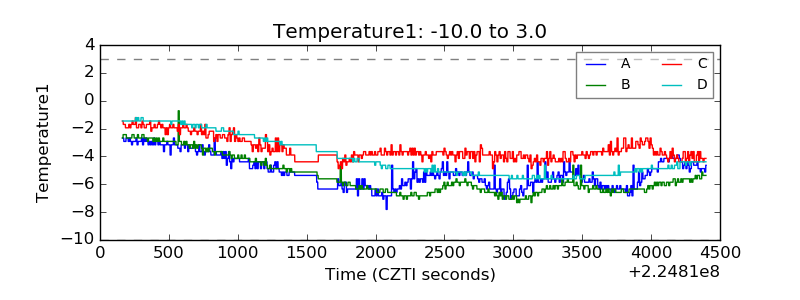 |
| Veto HV Monitor |  |
| Veto LLD | 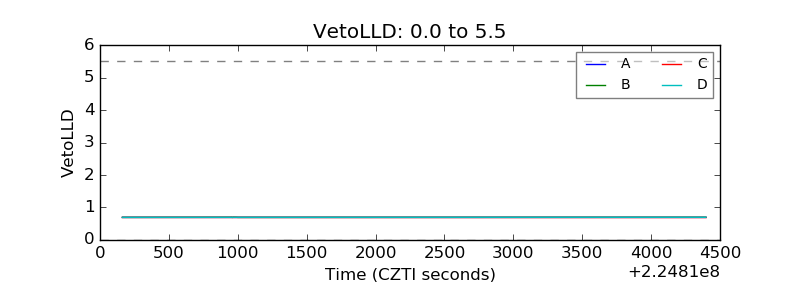 |
| Alpha Counter | 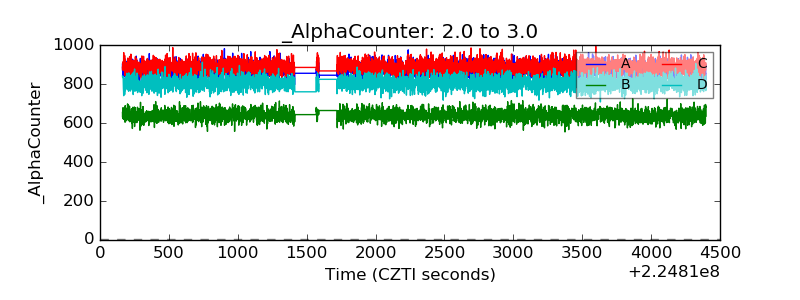 |
| _CPM_Rate | 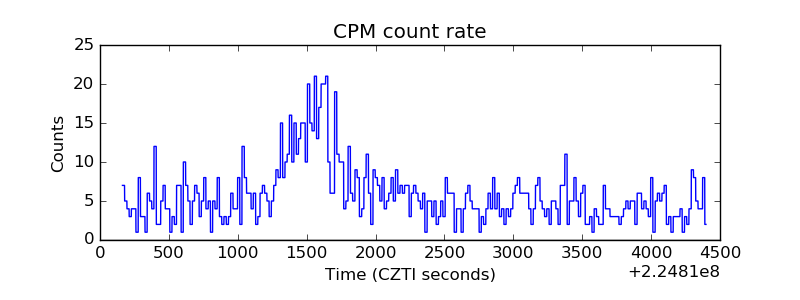 |
| CZT Counter | 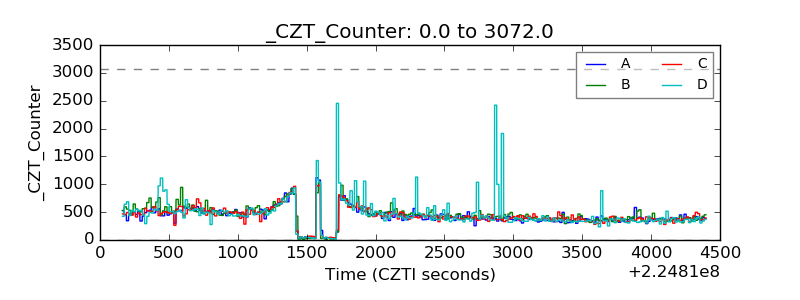 |
| +2.5 Volts monitor |  |
| +5 Volts monitor |  |
| _ROLL_ROT | 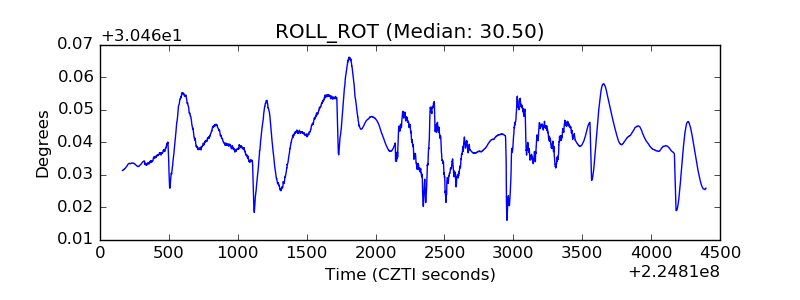 |
| _Roll_DEC |  |
| _Roll_RA | 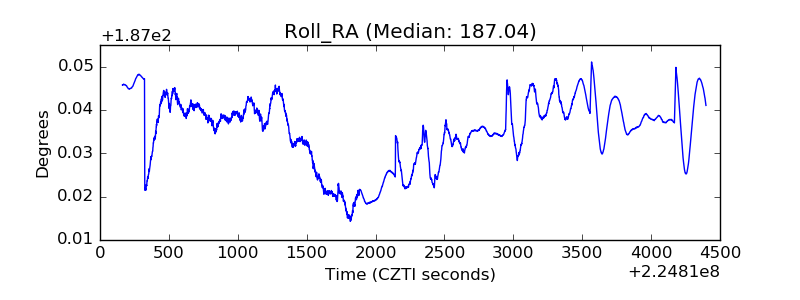 |
| Veto Counter | 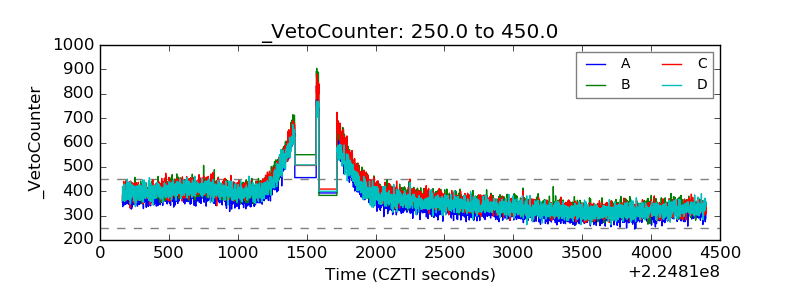 |