| Param | Original file | Final file |
|---|---|---|
| Filename | modeM0/AS1G06_087T04_9000001028cztM0_level2.fits | modeM0/AS1G06_087T04_9000001028cztM0_level2_quad_clean.evt |
| Size (bytes) | 19,549,440 | 6,413,760 |
| Size | 18.6 MB | 6.1 MB |
| Events in quadrant A | 122,866 | 18,253 |
| Events in quadrant B | 119,200 | 18,546 |
| Events in quadrant C | 123,310 | 17,592 |
| Events in quadrant D | 104,294 | 16,030 |
| Mode M0 | |||
|---|---|---|---|
| Quadrant | BADHDUFLAG | Total packets | Discarded packets |
| A | 0 | 3763 | 0 |
| B | 0 | 3927 | 0 |
| C | 0 | 3637 | 0 |
| D | 0 | 4940 | 0 |
| Mode SS | |||
|---|---|---|---|
| Quadrant | BADHDUFLAG | Total packets | Discarded packets |
| A | 0 | 34 | 0 |
| B | 0 | 34 | 0 |
| C | 0 | 34 | 0 |
| D | 0 | 34 | 0 |
| Mode M9 | |||
|---|---|---|---|
| Quadrant | BADHDUFLAG | Total packets | Discarded packets |
| A | 0 | 10 | 0 |
| B | 0 | 10 | 0 |
| C | 0 | 10 | 0 |
| D | 0 | 11 | 0 |
| Quadrant | Total seconds | Saturated seconds | Saturation percentage |
|---|---|---|---|
| A | 1667 | 13 | 0.779844% |
| B | 1667 | 8 | 0.479904% |
| C | 1667 | 7 | 0.419916% |
| D | 1667 | 89 | 5.338932% |
Noise dominated data is calculated using 1-second bins in cleaned event files. If a bin has >2000 counts, and if more than 50% of those come from <1% of pixels, then it is considered to be noise-dominated and hence unusable.
| Quadrant | # 1 sec bins | Bins with >0 counts | Bins with >2000 counts | High rate bins dominated by noise | Noise dominated (total time) | Noise dominated (detector-on time) | Marked lightcurve |
|---|---|---|---|---|---|---|---|
| A | 1666 | 1666 | 0 | 0 | 0.00% | 0.00% |  |
| B | 1666 | 1666 | 0 | 0 | 0.00% | 0.00% |  |
| C | 1666 | 1666 | 0 | 0 | 0.00% | 0.00% |  |
| D | 1665 | 1665 | 0 | 0 | 0.00% | 0.00% |  |
Top three noisy pixels from each quadrant. If the there are fewer than three noisy pixels in the level2.evt file, extra rows are filled as -1
| Pixel properties | Quadrant properties | ||||||
|---|---|---|---|---|---|---|---|
| Quadrant | DetID | PixID | Counts | Sigma | Mean | Median | Sigma |
| A | 14 | 204 | 124 | 9.83 | 32 | 30 | 9.6 |
| A | 14 | 188 | 121 | 9.51 | 32 | 30 | 9.6 |
| A | 0 | 29 | 113 | 8.68 | 32 | 30 | 9.6 |
| B | 5 | 225 | 99 | 8.33 | 31 | 30 | 8.3 |
| B | 2 | 9 | 87 | 6.88 | 31 | 30 | 8.3 |
| B | 5 | 128 | 80 | 6.04 | 31 | 30 | 8.3 |
| C | 9 | 233 | 96 | 6.49 | 32 | 31 | 10.0 |
| C | 12 | 241 | 85 | 5.39 | 32 | 31 | 10.0 |
| C | 9 | 236 | 82 | 5.09 | 32 | 31 | 10.0 |
| D | 10 | 189 | 94 | 7.49 | 29 | 27 | 8.9 |
| D | 4 | 160 | 80 | 5.93 | 29 | 27 | 8.9 |
| D | 15 | 78 | 77 | 5.59 | 29 | 27 | 8.9 |
Histogram calculated using DETX and DETY for each event in the final _common_clean file
| Quadrant A |  |
 |
Quadrant B |
|---|---|---|---|
| Quadrant D | 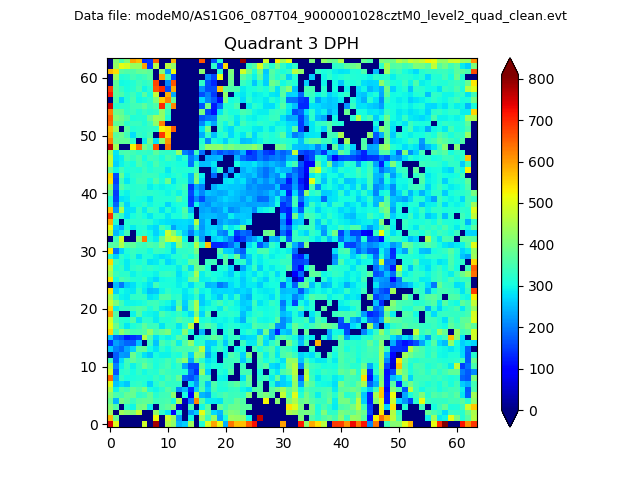 |
 |
Quadrant C |
| Plot type | Count rate plots | Images |
|---|---|---|
| Comparison with Poisson distribution Blue bars denote a histogram of data divided into 1 sec bins. Red curve is a Poisson curve with rate = median count rate of data. |
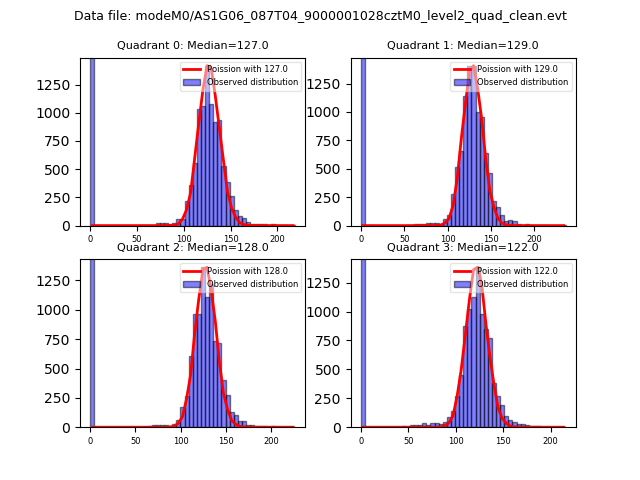 |
 |
| Quadrant-wise count rates Data is divided into 100 sec bins |
 |
|
| Module-wise count rates for Quadrant A Data is divided into 100 sec bins |
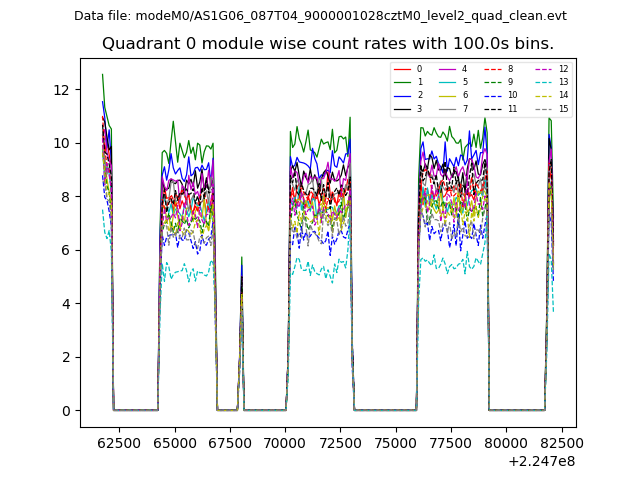 |
 |
| Module-wise count rates for Quadrant B Data is divided into 100 sec bins |
 |
 |
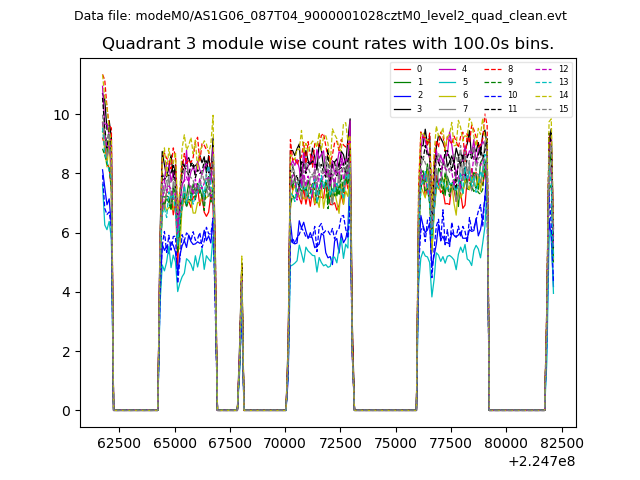
| Module-wise count rates for Quadrant C Data is divided into 100 sec bins |
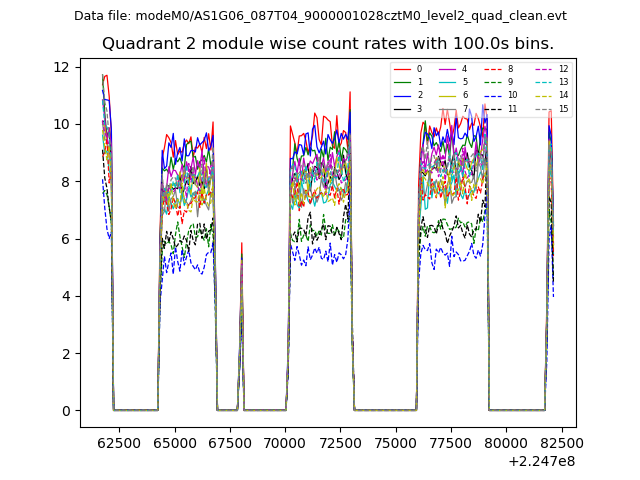 |
 |
| Module-wise count rates for Quadrant D Data is divided into 100 sec bins |
 |
 |
| Parameter | Plot |
|---|---|
| CZT HV Monitor |  |
| D_VDD |  |
| Temperature 1 |  |
| Veto HV Monitor |  |
| Veto LLD |  |
| Alpha Counter |  |
| _CPM_Rate |  |
| CZT Counter | 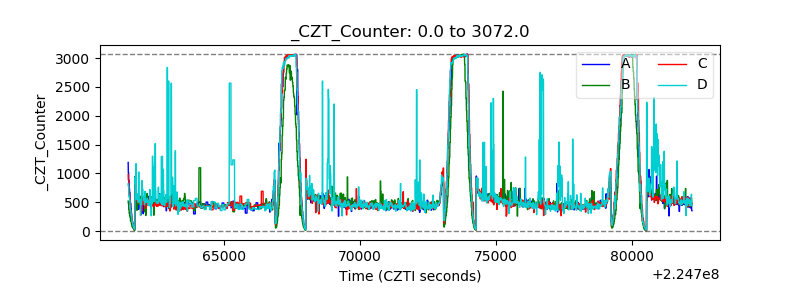 |
| +2.5 Volts monitor |  |
| +5 Volts monitor |  |
| _ROLL_ROT | 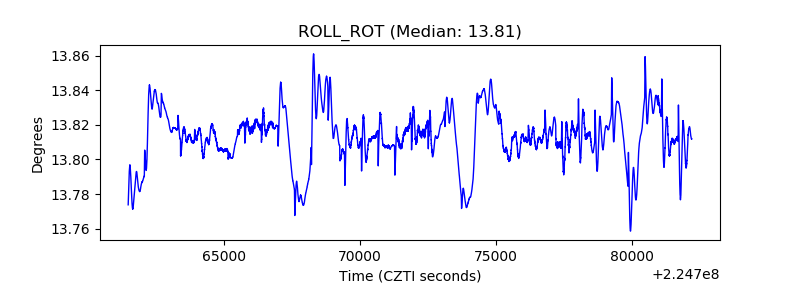 |
| _Roll_DEC |  |
| _Roll_RA |  |
| Veto Counter |  |