| Param | Original file | Final file |
|---|---|---|
| Filename | modeM0/AS1G06_087T04_9000001028_07480cztM0_level2.evt | modeM0/AS1G06_087T04_9000001028_07480cztM0_level2_quad_clean.evt |
| Size (bytes) | 464,944,320 | 66,620,160 |
| Size | 443.4 MB | 63.5 MB |
| Events in quadrant A | 3,223,196 | 390,287 |
| Events in quadrant B | 3,389,483 | 397,146 |
| Events in quadrant C | 3,148,414 | 392,657 |
| Events in quadrant D | 3,867,226 | 372,432 |
| Mode M0 | |||
|---|---|---|---|
| Quadrant | BADHDUFLAG | Total packets | Discarded packets |
| A | 0 | 13878 | 3 |
| B | 0 | 14249 | 2 |
| C | 0 | 13689 | 2 |
| D | 0 | 15986 | 2 |
| Mode SS | |||
|---|---|---|---|
| Quadrant | BADHDUFLAG | Total packets | Discarded packets |
| A | 0 | 134 | 0 |
| B | 0 | 134 | 0 |
| C | 0 | 134 | 0 |
| D | 0 | 134 | 0 |
| Mode M9 | |||
|---|---|---|---|
| Quadrant | BADHDUFLAG | Total packets | Discarded packets |
| A | 0 | 14 | 0 |
| B | 0 | 14 | 0 |
| C | 0 | 14 | 0 |
| D | 0 | 15 | 0 |
| Quadrant | Total seconds | Saturated seconds | Saturation percentage |
|---|---|---|---|
| A | 6666 | 58 | 0.870087% |
| B | 6666 | 60 | 0.900090% |
| C | 6666 | 42 | 0.630063% |
| D | 6666 | 186 | 2.790279% |
Noise dominated data is calculated using 1-second bins in cleaned event files. If a bin has >2000 counts, and if more than 50% of those come from <1% of pixels, then it is considered to be noise-dominated and hence unusable.
| Quadrant | # 1 sec bins | Bins with >0 counts | Bins with >2000 counts | High rate bins dominated by noise | Noise dominated (total time) | Noise dominated (detector-on time) | Marked lightcurve |
|---|---|---|---|---|---|---|---|
| A | 7796 | 6666 | 0 | 0 | 0.00% | 0.00% | 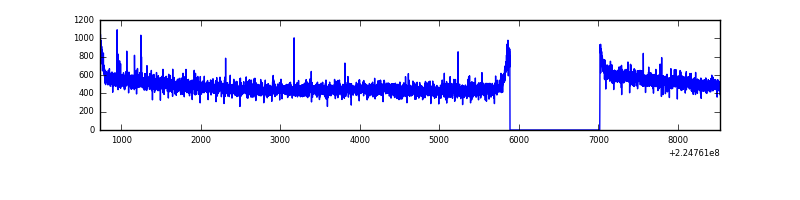 |
| B | 7796 | 6666 | 3 | 3 | 0.04% | 0.05% | 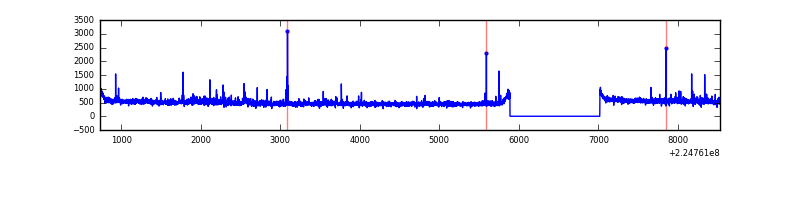 |
| C | 7796 | 6667 | 0 | 0 | 0.00% | 0.00% | 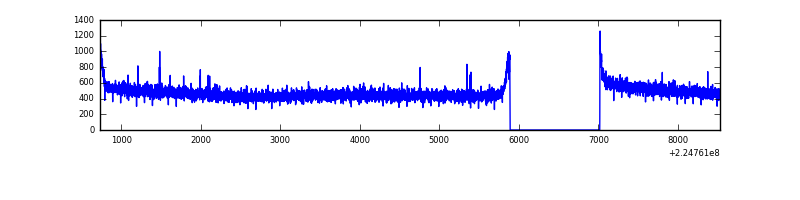 |
| D | 7796 | 6667 | 121 | 121 | 1.55% | 1.81% | 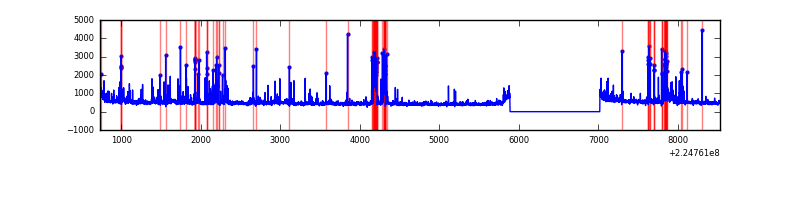 |
Top three noisy pixels from each quadrant. If the there are fewer than three noisy pixels in the level2.evt file, extra rows are filled as -1
| Pixel properties | Quadrant properties | ||||||
|---|---|---|---|---|---|---|---|
| Quadrant | DetID | PixID | Counts | Sigma | Mean | Median | Sigma |
| A | 15 | 234 | 11906 | 65.81 | 831 | 813 | 168.6 |
| A | 0 | 226 | 7856 | 41.78 | 831 | 813 | 168.6 |
| A | 12 | 194 | 7503 | 39.69 | 831 | 813 | 168.6 |
| B | 0 | 214 | 94297 | 596.01 | 830 | 812 | 156.9 |
| B | 4 | 48 | 23883 | 147.09 | 830 | 812 | 156.9 |
| B | 4 | 173 | 17975 | 109.42 | 830 | 812 | 156.9 |
| C | 9 | 68 | 10615 | 52.99 | 801 | 805 | 185.1 |
| C | 1 | 16 | 6395 | 30.2 | 801 | 805 | 185.1 |
| C | 13 | 61 | 6182 | 29.05 | 801 | 805 | 185.1 |
| D | 1 | 52 | 406009 | 2068.99 | 798 | 773 | 195.9 |
| D | 2 | 152 | 143276 | 727.57 | 798 | 773 | 195.9 |
| D | 2 | 136 | 103246 | 523.19 | 798 | 773 | 195.9 |
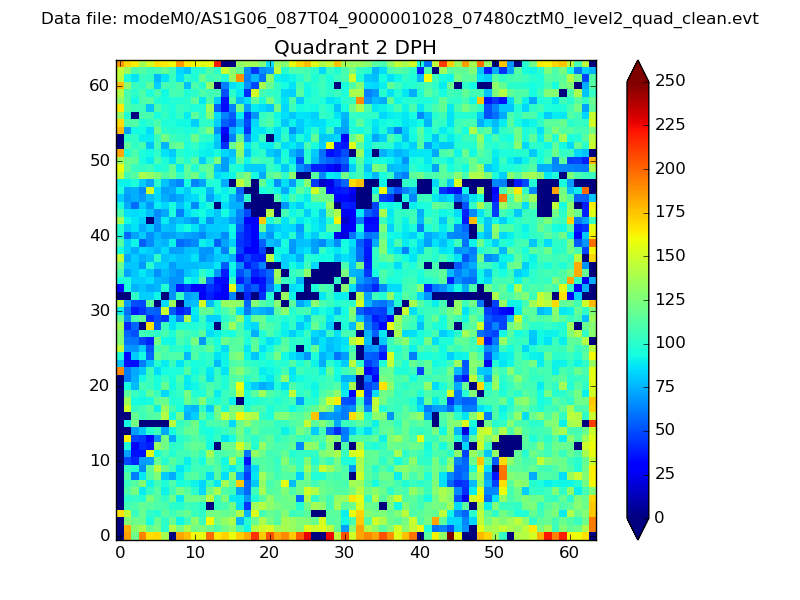
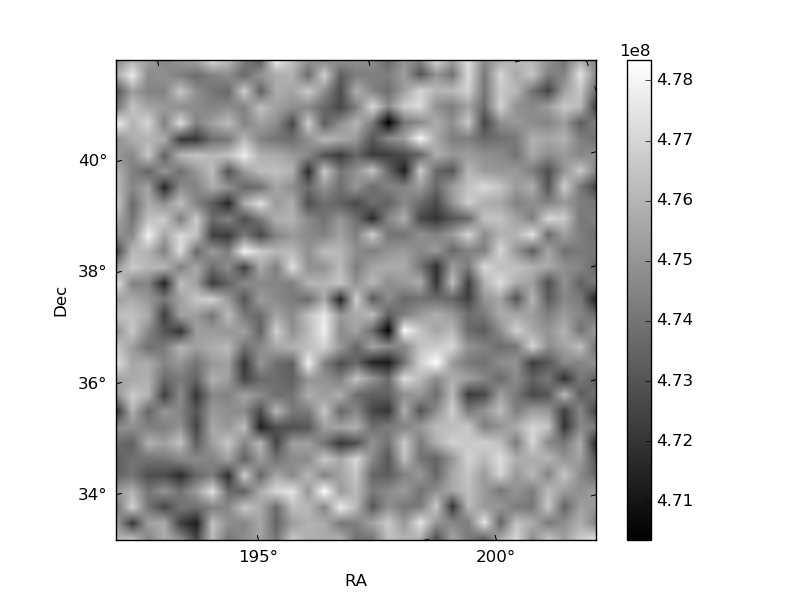
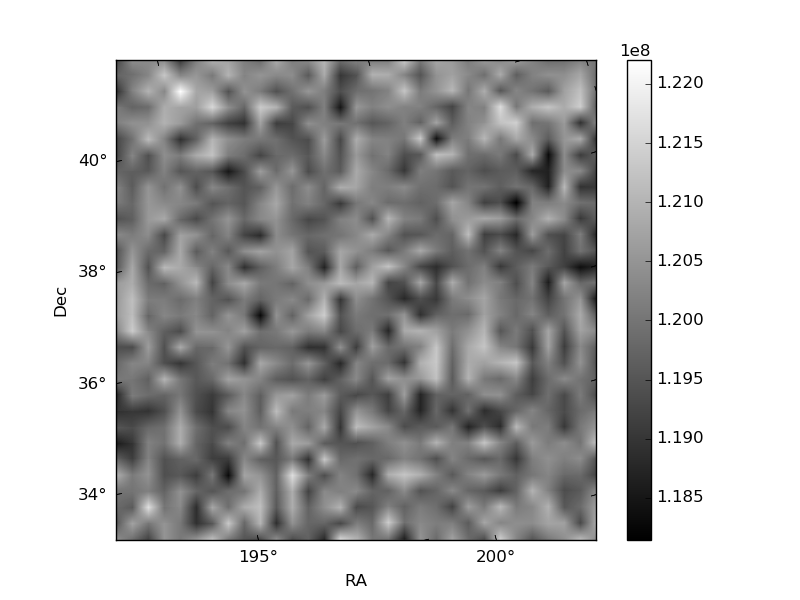
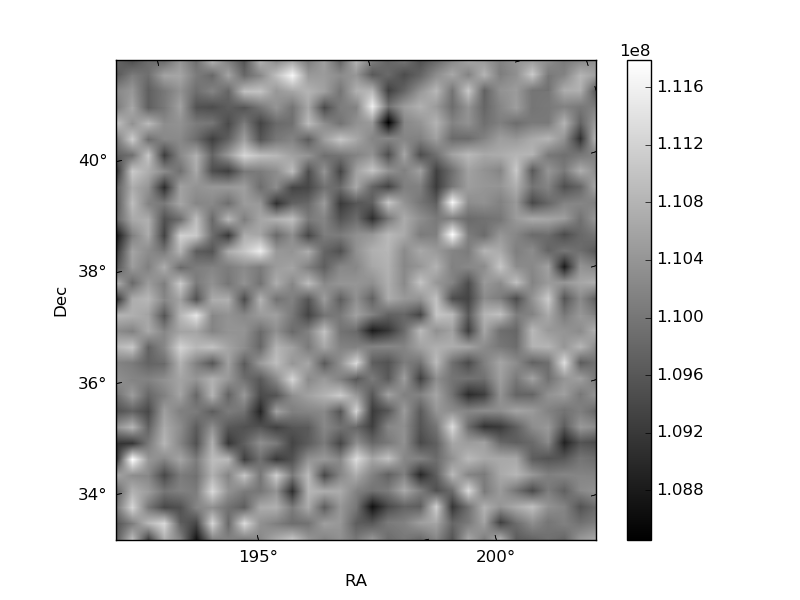
Histogram calculated using DETX and DETY for each event in the final _common_clean file
| Quadrant A | 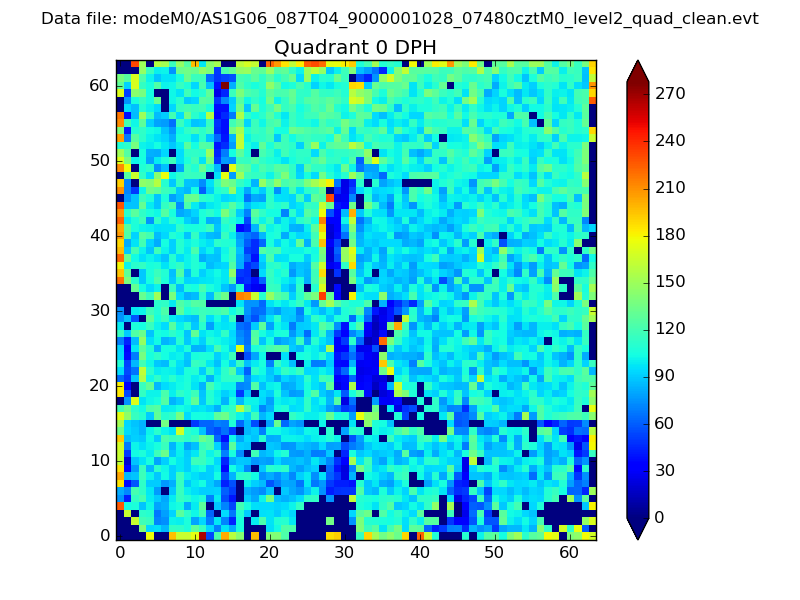 |
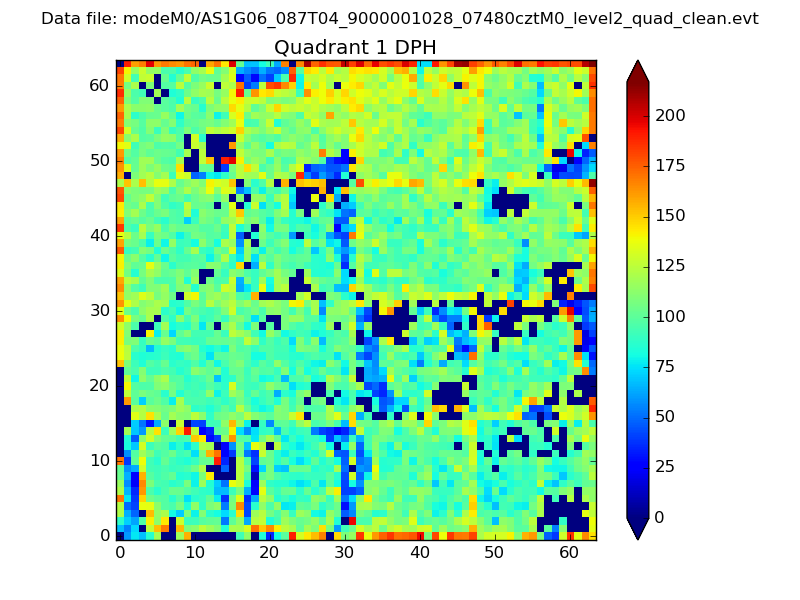 |
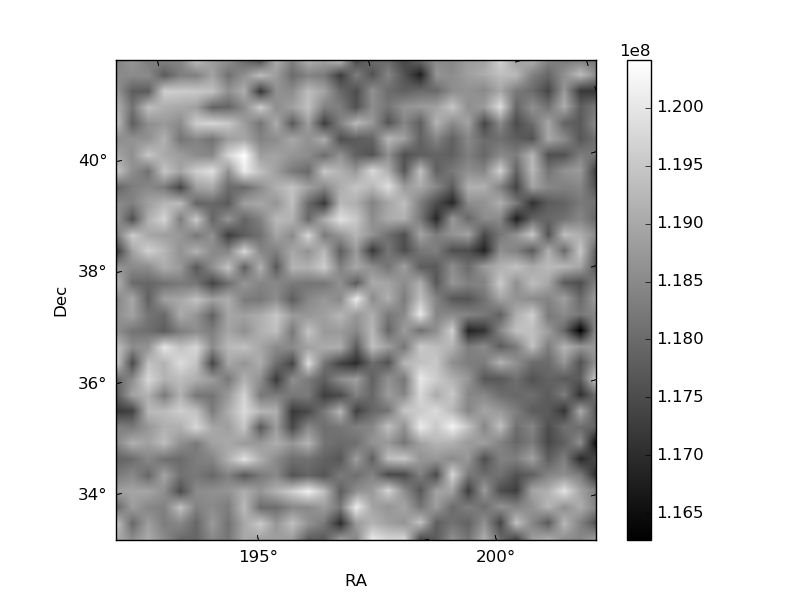
Quadrant B |
|---|---|---|---|
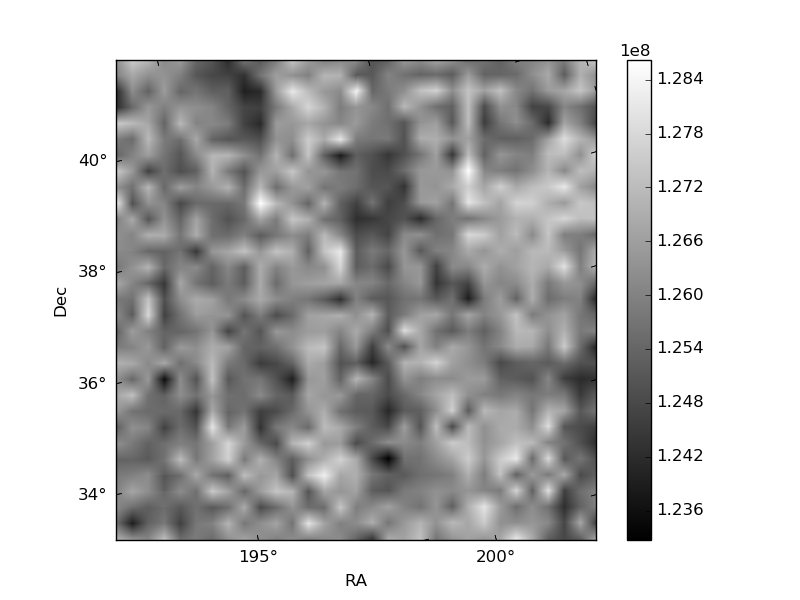
| Quadrant D | 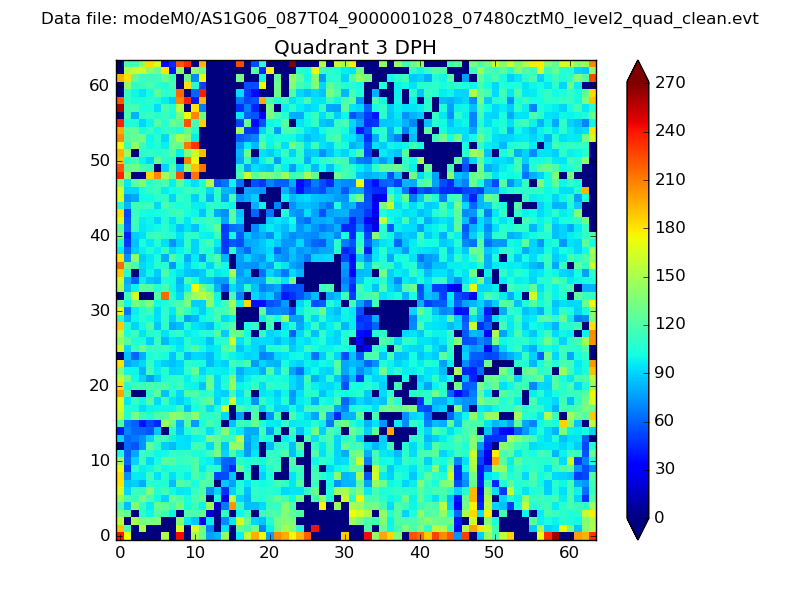 |
 |
Quadrant C |
| Plot type | Count rate plots | Images |
|---|---|---|
| Comparison with Poisson distribution Blue bars denote a histogram of data divided into 1 sec bins. Red curve is a Poisson curve with rate = median count rate of data. |
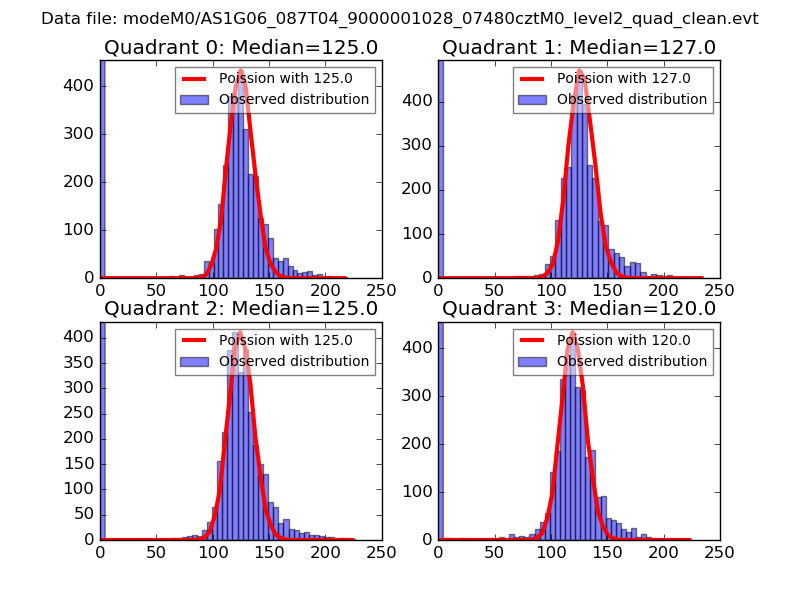 |
 |
| Quadrant-wise count rates Data is divided into 100 sec bins |
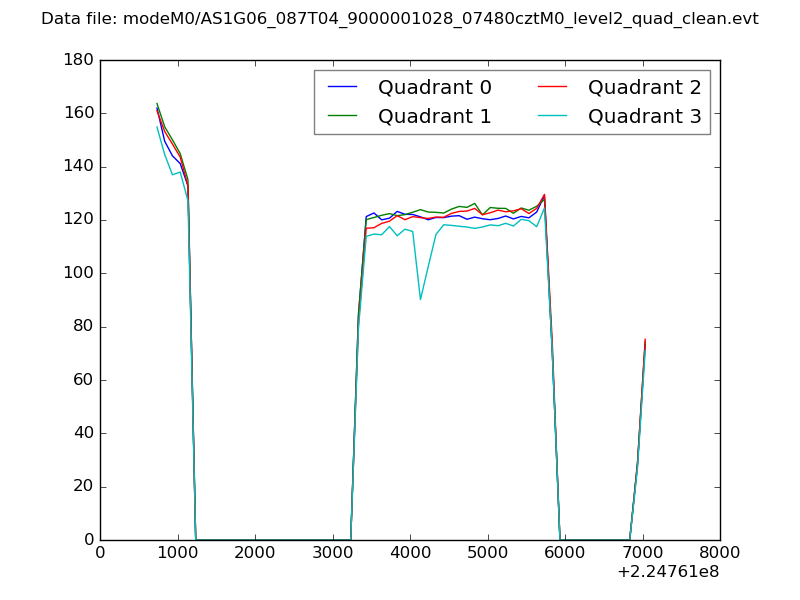 |
|
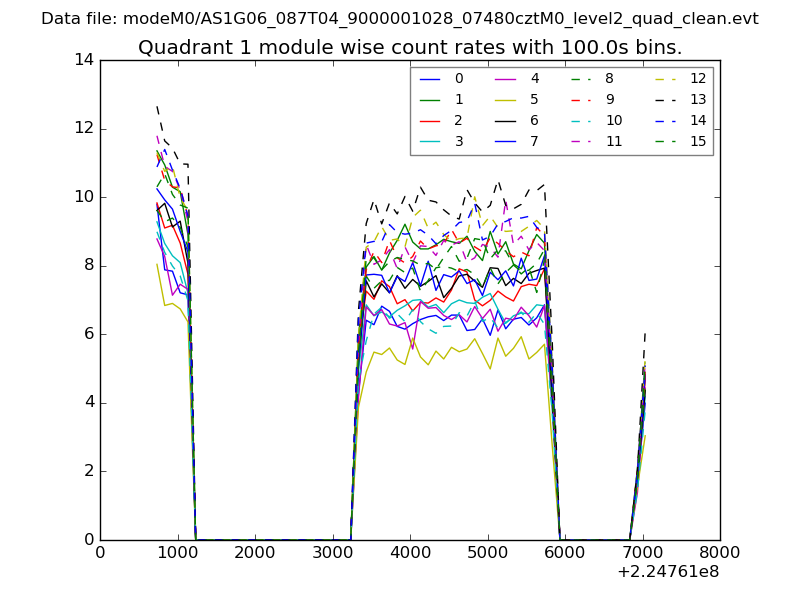
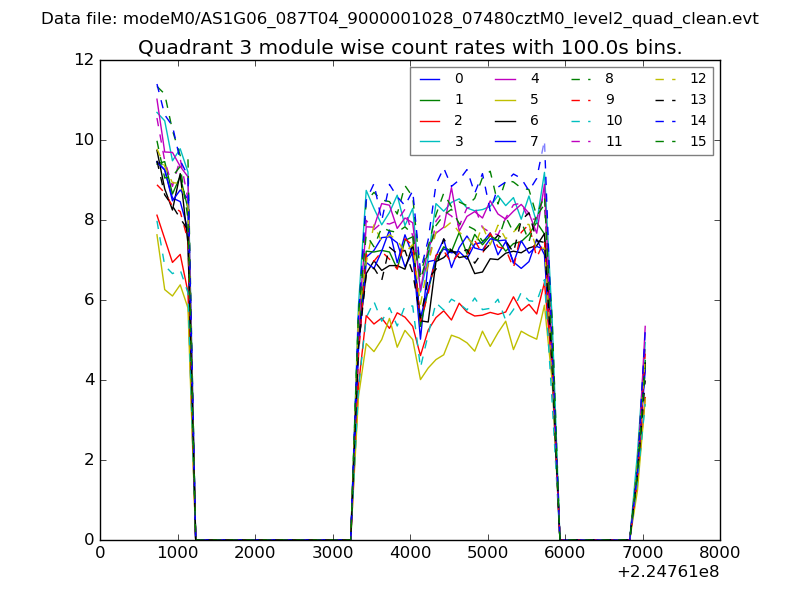
| Module-wise count rates for Quadrant A Data is divided into 100 sec bins |
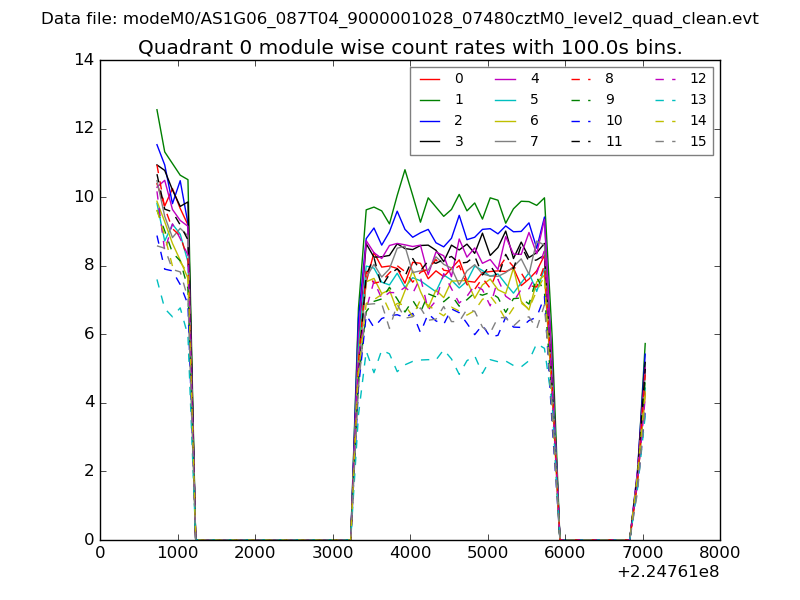 |
 |
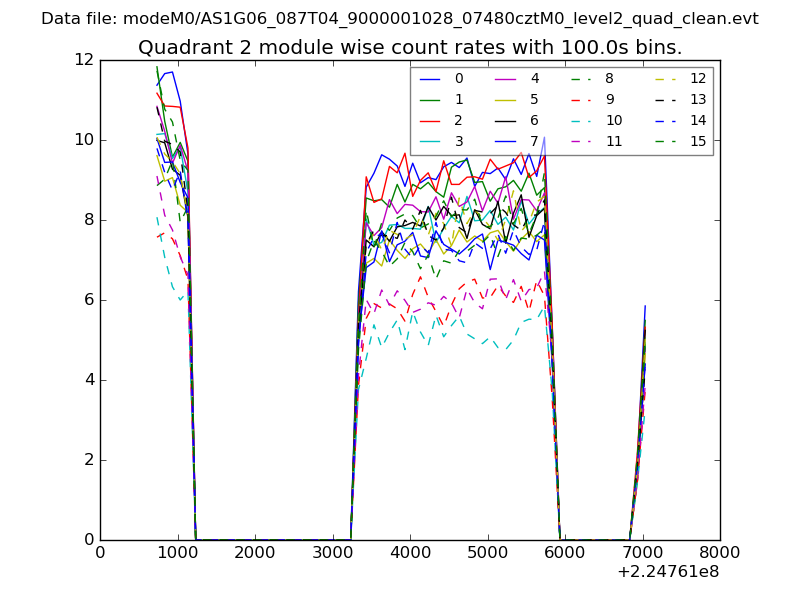
| Module-wise count rates for Quadrant B Data is divided into 100 sec bins |
 |
 |
| Module-wise count rates for Quadrant C Data is divided into 100 sec bins |
 |
 |
| Module-wise count rates for Quadrant D Data is divided into 100 sec bins |
 |
 |
| Parameter | Plot |
|---|---|
| CZT HV Monitor | 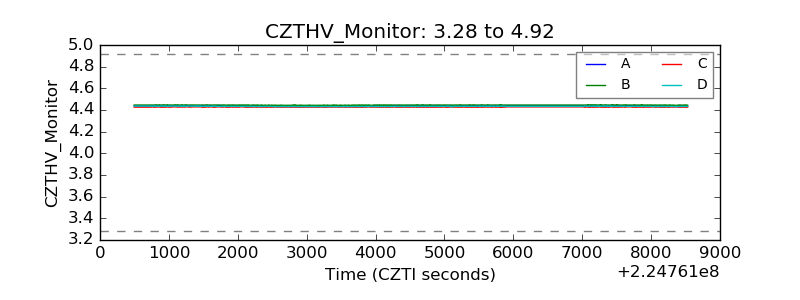 |
| D_VDD | 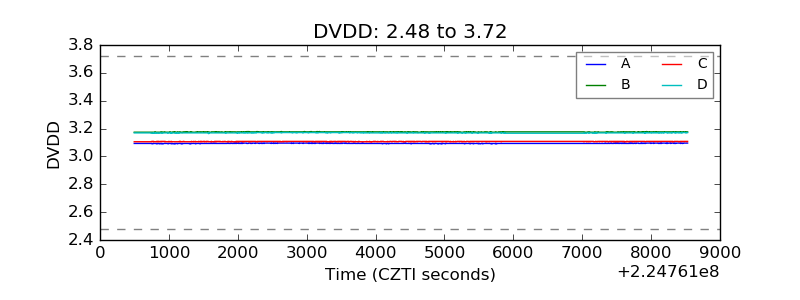 |
| Temperature 1 | 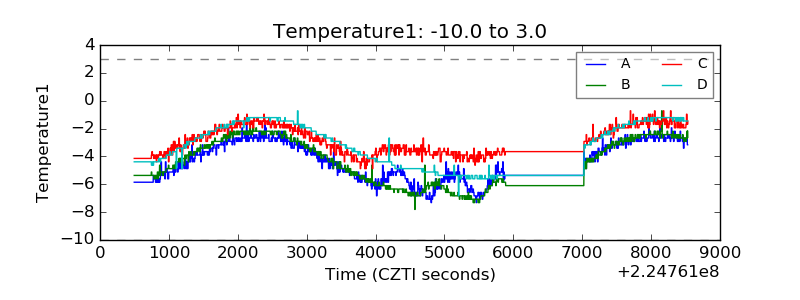 |
| Veto HV Monitor | 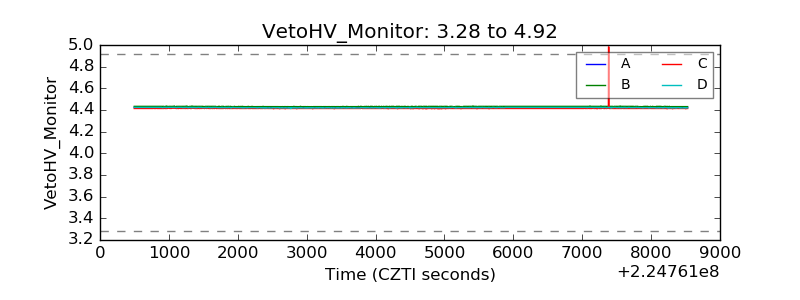 |
| Veto LLD | 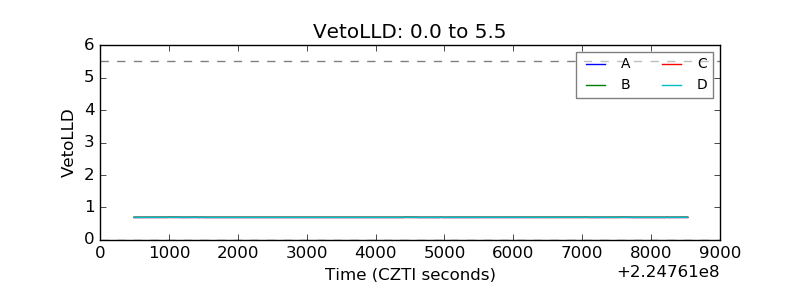 |
| Alpha Counter | 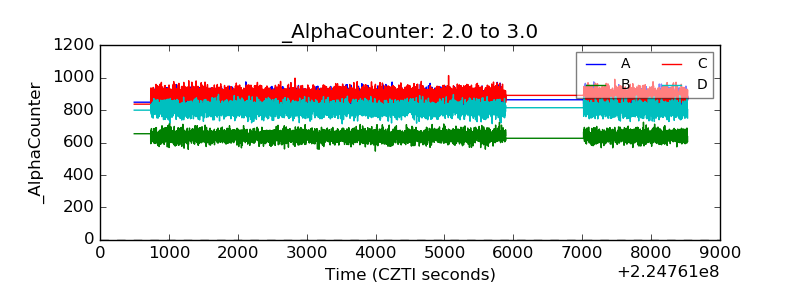 |
| _CPM_Rate | 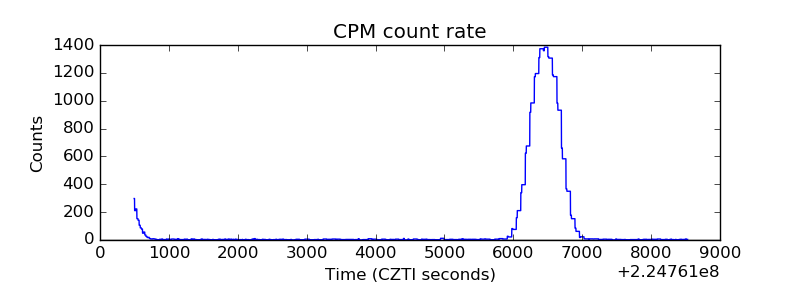 |
| CZT Counter | 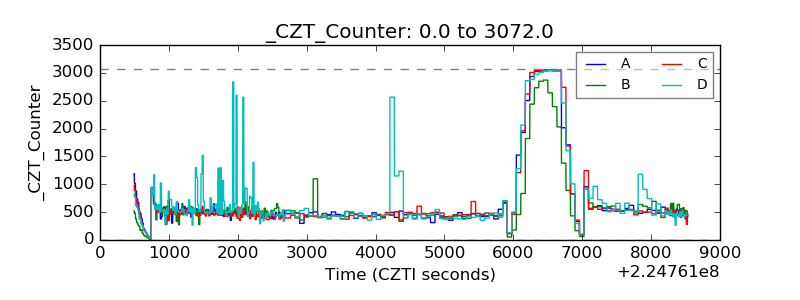 |
| +2.5 Volts monitor |  |
| +5 Volts monitor |  |
| _ROLL_ROT | 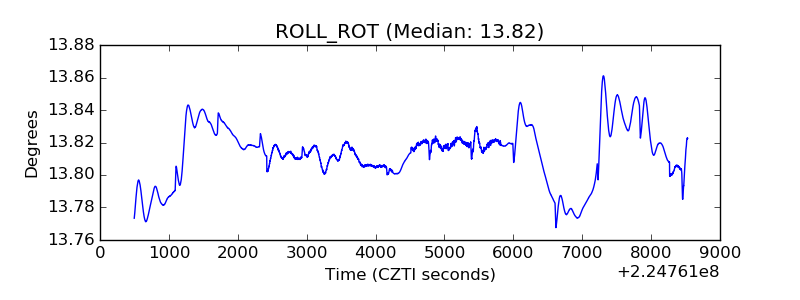 |
| _Roll_DEC | 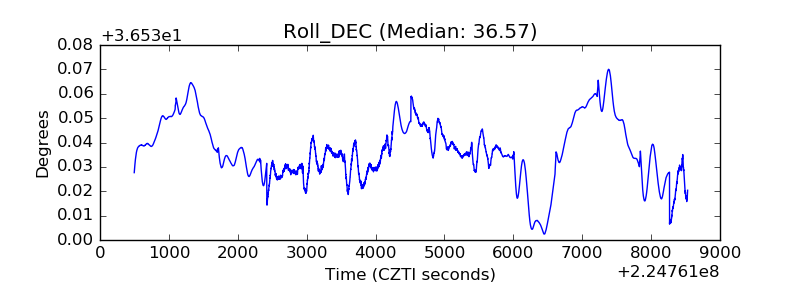 |
| _Roll_RA | 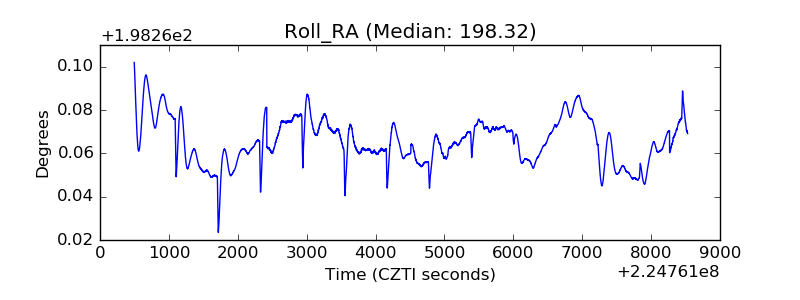 |
| Veto Counter | 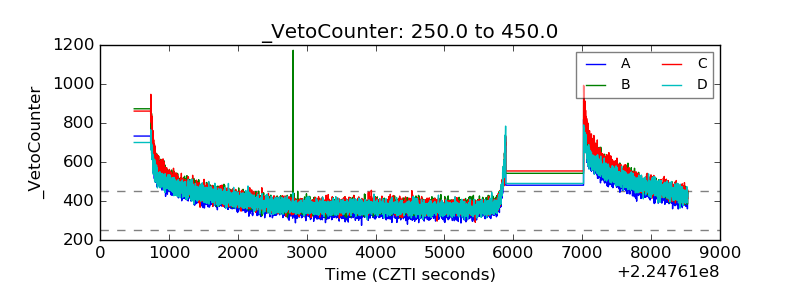 |