| Param | Original file | Final file |
|---|---|---|
| Filename | modeM0/AS1G06_087T04_9000001028_07482cztM0_level2.evt | modeM0/AS1G06_087T04_9000001028_07482cztM0_level2_quad_clean.evt |
| Size (bytes) | 472,144,320 | 68,673,600 |
| Size | 450.3 MB | 65.5 MB |
| Events in quadrant A | 3,214,485 | 411,019 |
| Events in quadrant B | 3,360,782 | 418,907 |
| Events in quadrant C | 3,160,230 | 416,211 |
| Events in quadrant D | 4,135,396 | 393,112 |
| Mode M0 | |||
|---|---|---|---|
| Quadrant | BADHDUFLAG | Total packets | Discarded packets |
| A | 0 | 13637 | 3 |
| B | 0 | 14228 | 2 |
| C | 0 | 13418 | 2 |
| D | 0 | 16562 | 2 |
| Mode SS | |||
|---|---|---|---|
| Quadrant | BADHDUFLAG | Total packets | Discarded packets |
| A | 0 | 128 | 0 |
| B | 0 | 128 | 0 |
| C | 0 | 128 | 0 |
| D | 0 | 128 | 0 |
| Mode M9 | |||
|---|---|---|---|
| Quadrant | BADHDUFLAG | Total packets | Discarded packets |
| A | 0 | 17 | 0 |
| B | 0 | 17 | 0 |
| C | 0 | 17 | 0 |
| D | 0 | 18 | 0 |
| Quadrant | Total seconds | Saturated seconds | Saturation percentage |
|---|---|---|---|
| A | 6305 | 74 | 1.173672% |
| B | 6305 | 81 | 1.284695% |
| C | 6305 | 52 | 0.824742% |
| D | 6305 | 291 | 4.615385% |
Noise dominated data is calculated using 1-second bins in cleaned event files. If a bin has >2000 counts, and if more than 50% of those come from <1% of pixels, then it is considered to be noise-dominated and hence unusable.
| Quadrant | # 1 sec bins | Bins with >0 counts | Bins with >2000 counts | High rate bins dominated by noise | Noise dominated (total time) | Noise dominated (detector-on time) | Marked lightcurve |
|---|---|---|---|---|---|---|---|
| A | 7610 | 6306 | 2 | 2 | 0.03% | 0.03% | 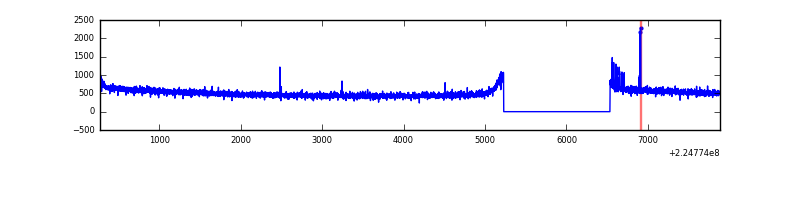 |
| B | 7610 | 6306 | 4 | 4 | 0.05% | 0.06% | 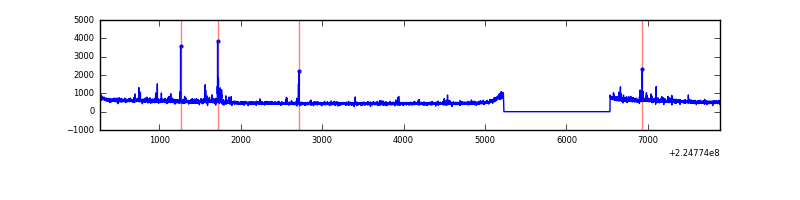 |
| C | 7610 | 6306 | 0 | 0 | 0.00% | 0.00% | 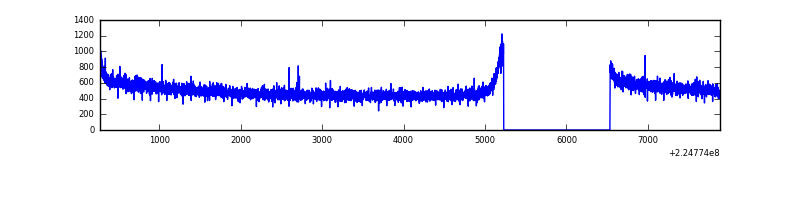 |
| D | 7610 | 6306 | 193 | 193 | 2.54% | 3.06% |  |
Top three noisy pixels from each quadrant. If the there are fewer than three noisy pixels in the level2.evt file, extra rows are filled as -1
| Pixel properties | Quadrant properties | ||||||
|---|---|---|---|---|---|---|---|
| Quadrant | DetID | PixID | Counts | Sigma | Mean | Median | Sigma |
| A | 15 | 239 | 35462 | 207.74 | 824 | 810 | 166.8 |
| A | 0 | 226 | 7863 | 42.28 | 824 | 810 | 166.8 |
| A | 12 | 194 | 7494 | 40.07 | 824 | 810 | 166.8 |
| B | 0 | 214 | 88266 | 568.45 | 826 | 808 | 153.9 |
| B | 0 | 213 | 45219 | 288.66 | 826 | 808 | 153.9 |
| B | 12 | 111 | 15447 | 95.15 | 826 | 808 | 153.9 |
| C | 13 | 61 | 6136 | 28.68 | 809 | 815 | 185.6 |
| C | 8 | 222 | 3489 | 14.41 | 809 | 815 | 185.6 |
| C | 1 | 16 | 2360 | 8.33 | 809 | 815 | 185.6 |
| D | 1 | 52 | 645893 | 3343.41 | 796 | 773 | 193.0 |
| D | 2 | 152 | 80141 | 411.33 | 796 | 773 | 193.0 |
| D | 15 | 47 | 79654 | 408.81 | 796 | 773 | 193.0 |
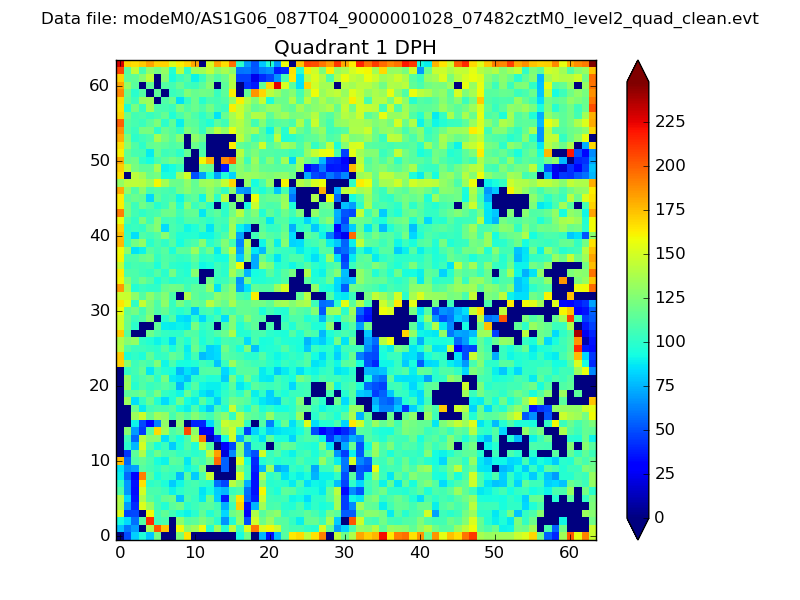
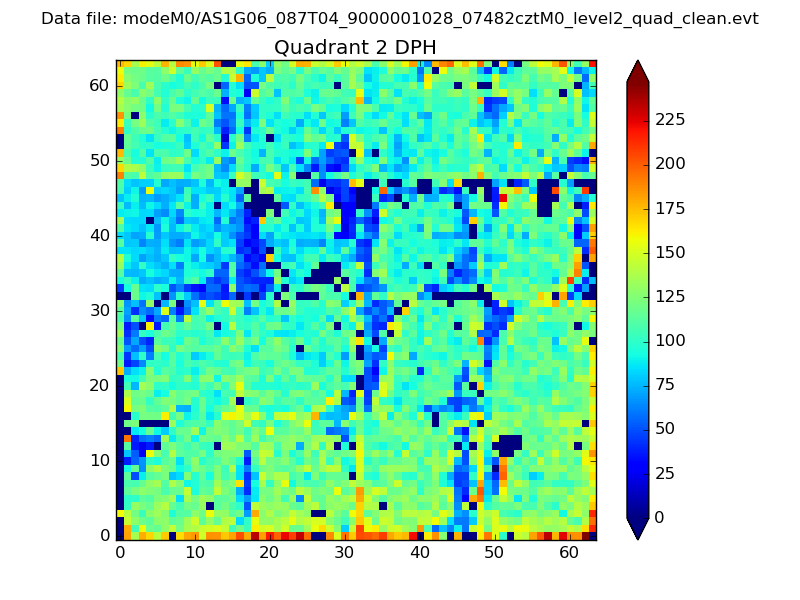
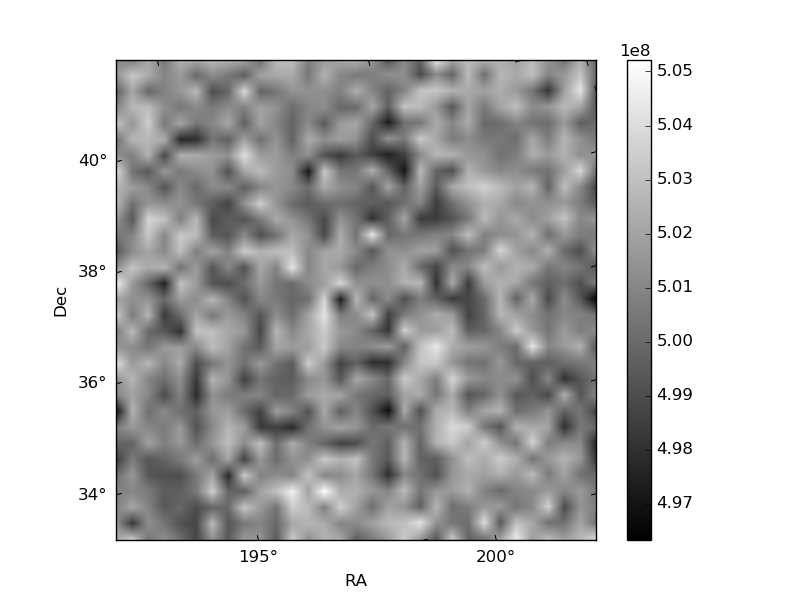
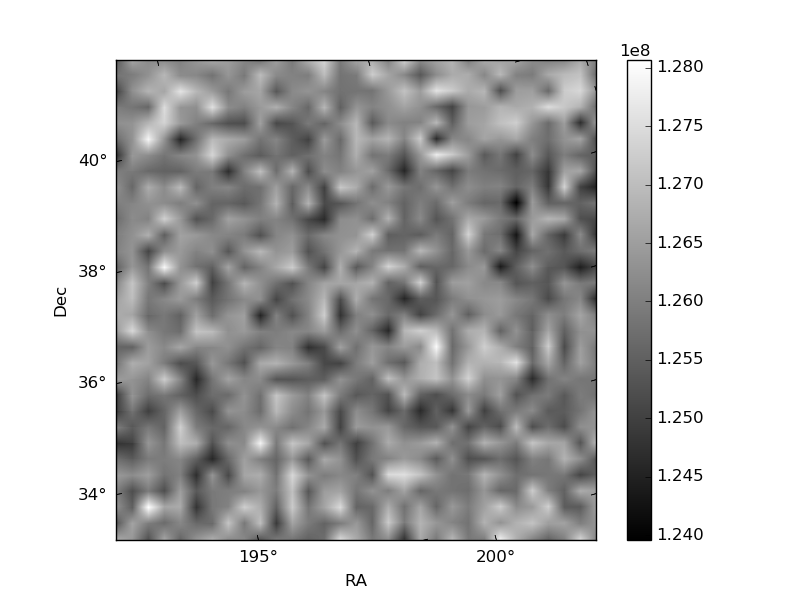
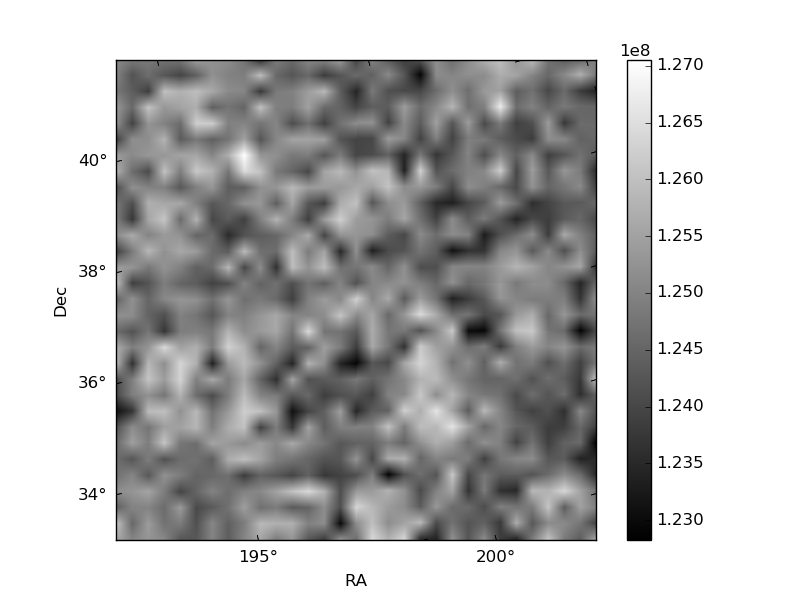
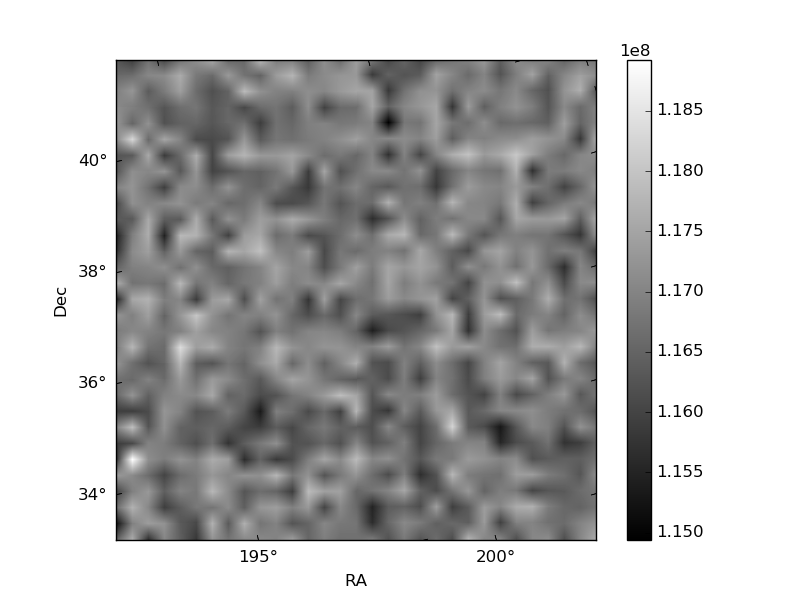
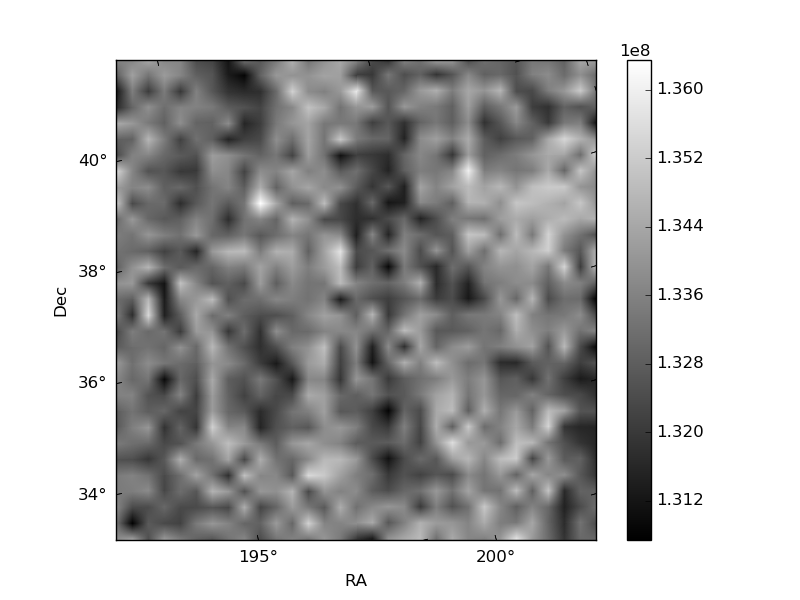
Histogram calculated using DETX and DETY for each event in the final _common_clean file
| Quadrant A | 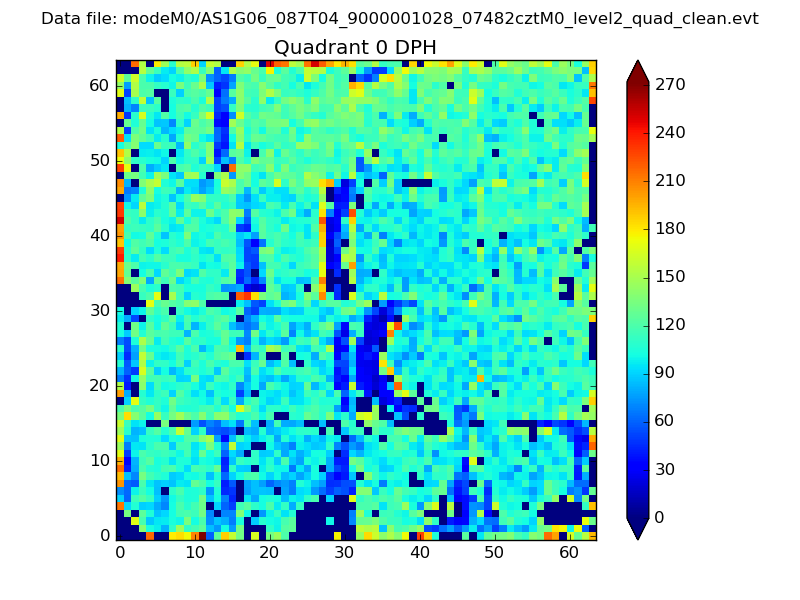 |
 |
Quadrant B |
|---|---|---|---|
| Quadrant D | 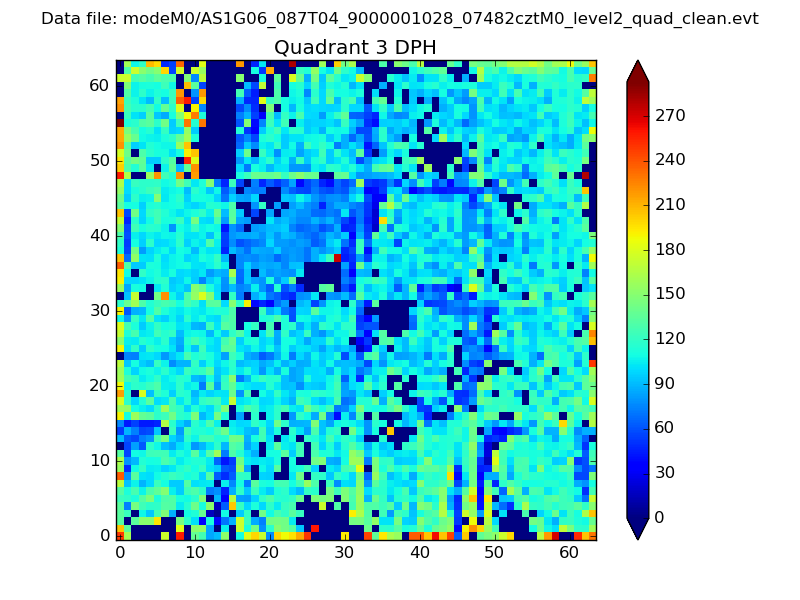 |
 |
Quadrant C |
| Plot type | Count rate plots | Images |
|---|---|---|
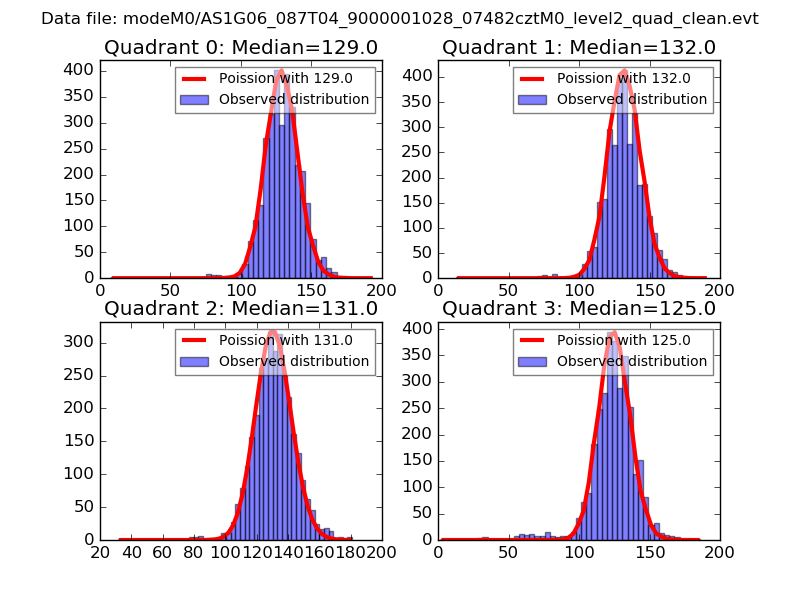
| Comparison with Poisson distribution Blue bars denote a histogram of data divided into 1 sec bins. Red curve is a Poisson curve with rate = median count rate of data. |
 |
 |
| Quadrant-wise count rates Data is divided into 100 sec bins |
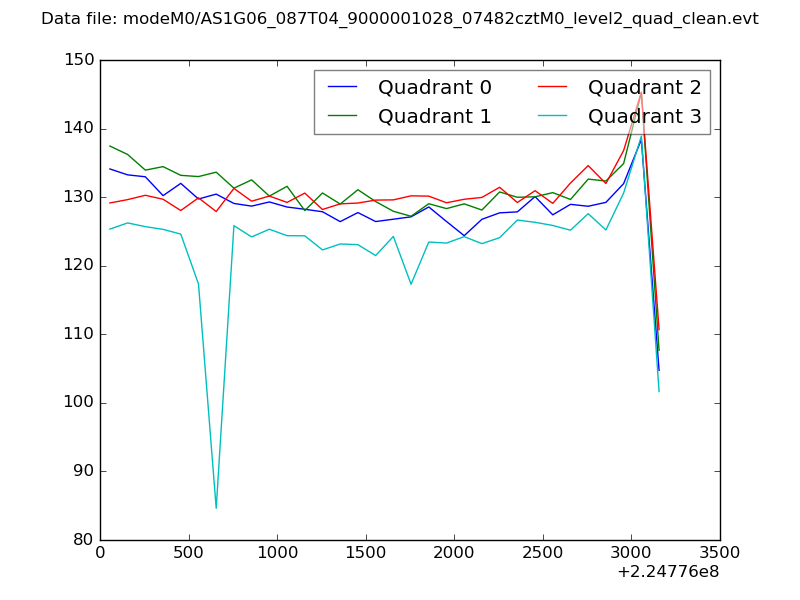 |
|
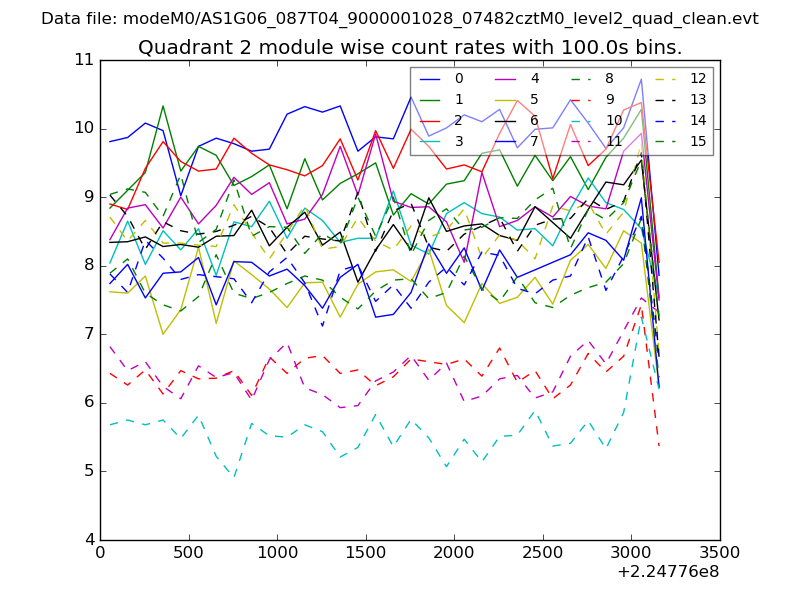
| Module-wise count rates for Quadrant A Data is divided into 100 sec bins |
 |
 |
| Module-wise count rates for Quadrant B Data is divided into 100 sec bins |
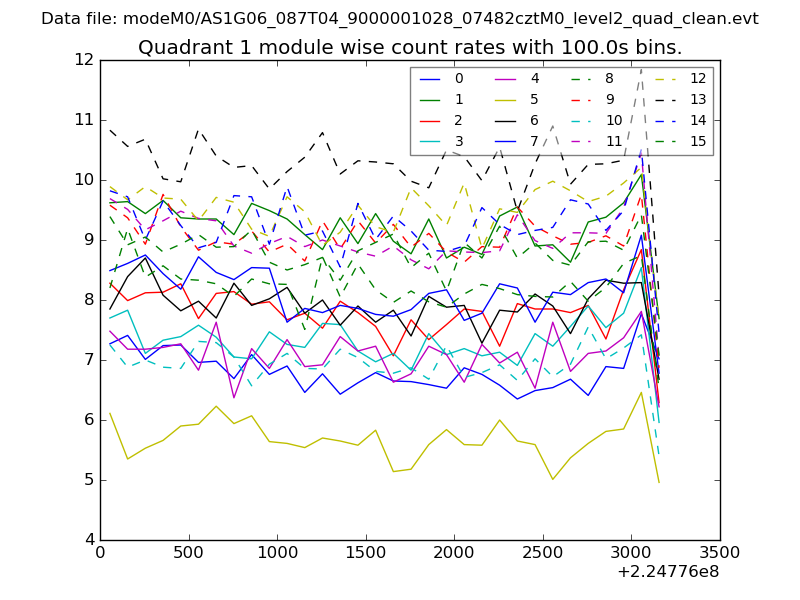 |
 |
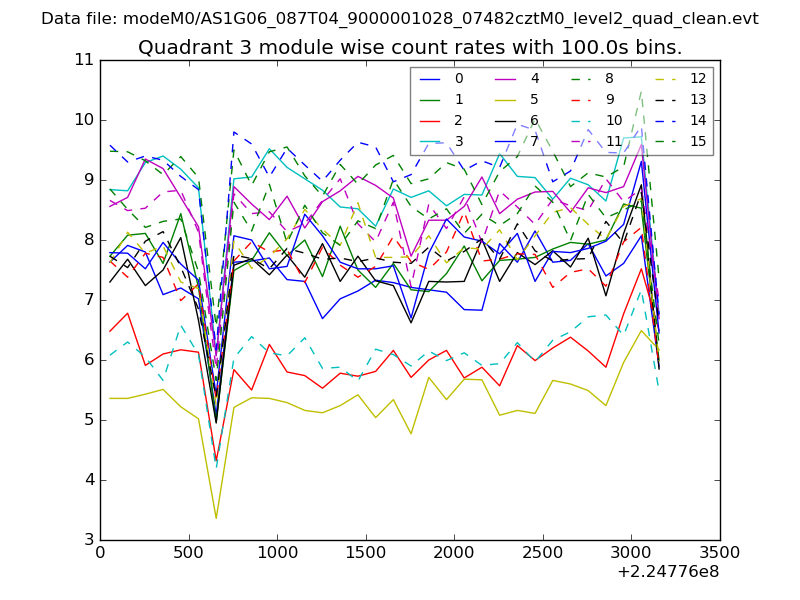
| Module-wise count rates for Quadrant C Data is divided into 100 sec bins |
 |
 |
| Module-wise count rates for Quadrant D Data is divided into 100 sec bins |
 |
 |
| Parameter | Plot |
|---|---|
| CZT HV Monitor | 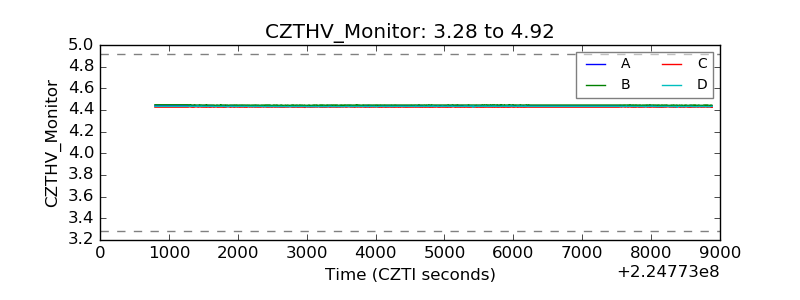 |
| D_VDD | 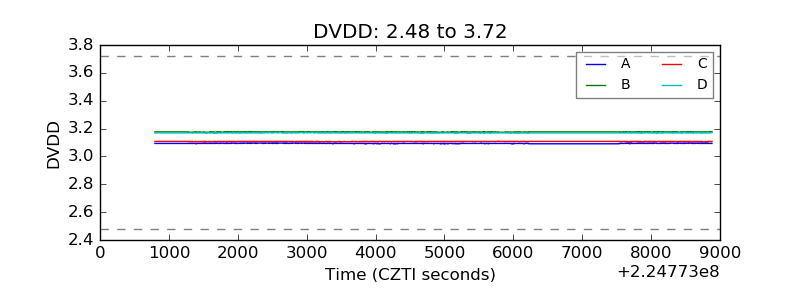 |
| Temperature 1 | 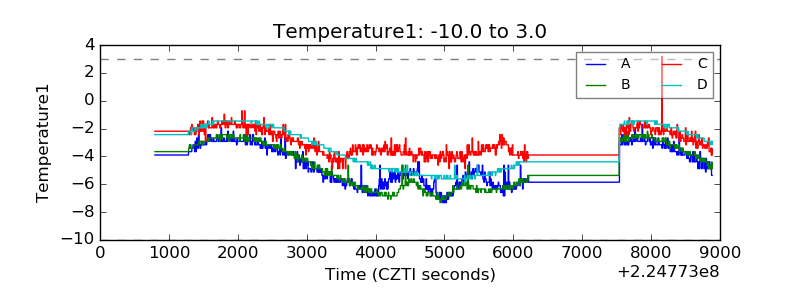 |
| Veto HV Monitor | 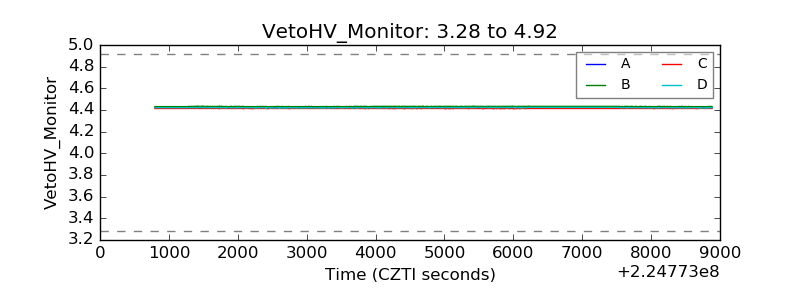 |
| Veto LLD | 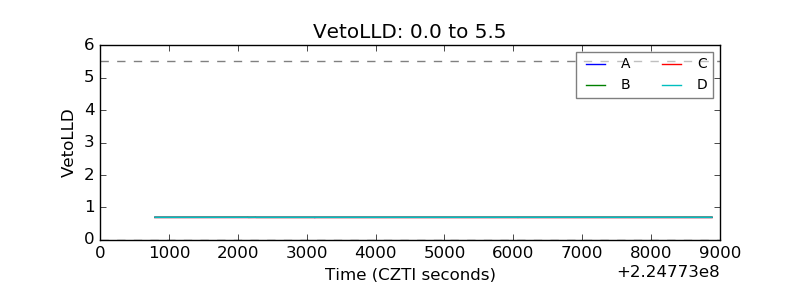 |
| Alpha Counter | 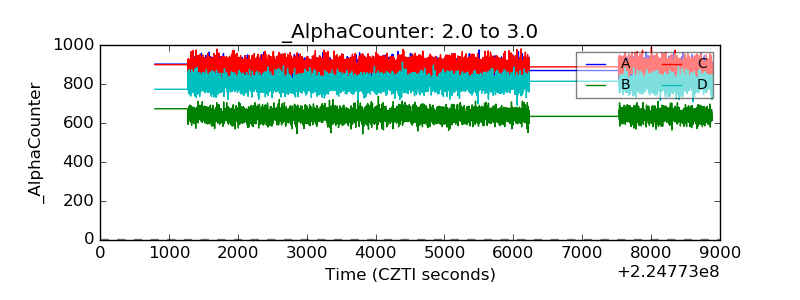 |
| _CPM_Rate | 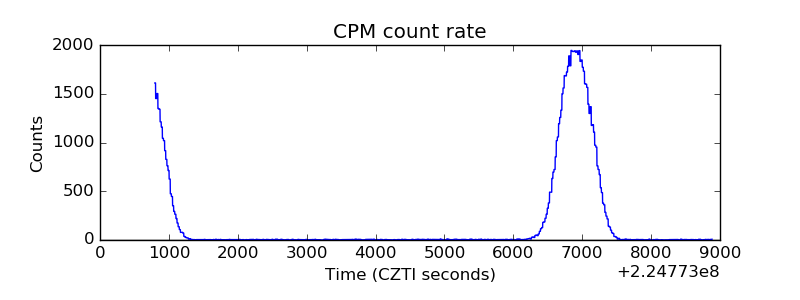 |
| CZT Counter | 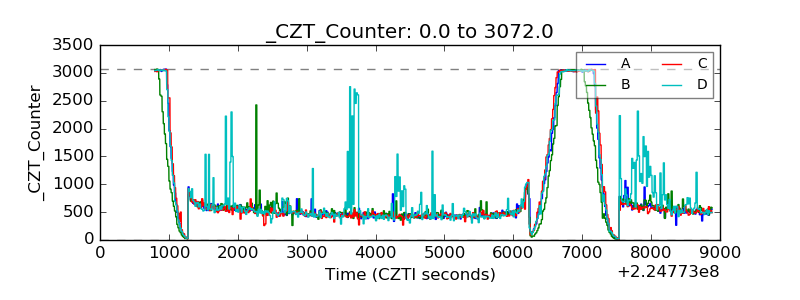 |
| +2.5 Volts monitor |  |
| +5 Volts monitor |  |
| _ROLL_ROT |  |
| _Roll_DEC | 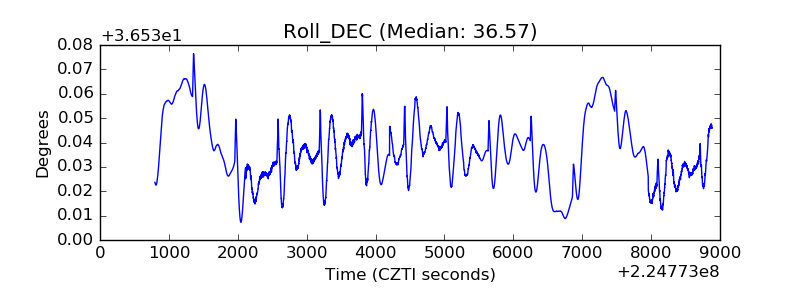 |
| _Roll_RA | 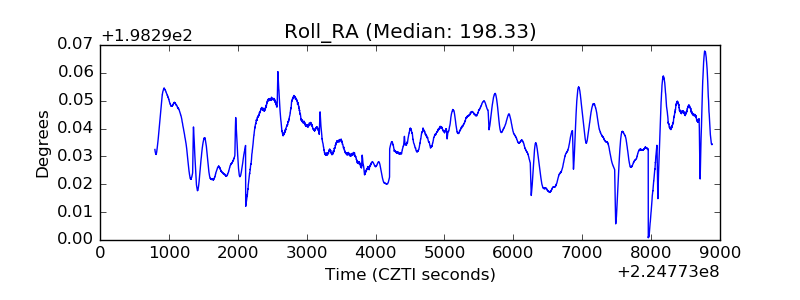 |
| Veto Counter | 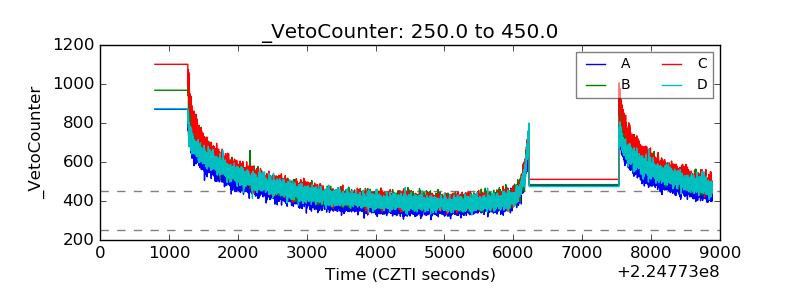 |