| Param | Original file | Final file |
|---|---|---|
| Filename | modeM0/AS1G06_087T04_9000001028_07483cztM0_level2.evt | modeM0/AS1G06_087T04_9000001028_07483cztM0_level2_quad_clean.evt |
| Size (bytes) | 139,129,920 | 9,515,520 |
| Size | 132.7 MB | 9.1 MB |
| Events in quadrant A | 937,305 | 41,490 |
| Events in quadrant B | 959,977 | 42,118 |
| Events in quadrant C | 901,221 | 41,390 |
| Events in quadrant D | 1,299,243 | 39,610 |
| Mode M0 | |||
|---|---|---|---|
| Quadrant | BADHDUFLAG | Total packets | Discarded packets |
| A | 0 | 3764 | 1 |
| B | 0 | 3928 | 1 |
| C | 0 | 3638 | 1 |
| D | 0 | 4941 | 1 |
| Mode SS | |||
|---|---|---|---|
| Quadrant | BADHDUFLAG | Total packets | Discarded packets |
| A | 0 | 34 | 0 |
| B | 0 | 34 | 0 |
| C | 0 | 34 | 0 |
| D | 0 | 34 | 0 |
| Mode M9 | |||
|---|---|---|---|
| Quadrant | BADHDUFLAG | Total packets | Discarded packets |
| A | 0 | 10 | 0 |
| B | 0 | 10 | 0 |
| C | 0 | 10 | 0 |
| D | 0 | 11 | 0 |
| Quadrant | Total seconds | Saturated seconds | Saturation percentage |
|---|---|---|---|
| A | 1667 | 13 | 0.779844% |
| B | 1667 | 8 | 0.479904% |
| C | 1667 | 7 | 0.419916% |
| D | 1667 | 89 | 5.338932% |
Noise dominated data is calculated using 1-second bins in cleaned event files. If a bin has >2000 counts, and if more than 50% of those come from <1% of pixels, then it is considered to be noise-dominated and hence unusable.
| Quadrant | # 1 sec bins | Bins with >0 counts | Bins with >2000 counts | High rate bins dominated by noise | Noise dominated (total time) | Noise dominated (detector-on time) | Marked lightcurve |
|---|---|---|---|---|---|---|---|
| A | 1667 | 1667 | 2 | 2 | 0.12% | 0.12% | 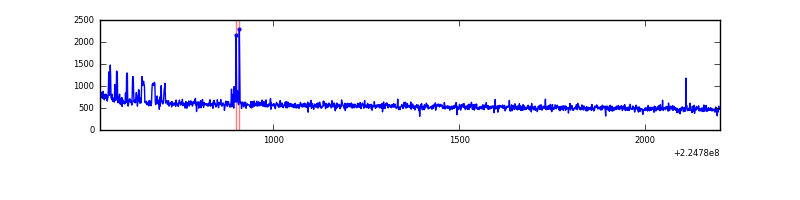 |
| B | 1667 | 1667 | 1 | 1 | 0.06% | 0.06% | 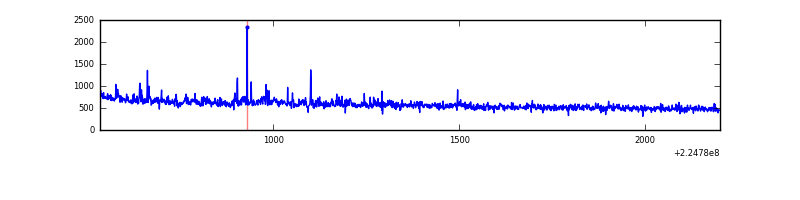 |
| C | 1667 | 1667 | 0 | 0 | 0.00% | 0.00% | 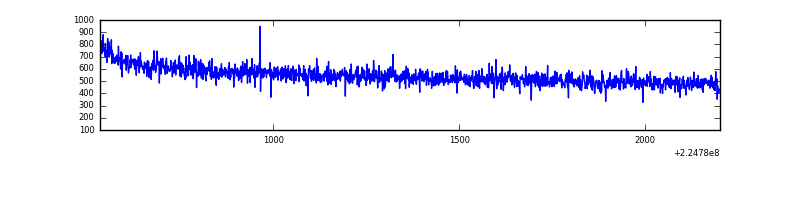 |
| D | 1667 | 1667 | 62 | 62 | 3.72% | 3.72% | 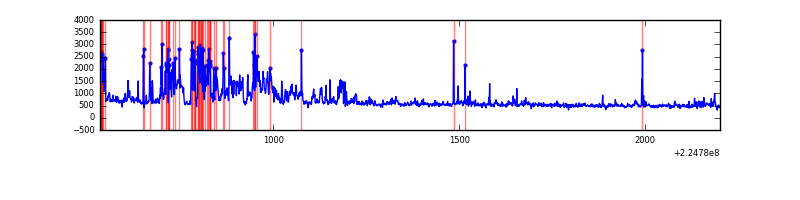 |
Top three noisy pixels from each quadrant. If the there are fewer than three noisy pixels in the level2.evt file, extra rows are filled as -1
| Pixel properties | Quadrant properties | ||||||
|---|---|---|---|---|---|---|---|
| Quadrant | DetID | PixID | Counts | Sigma | Mean | Median | Sigma |
| A | 15 | 239 | 30269 | 611.83 | 235 | 230 | 49.1 |
| A | 0 | 226 | 2262 | 41.39 | 235 | 230 | 49.1 |
| A | 12 | 194 | 2193 | 39.98 | 235 | 230 | 49.1 |
| B | 0 | 214 | 44060 | 980.15 | 235 | 230 | 44.7 |
| B | 12 | 111 | 4095 | 86.43 | 235 | 230 | 44.7 |
| B | 0 | 229 | 3940 | 82.96 | 235 | 230 | 44.7 |
| C | 13 | 61 | 1748 | 28.03 | 230 | 231 | 54.1 |
| C | 8 | 222 | 997 | 14.15 | 230 | 231 | 54.1 |
| C | 1 | 16 | 714 | 8.92 | 230 | 231 | 54.1 |
| D | 1 | 52 | 288585 | 5119.68 | 226 | 219 | 56.3 |
| D | 12 | 233 | 35760 | 631.0 | 226 | 219 | 56.3 |
| D | 15 | 47 | 34757 | 613.19 | 226 | 219 | 56.3 |
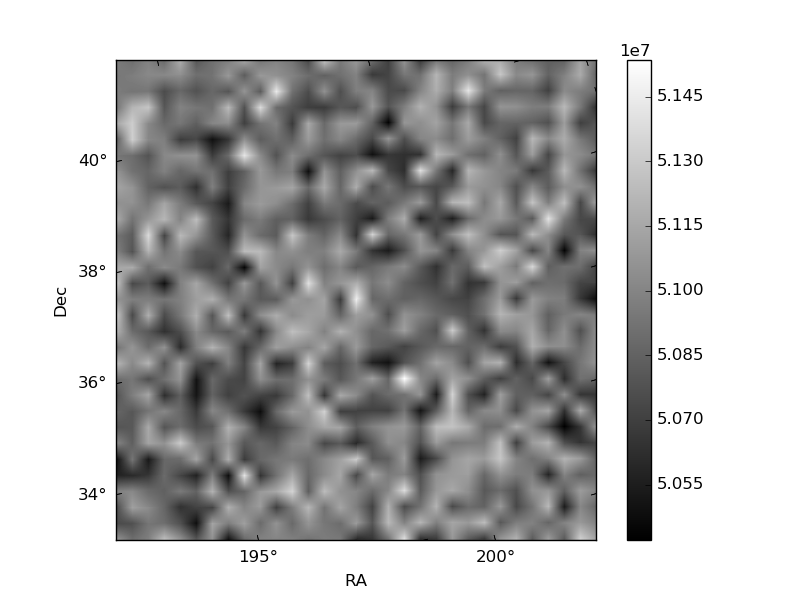
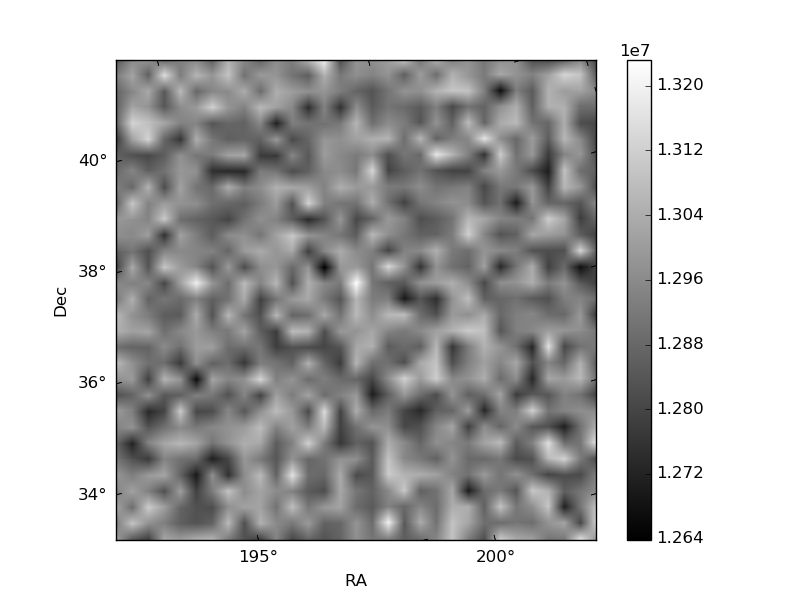
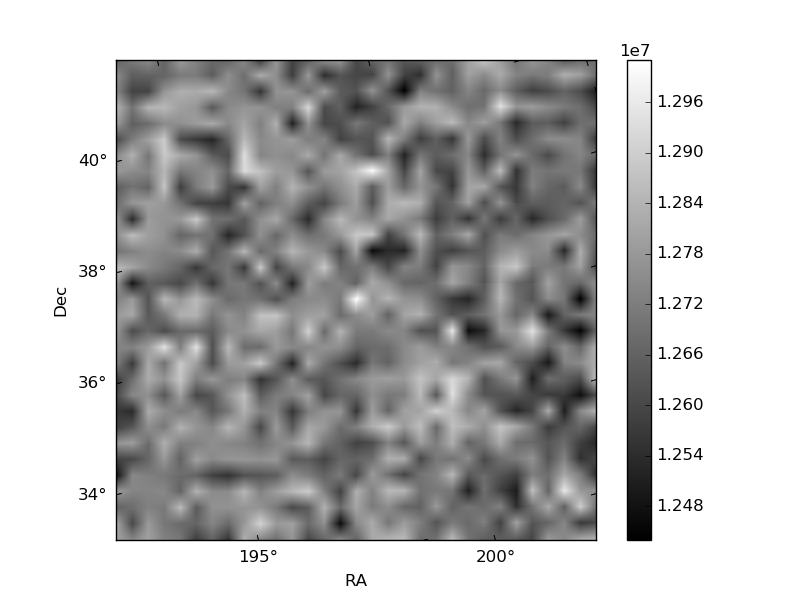
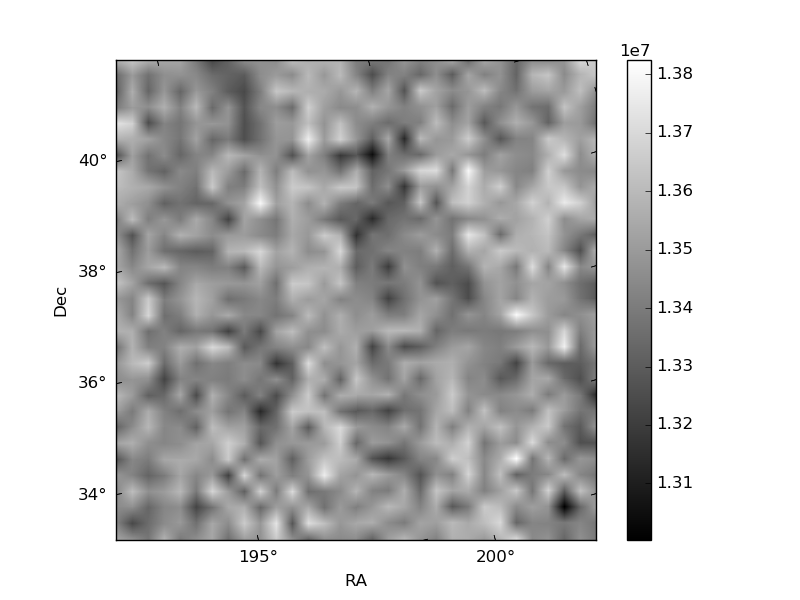
Histogram calculated using DETX and DETY for each event in the final _common_clean file
| Quadrant A | 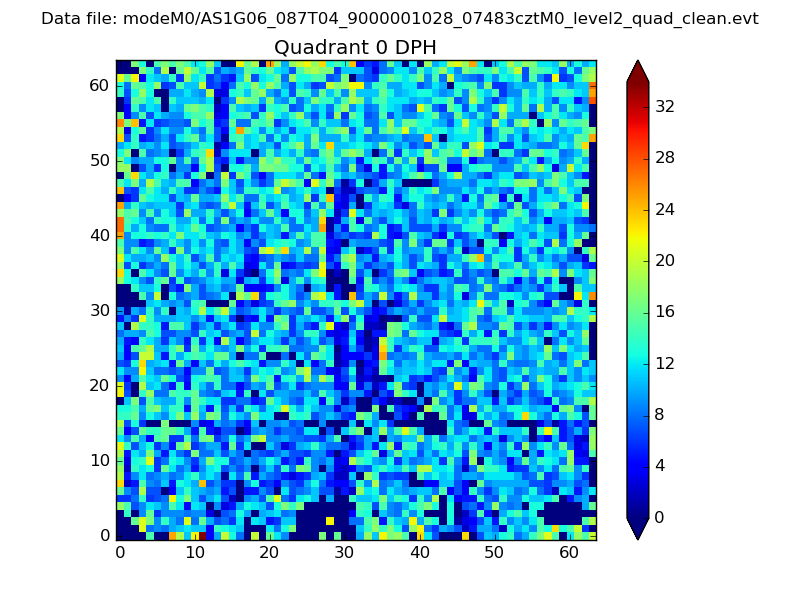 |
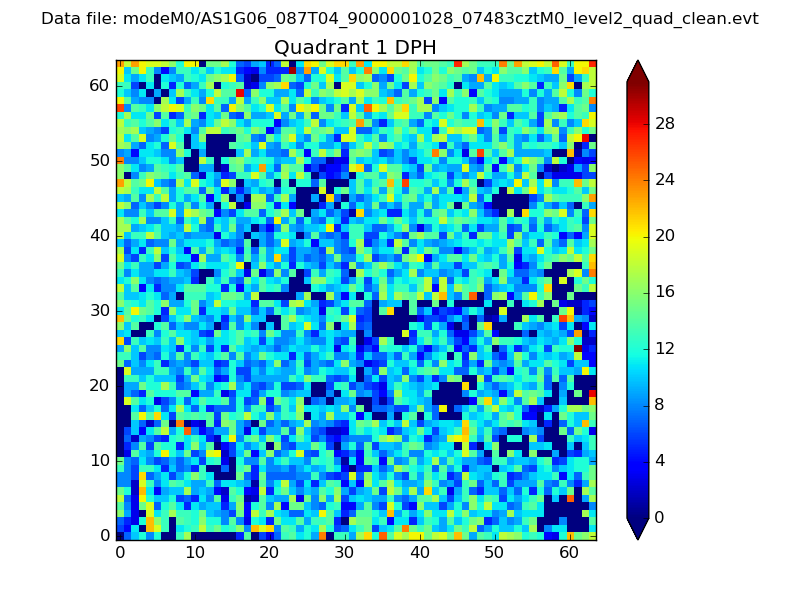 |
Quadrant B |
|---|---|---|---|
| Quadrant D | 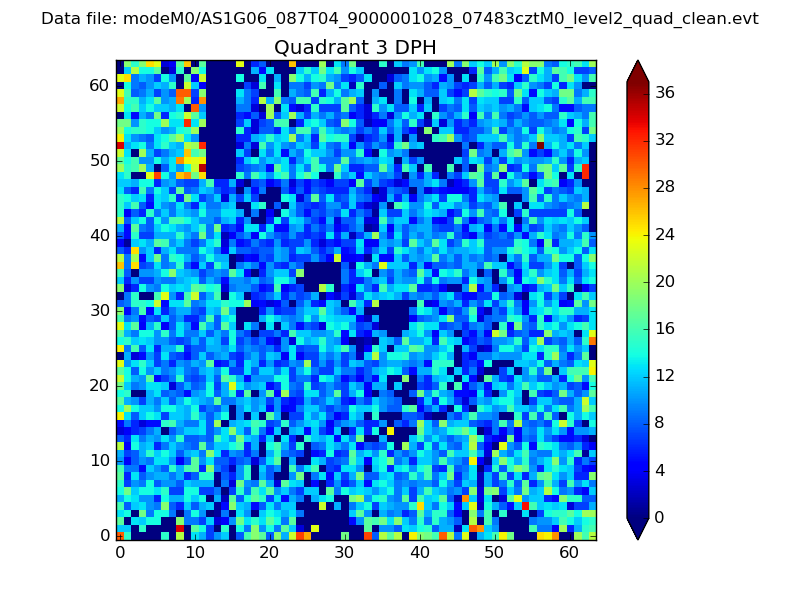 |
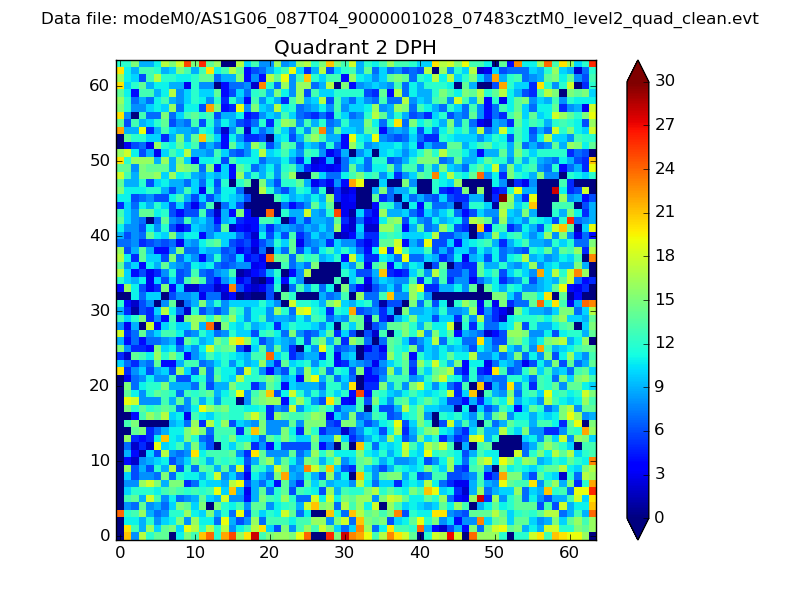 |
Quadrant C |
| Plot type | Count rate plots | Images |
|---|---|---|
| Comparison with Poisson distribution Blue bars denote a histogram of data divided into 1 sec bins. Red curve is a Poisson curve with rate = median count rate of data. |
 |
 |
| Quadrant-wise count rates Data is divided into 100 sec bins |
 |
|
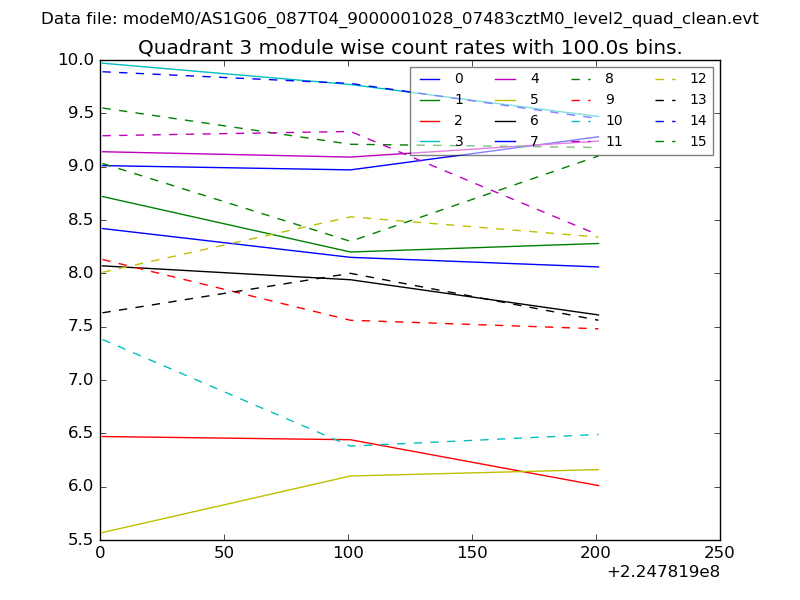
| Module-wise count rates for Quadrant A Data is divided into 100 sec bins |
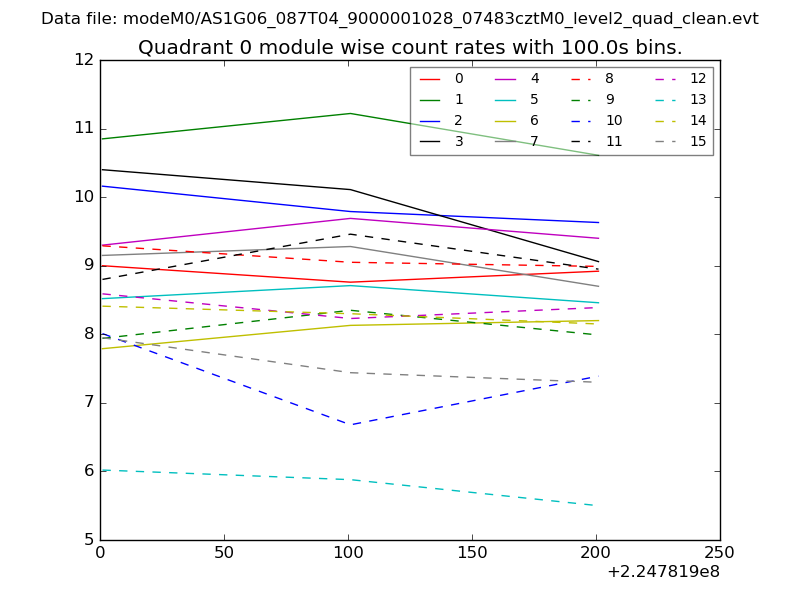 |
 |
| Module-wise count rates for Quadrant B Data is divided into 100 sec bins |
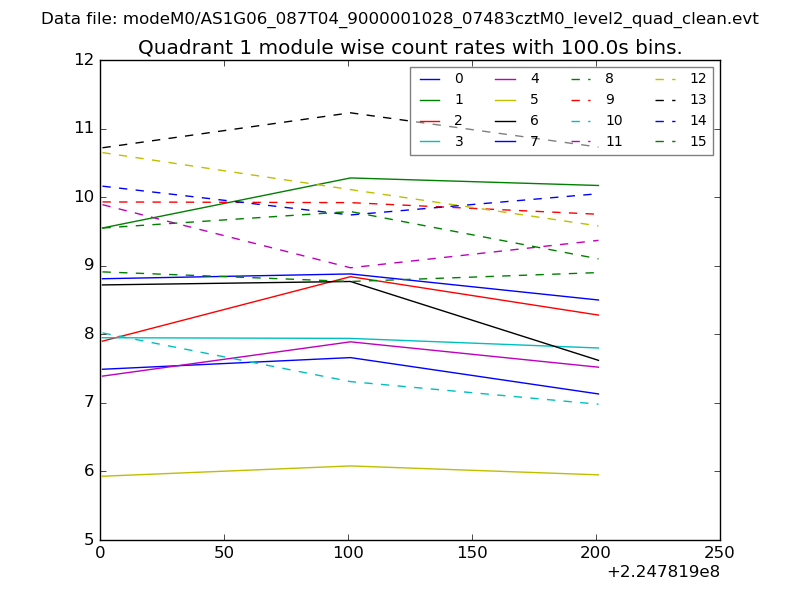 |
 |
| Module-wise count rates for Quadrant C Data is divided into 100 sec bins |
 |
 |
| Module-wise count rates for Quadrant D Data is divided into 100 sec bins |
 |
 |
| Parameter | Plot |
|---|---|
| CZT HV Monitor | 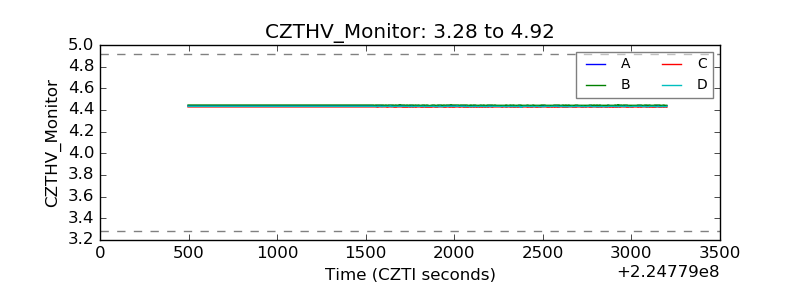 |
| D_VDD | 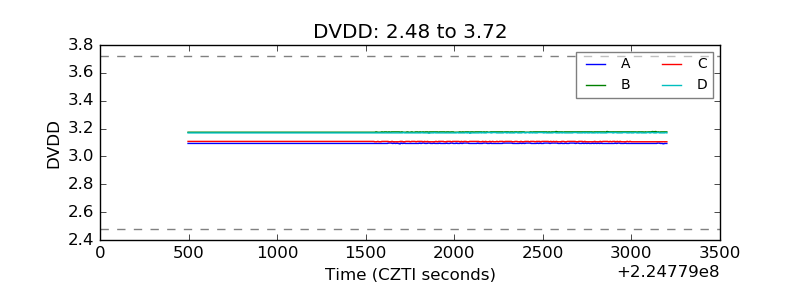 |
| Temperature 1 | 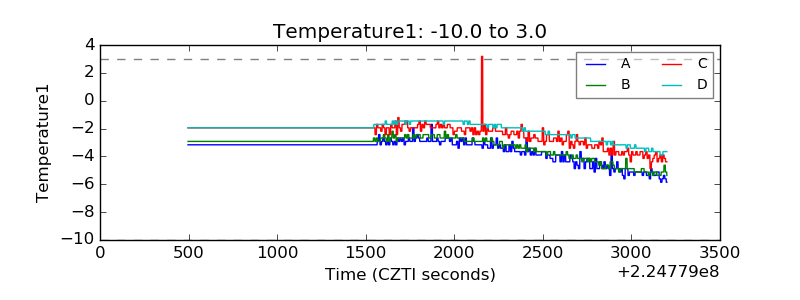 |
| Veto HV Monitor | 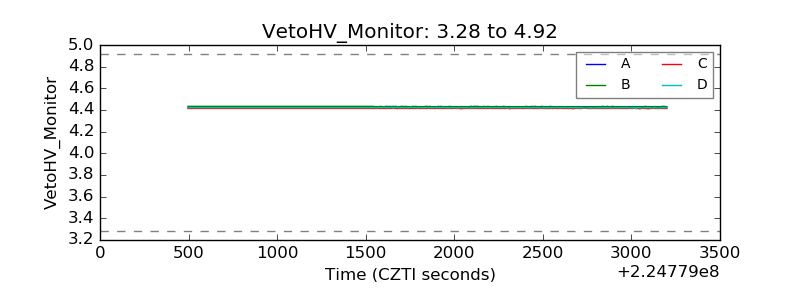 |
| Veto LLD | 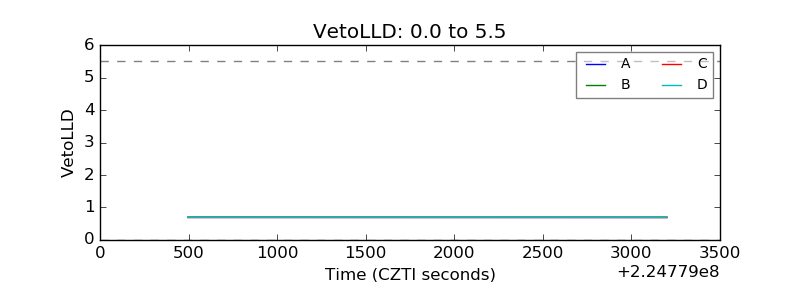 |
| Alpha Counter |  |
| _CPM_Rate | 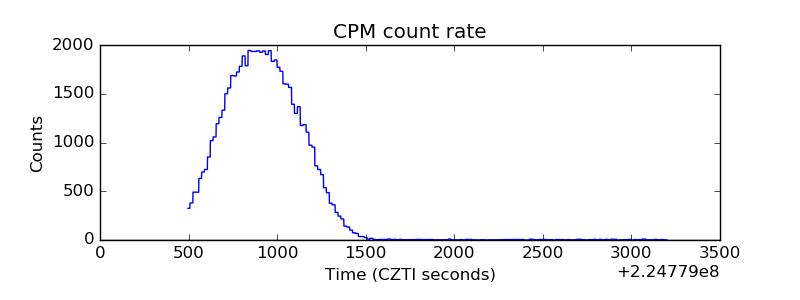 |
| CZT Counter | 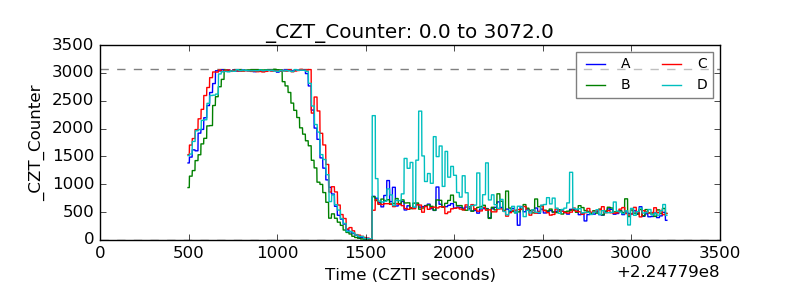 |
| +2.5 Volts monitor |  |
| +5 Volts monitor |  |
| _ROLL_ROT | 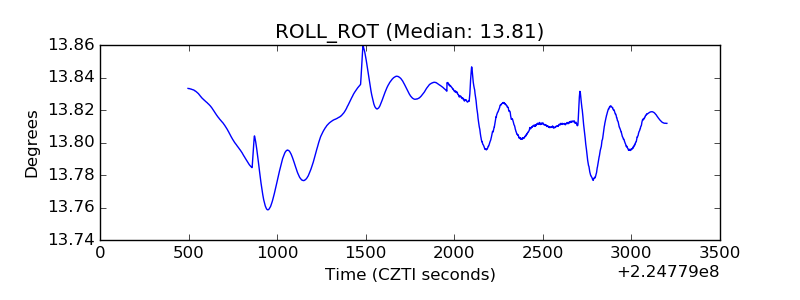 |
| _Roll_DEC | 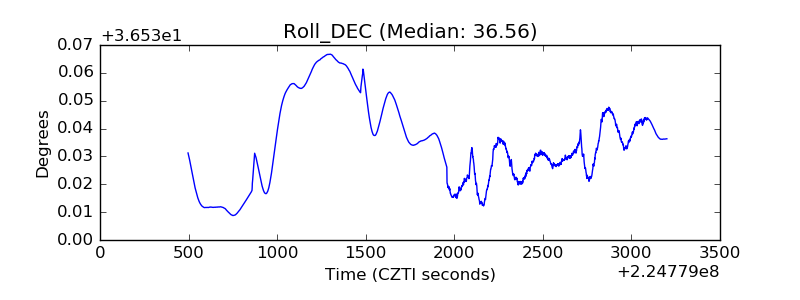 |
| _Roll_RA | 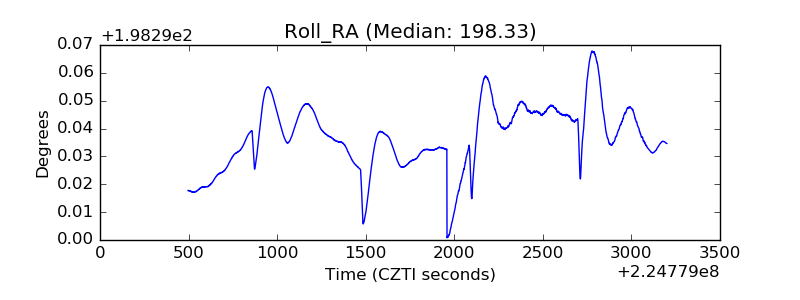 |
| Veto Counter | 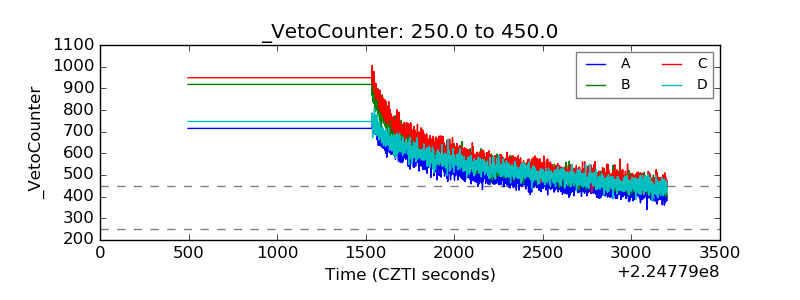 |