| Param | Original file | Final file |
|---|---|---|
| Filename | modeM0/AS1T01_156T01_9000001034_07494cztM0_level2.evt | modeM0/AS1T01_156T01_9000001034_07494cztM0_level2_quad_clean.evt |
| Size (bytes) | 551,534,400 | 110,427,840 |
| Size | 526.0 MB | 105.3 MB |
| Events in quadrant A | 3,784,481 | 698,659 |
| Events in quadrant B | 4,082,256 | 713,610 |
| Events in quadrant C | 3,744,767 | 710,783 |
| Events in quadrant D | 4,539,621 | 656,025 |
| Mode M9 | |||
|---|---|---|---|
| Quadrant | BADHDUFLAG | Total packets | Discarded packets |
| A | 0 | 17 | 0 |
| B | 0 | 17 | 0 |
| C | 0 | 17 | 0 |
| D | 0 | 17 | 2 |
| Mode SS | |||
|---|---|---|---|
| Quadrant | BADHDUFLAG | Total packets | Discarded packets |
| A | 0 | 172 | 4 |
| B | 0 | 172 | 8 |
| C | 0 | 172 | 6 |
| D | 0 | 172 | 2 |
| Mode M0 | |||
|---|---|---|---|
| Quadrant | BADHDUFLAG | Total packets | Discarded packets |
| A | 0 | 17064 | 459 |
| B | 0 | 17680 | 471 |
| C | 0 | 17037 | 444 |
| D | 0 | 19825 | 763 |
| Quadrant | Total seconds | Saturated seconds | Saturation percentage |
|---|---|---|---|
| A | 8125 | 61 | 0.750769% |
| B | 8136 | 75 | 0.921829% |
| C | 8136 | 55 | 0.676008% |
| D | 8096 | 254 | 3.137352% |
Noise dominated data is calculated using 1-second bins in cleaned event files. If a bin has >2000 counts, and if more than 50% of those come from <1% of pixels, then it is considered to be noise-dominated and hence unusable.
| Quadrant | # 1 sec bins | Bins with >0 counts | Bins with >2000 counts | High rate bins dominated by noise | Noise dominated (total time) | Noise dominated (detector-on time) | Marked lightcurve |
|---|---|---|---|---|---|---|---|
| A | 10267 | 8274 | 1 | 1 | 0.01% | 0.01% | 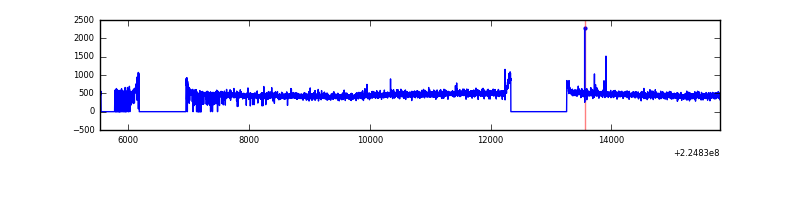 |
| B | 10267 | 8300 | 4 | 4 | 0.04% | 0.05% | 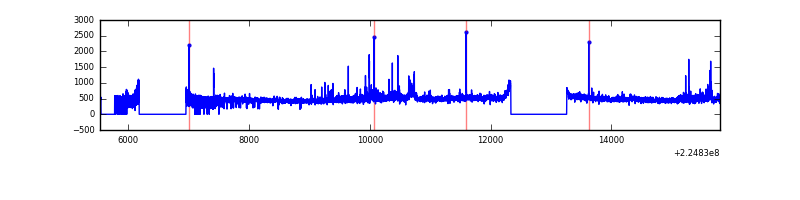 |
| C | 10268 | 8300 | 0 | 0 | 0.00% | 0.00% | 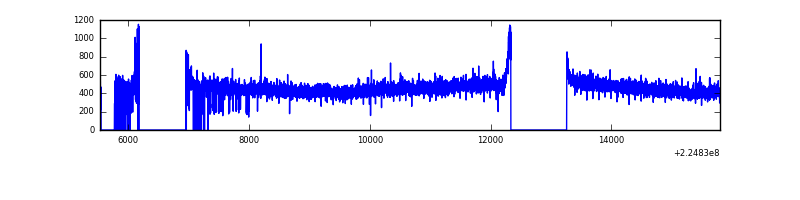 |
| D | 10267 | 8262 | 151 | 151 | 1.47% | 1.83% | 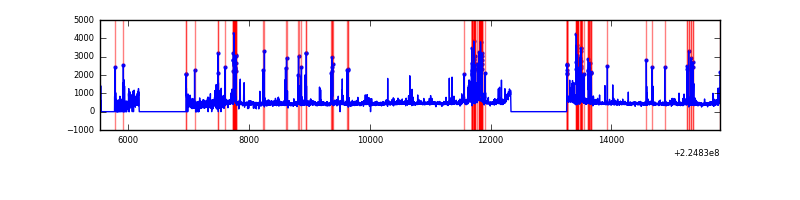 |
Top three noisy pixels from each quadrant. If the there are fewer than three noisy pixels in the level2.evt file, extra rows are filled as -1
| Pixel properties | Quadrant properties | ||||||
|---|---|---|---|---|---|---|---|
| Quadrant | DetID | PixID | Counts | Sigma | Mean | Median | Sigma |
| A | 3 | 1 | 12630 | 58.88 | 974 | 955 | 198.3 |
| A | 15 | 239 | 12448 | 57.96 | 974 | 955 | 198.3 |
| A | 0 | 226 | 9578 | 43.49 | 974 | 955 | 198.3 |
| B | 0 | 214 | 149541 | 802.67 | 982 | 961 | 185.1 |
| B | 0 | 219 | 47186 | 249.72 | 982 | 961 | 185.1 |
| B | 15 | 54 | 27321 | 142.4 | 982 | 961 | 185.1 |
| C | 13 | 61 | 7308 | 28.38 | 959 | 966 | 223.5 |
| C | 12 | 4 | 4912 | 17.66 | 959 | 966 | 223.5 |
| C | 3 | 202 | 2352 | 6.2 | 959 | 966 | 223.5 |
| D | 1 | 52 | 441836 | 1907.94 | 942 | 916 | 231.1 |
| D | 2 | 152 | 353811 | 1527.04 | 942 | 916 | 231.1 |
| D | 2 | 136 | 74444 | 318.17 | 942 | 916 | 231.1 |
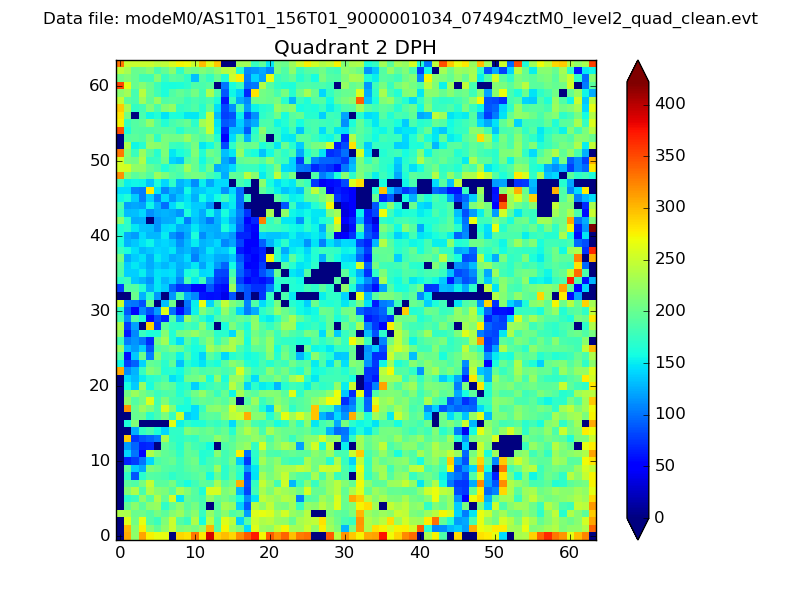
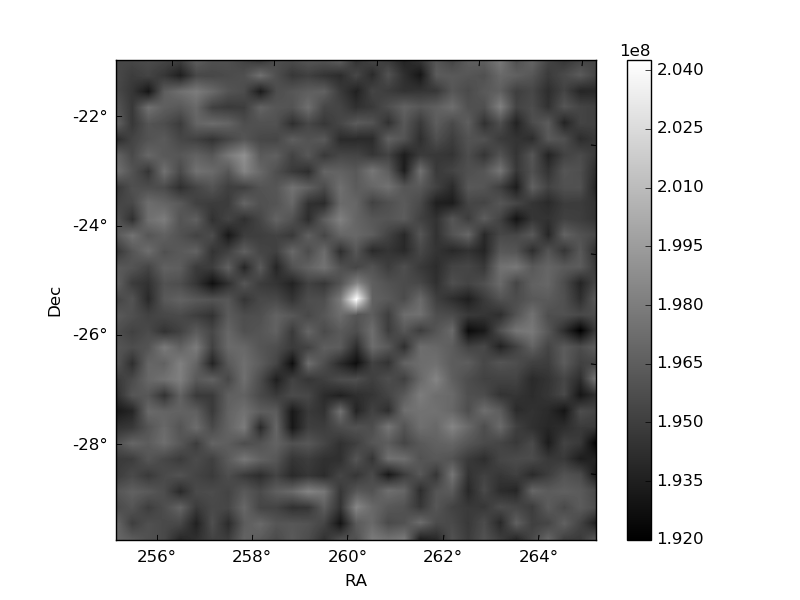
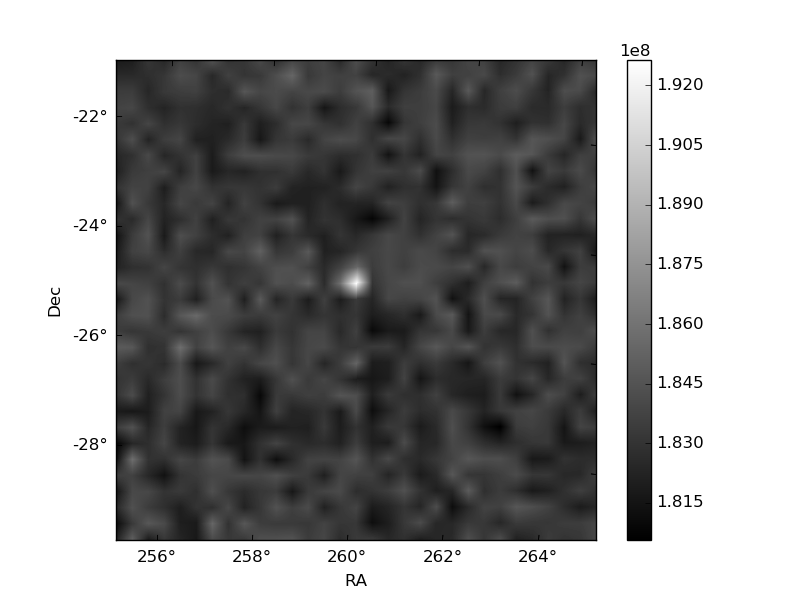
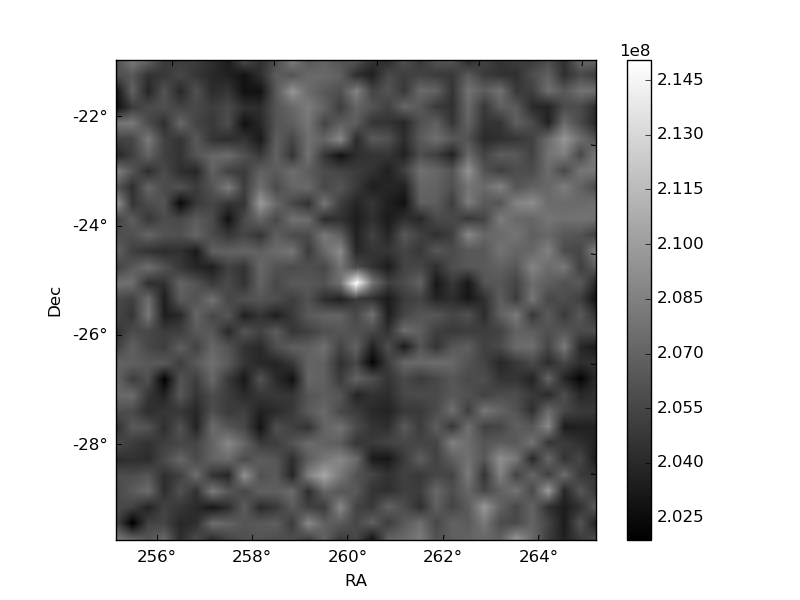
Histogram calculated using DETX and DETY for each event in the final _common_clean file
| Quadrant A |  |
 |
Quadrant B |
|---|---|---|---|
| Quadrant D | 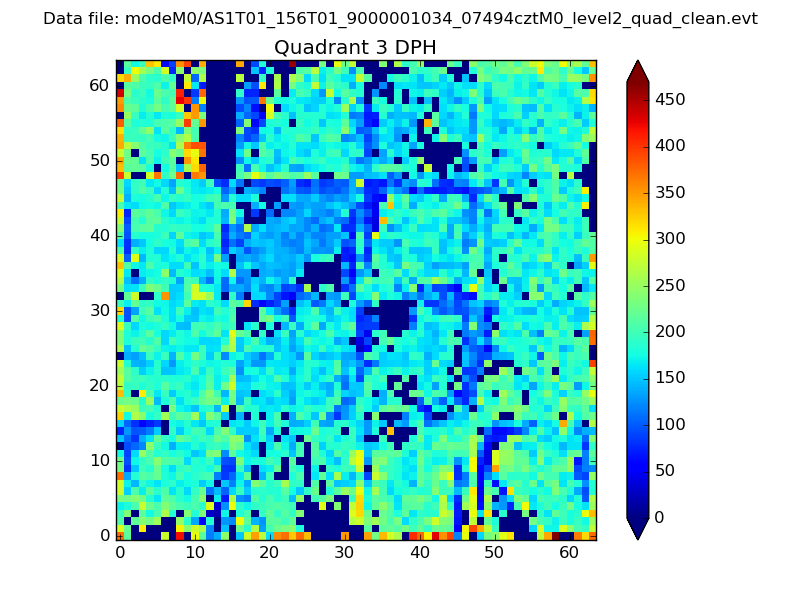 |
 |
Quadrant C |
| Plot type | Count rate plots | Images |
|---|---|---|
| Comparison with Poisson distribution Blue bars denote a histogram of data divided into 1 sec bins. Red curve is a Poisson curve with rate = median count rate of data. |
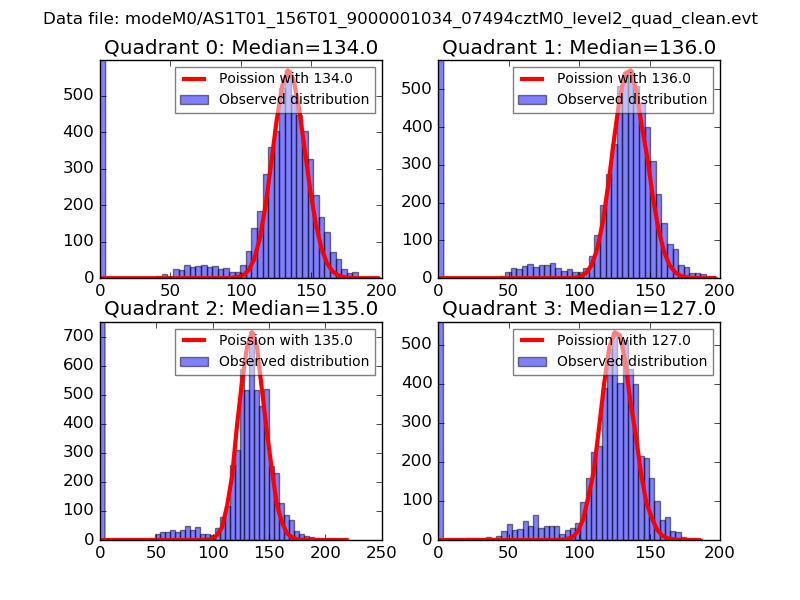 |
 |
| Quadrant-wise count rates Data is divided into 100 sec bins |
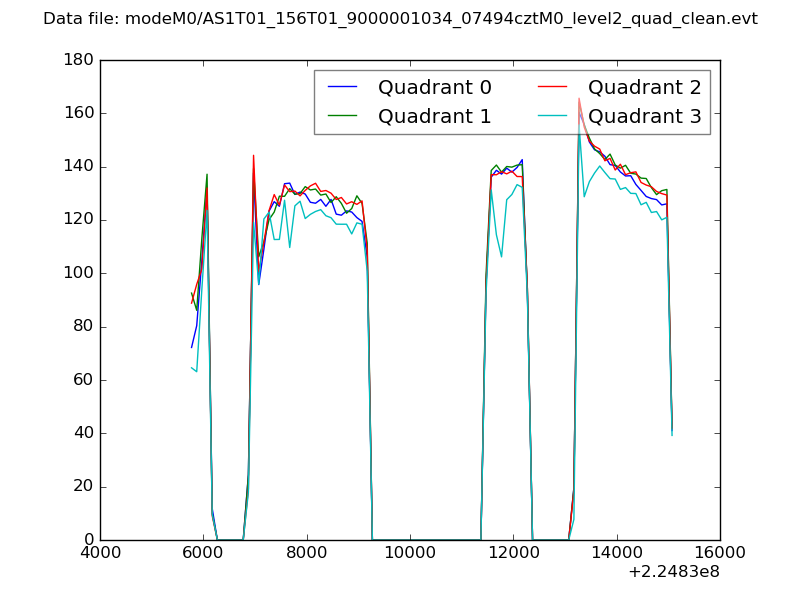 |
|
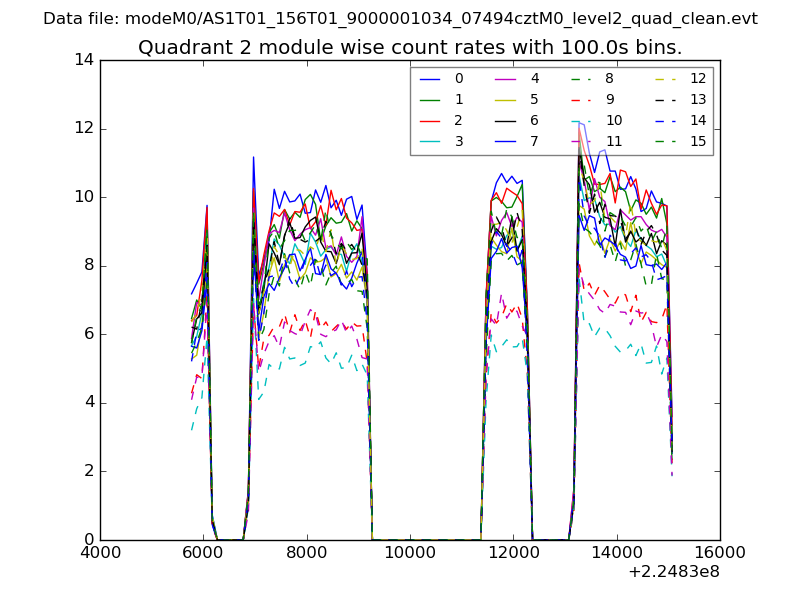
| Module-wise count rates for Quadrant A Data is divided into 100 sec bins |
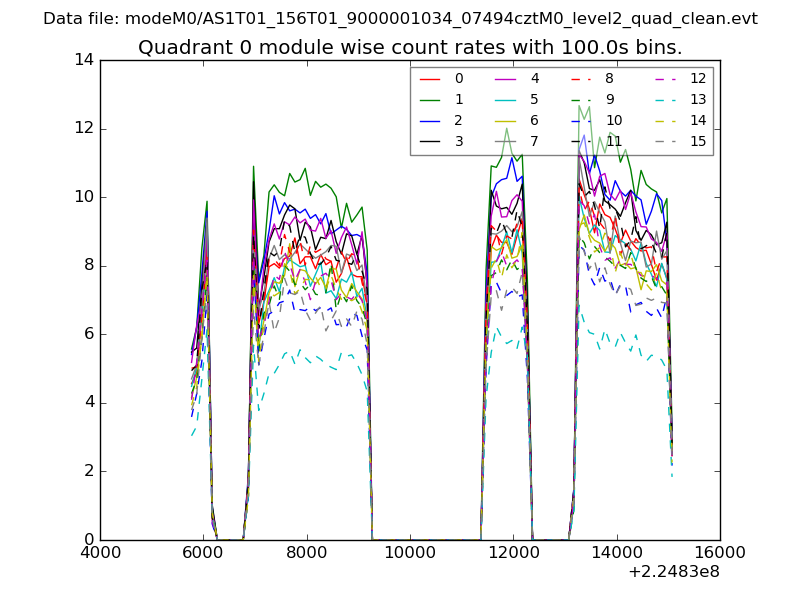 |
 |
| Module-wise count rates for Quadrant B Data is divided into 100 sec bins |
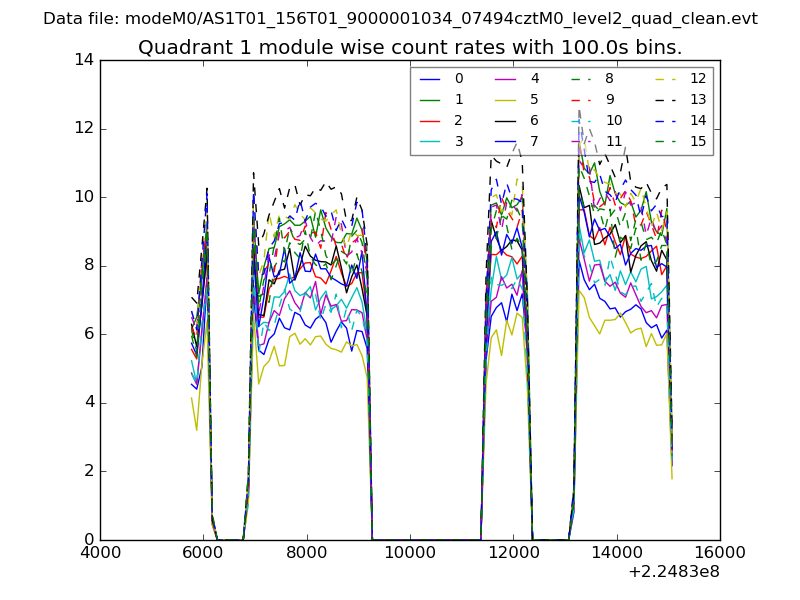 |
 |
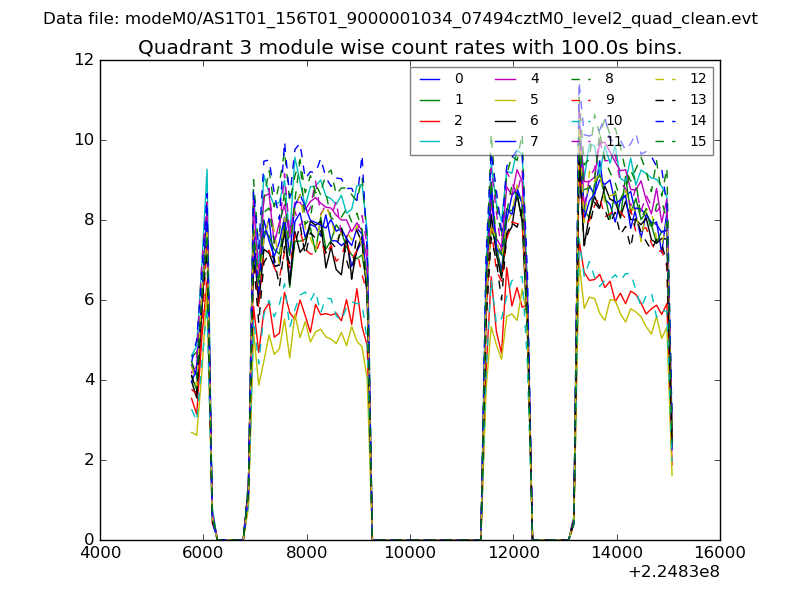
| Module-wise count rates for Quadrant C Data is divided into 100 sec bins |
 |
 |
| Module-wise count rates for Quadrant D Data is divided into 100 sec bins |
 |
 |
| Parameter | Plot |
|---|---|
| CZT HV Monitor | 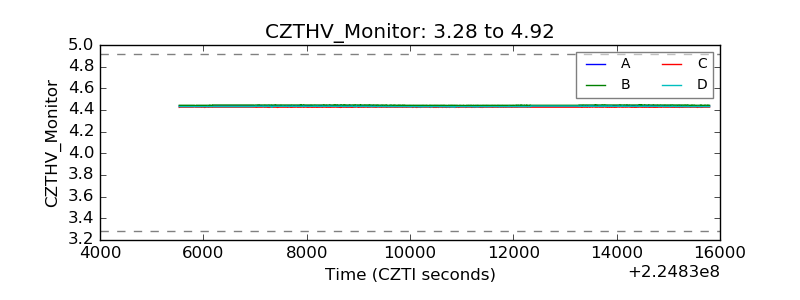 |
| D_VDD | 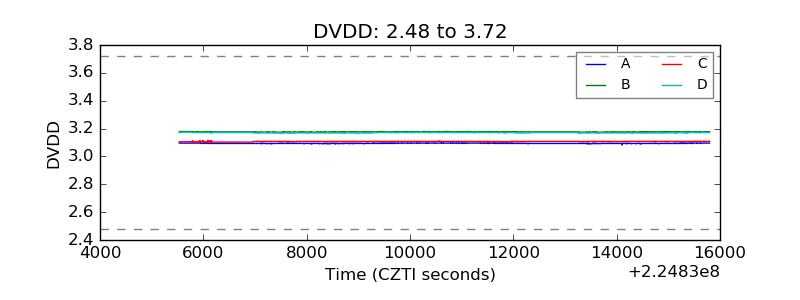 |
| Temperature 1 | 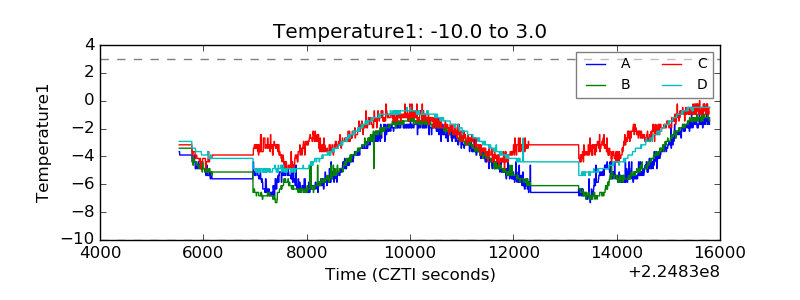 |
| Veto HV Monitor |  |
| Veto LLD | 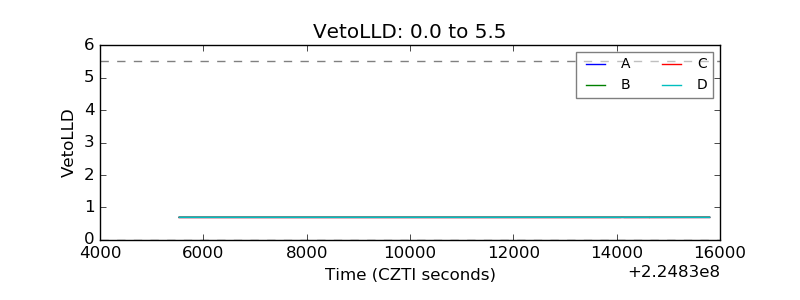 |
| Alpha Counter | 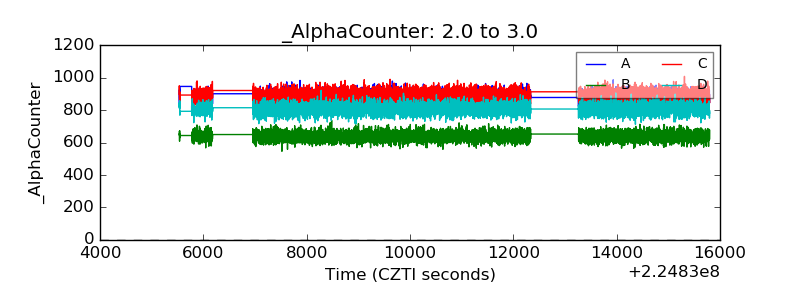 |
| _CPM_Rate | 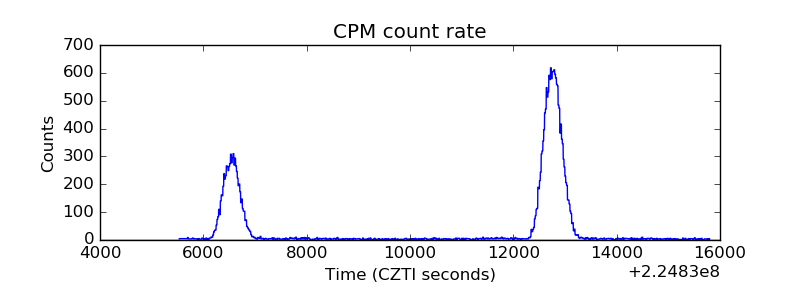 |
| CZT Counter | 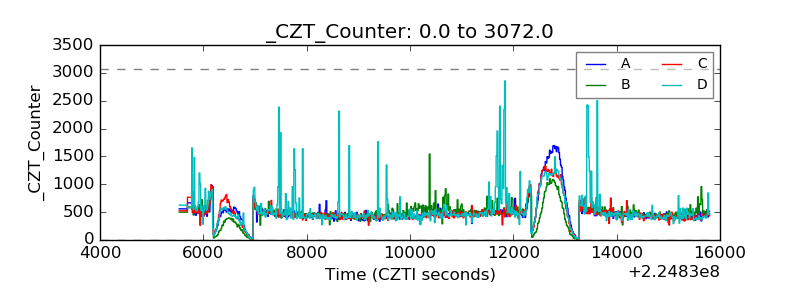 |
| +2.5 Volts monitor |  |
| +5 Volts monitor | 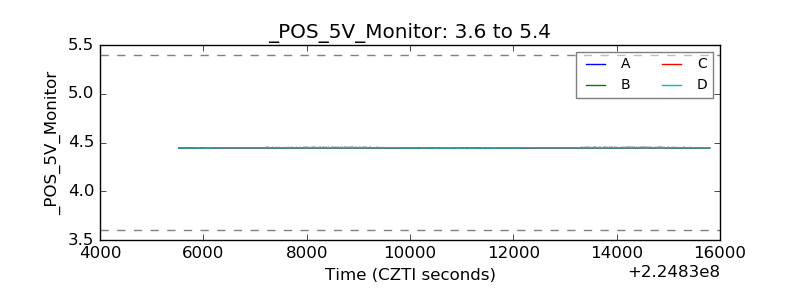 |
| _ROLL_ROT | 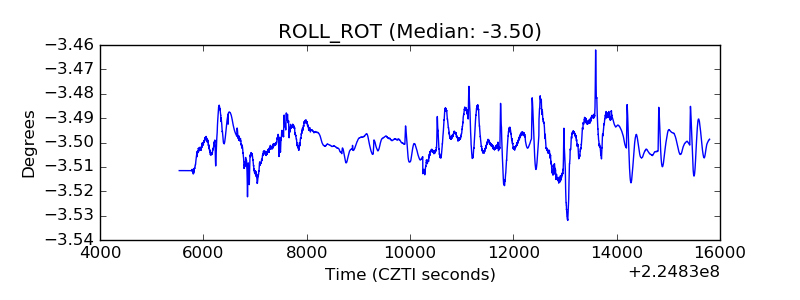 |
| _Roll_DEC | 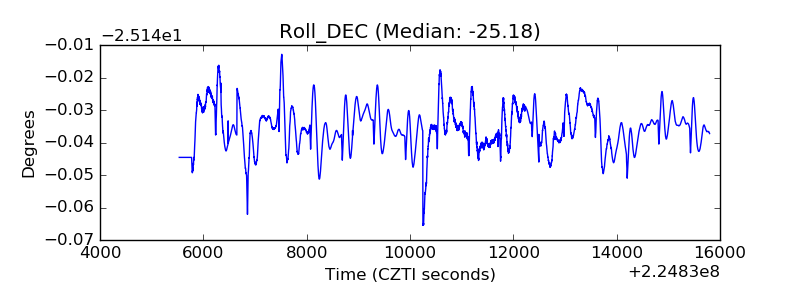 |
| _Roll_RA |  |
| Veto Counter | 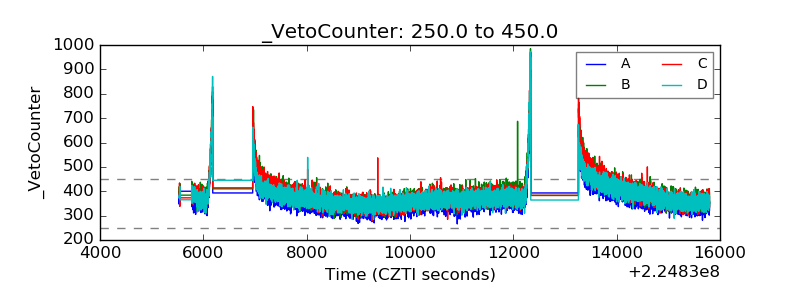 |