| Param | Original file | Final file |
|---|---|---|
| Filename | modeM0/AS1T01_156T01_9000001034_07495cztM0_level2.evt | modeM0/AS1T01_156T01_9000001034_07495cztM0_level2_quad_clean.evt |
| Size (bytes) | 1,618,128,000 | 293,264,640 |
| Size | 1.5 GB | 279.7 MB |
| Events in quadrant A | 11,178,276 | 1,822,414 |
| Events in quadrant B | 12,008,102 | 1,854,231 |
| Events in quadrant C | 11,022,580 | 1,836,726 |
| Events in quadrant D | 13,182,768 | 1,726,134 |
| Mode M9 | |||
|---|---|---|---|
| Quadrant | BADHDUFLAG | Total packets | Discarded packets |
| A | 0 | 34 | 0 |
| B | 0 | 34 | 0 |
| C | 0 | 34 | 0 |
| D | 0 | 34 | 0 |
| Mode SS | |||
|---|---|---|---|
| Quadrant | BADHDUFLAG | Total packets | Discarded packets |
| A | 0 | 484 | 0 |
| B | 0 | 484 | 0 |
| C | 0 | 484 | 0 |
| D | 0 | 484 | 0 |
| Mode M0 | |||
|---|---|---|---|
| Quadrant | BADHDUFLAG | Total packets | Discarded packets |
| A | 0 | 48884 | 5 |
| B | 0 | 50779 | 4 |
| C | 0 | 48750 | 4 |
| D | 0 | 55238 | 7 |
| Quadrant | Total seconds | Saturated seconds | Saturation percentage |
|---|---|---|---|
| A | 23884 | 98 | 0.410317% |
| B | 23884 | 132 | 0.552671% |
| C | 23884 | 72 | 0.301457% |
| D | 23883 | 407 | 1.704141% |
Noise dominated data is calculated using 1-second bins in cleaned event files. If a bin has >2000 counts, and if more than 50% of those come from <1% of pixels, then it is considered to be noise-dominated and hence unusable.
| Quadrant | # 1 sec bins | Bins with >0 counts | Bins with >2000 counts | High rate bins dominated by noise | Noise dominated (total time) | Noise dominated (detector-on time) | Marked lightcurve |
|---|---|---|---|---|---|---|---|
| A | 38084 | 23889 | 2 | 2 | 0.01% | 0.01% | 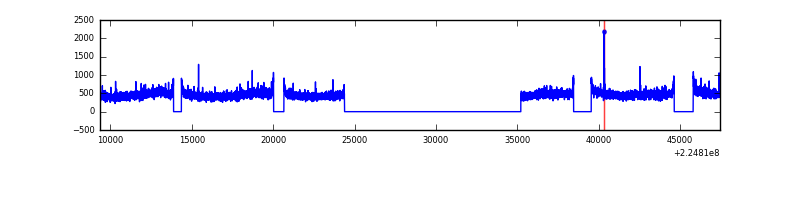 |
| B | 38084 | 23889 | 11 | 11 | 0.03% | 0.05% | 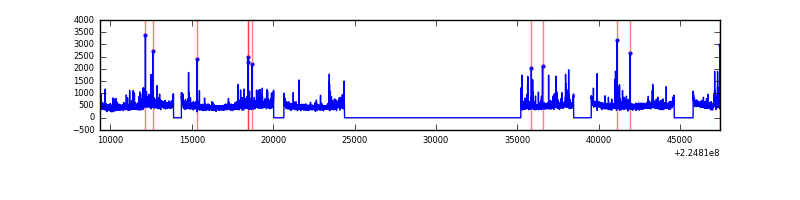 |
| C | 38084 | 23889 | 3 | 3 | 0.01% | 0.01% | 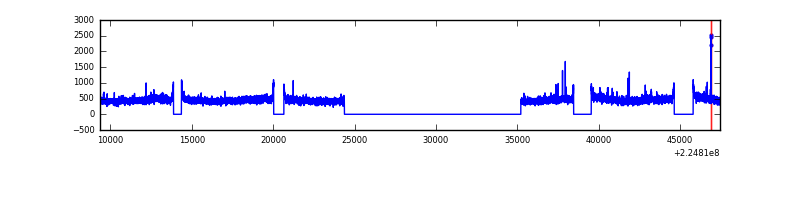 |
| D | 38084 | 23888 | 317 | 317 | 0.83% | 1.33% | 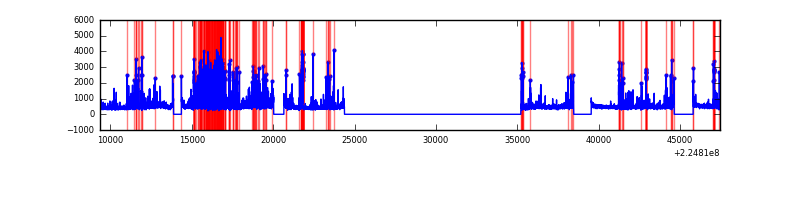 |
Top three noisy pixels from each quadrant. If the there are fewer than three noisy pixels in the level2.evt file, extra rows are filled as -1
| Pixel properties | Quadrant properties | ||||||
|---|---|---|---|---|---|---|---|
| Quadrant | DetID | PixID | Counts | Sigma | Mean | Median | Sigma |
| A | 15 | 239 | 34824 | 55.28 | 2874 | 2823 | 578.9 |
| A | 0 | 23 | 30679 | 48.12 | 2874 | 2823 | 578.9 |
| A | 0 | 226 | 29132 | 45.45 | 2874 | 2823 | 578.9 |
| B | 0 | 214 | 436121 | 800.22 | 2892 | 2828 | 541.5 |
| B | 0 | 219 | 96161 | 172.37 | 2892 | 2828 | 541.5 |
| B | 4 | 173 | 52561 | 91.85 | 2892 | 2828 | 541.5 |
| C | 1 | 16 | 23019 | 31.36 | 2806 | 2822 | 644.1 |
| C | 13 | 61 | 21576 | 29.12 | 2806 | 2822 | 644.1 |
| C | 8 | 128 | 20545 | 27.52 | 2806 | 2822 | 644.1 |
| D | 1 | 52 | 1193677 | 1726.99 | 2803 | 2718 | 689.6 |
| D | 2 | 14 | 310491 | 446.3 | 2803 | 2718 | 689.6 |
| D | 2 | 136 | 290980 | 418.0 | 2803 | 2718 | 689.6 |
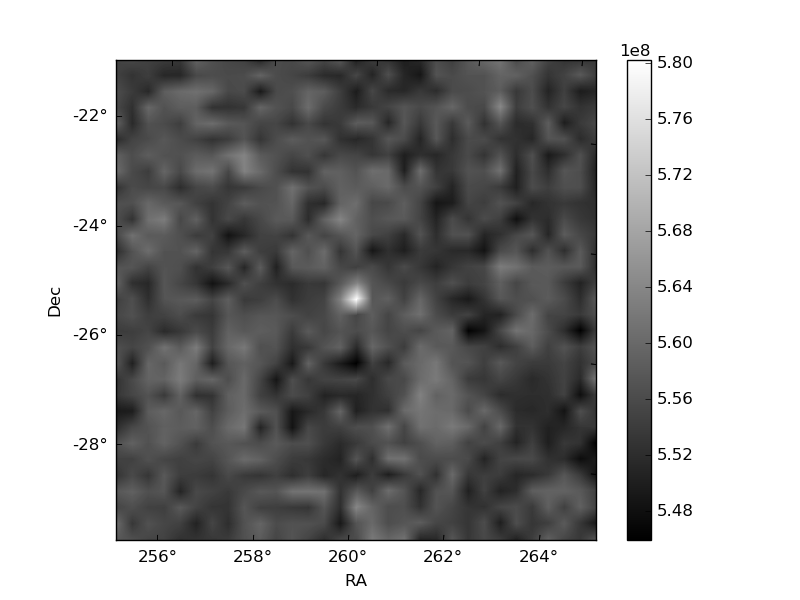
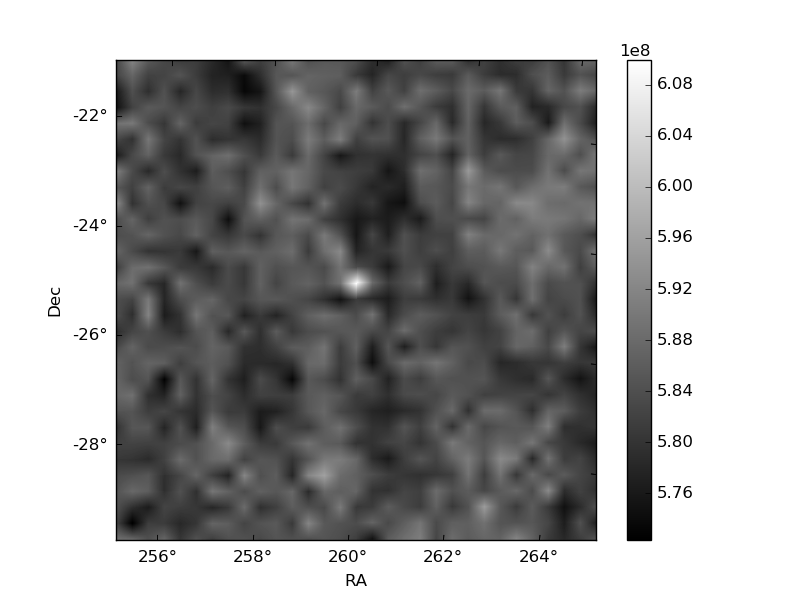
Histogram calculated using DETX and DETY for each event in the final _common_clean file
| Quadrant A | 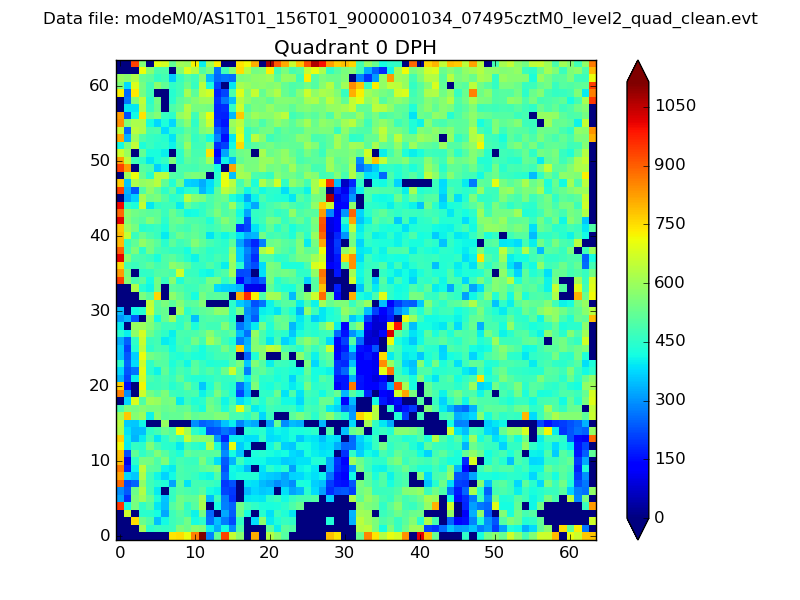 |
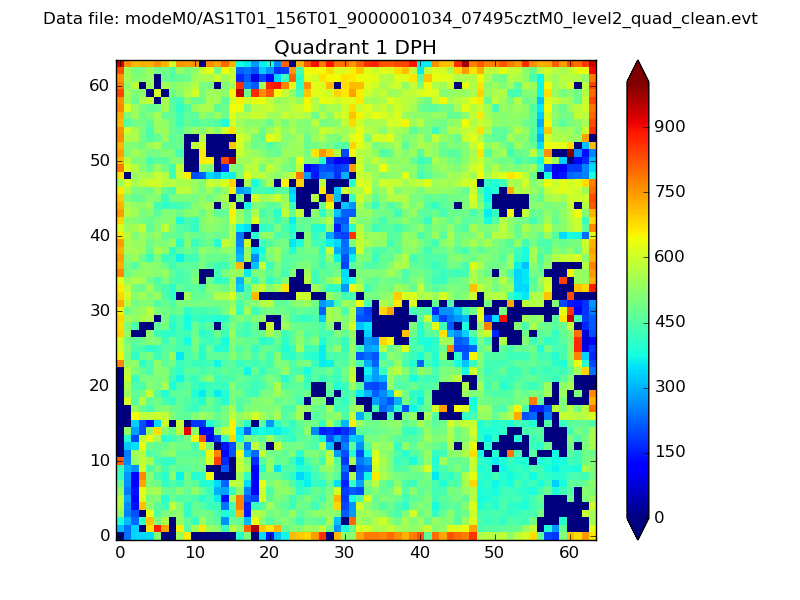 |
Quadrant B |
|---|---|---|---|
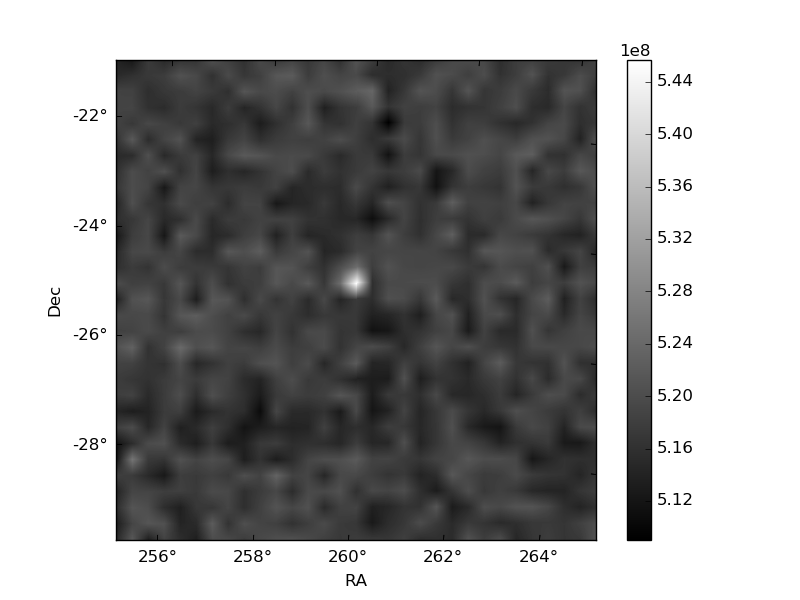
| Quadrant D | 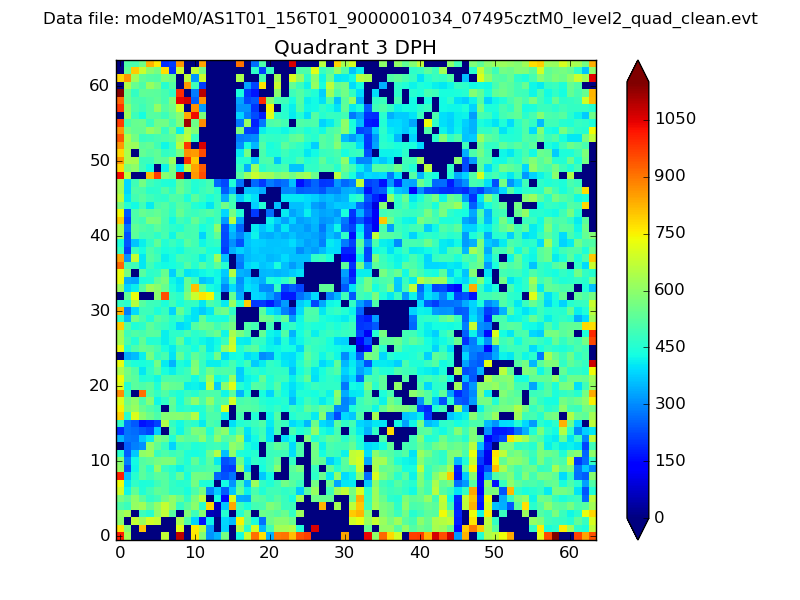 |
 |
Quadrant C |
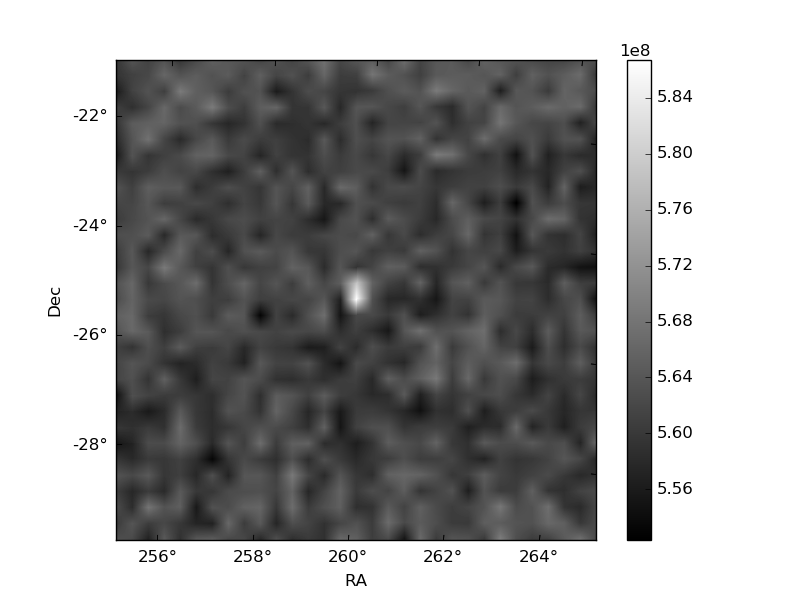
| Plot type | Count rate plots | Images |
|---|---|---|
| Comparison with Poisson distribution Blue bars denote a histogram of data divided into 1 sec bins. Red curve is a Poisson curve with rate = median count rate of data. |
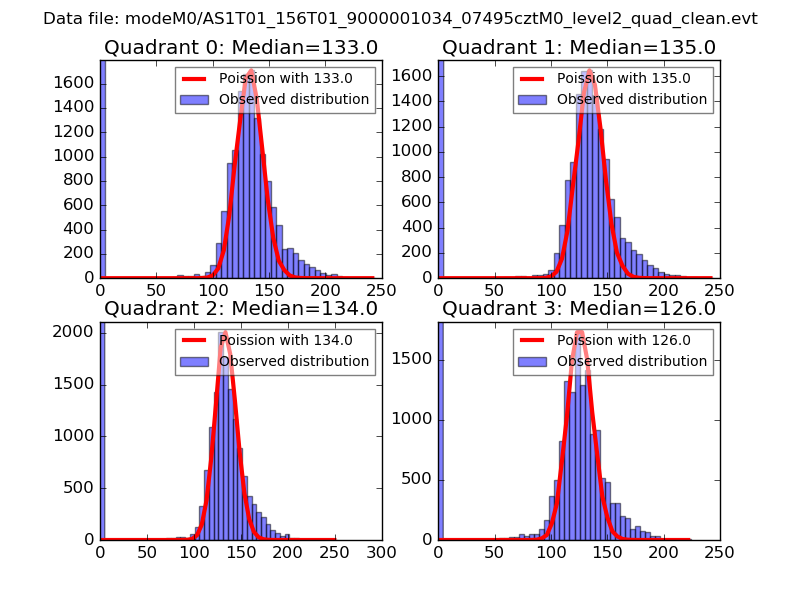 |
 |
| Quadrant-wise count rates Data is divided into 100 sec bins |
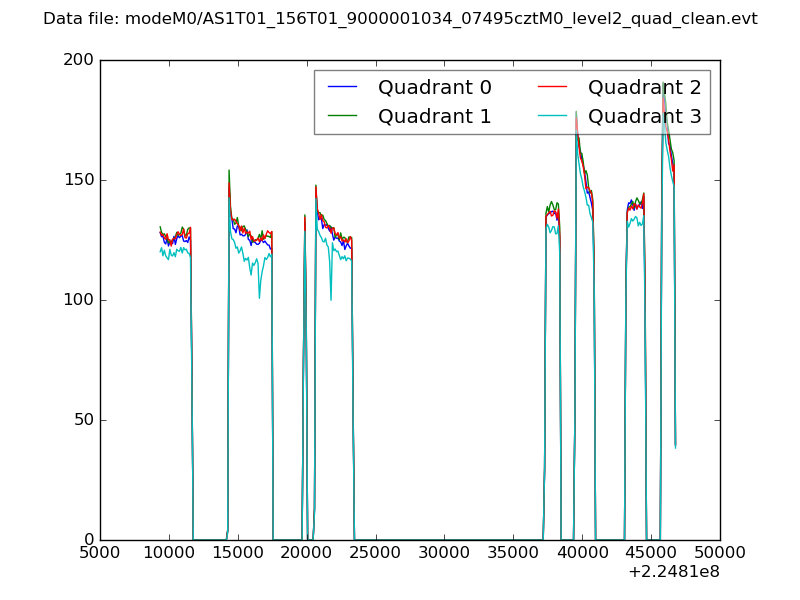 |
|
| Module-wise count rates for Quadrant A Data is divided into 100 sec bins |
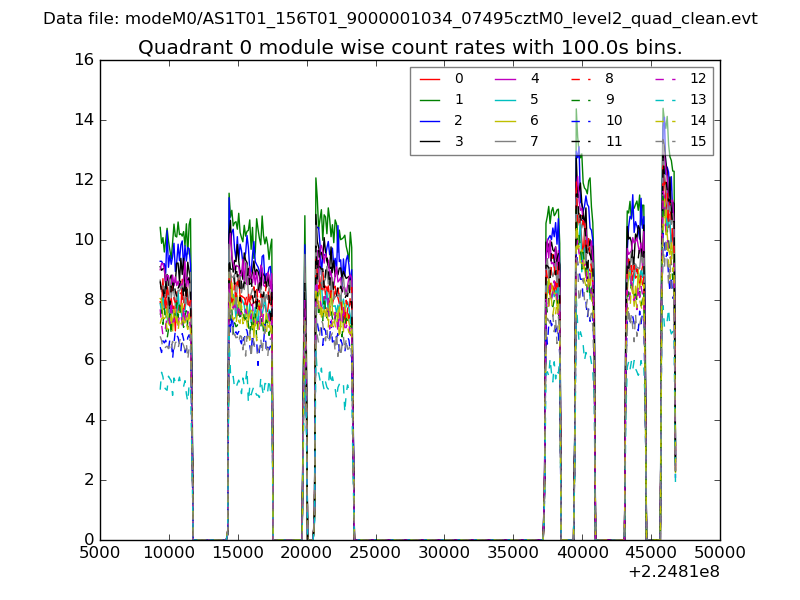 |
 |
| Module-wise count rates for Quadrant B Data is divided into 100 sec bins |
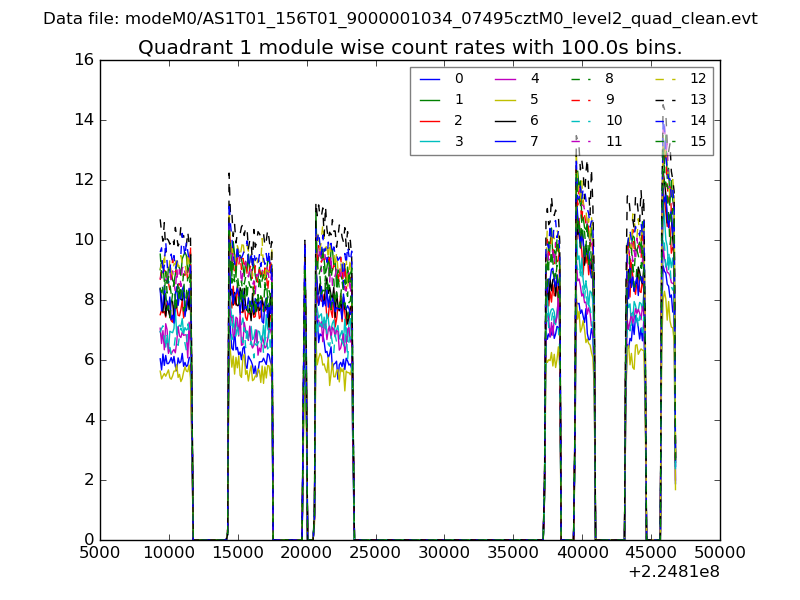 |
 |
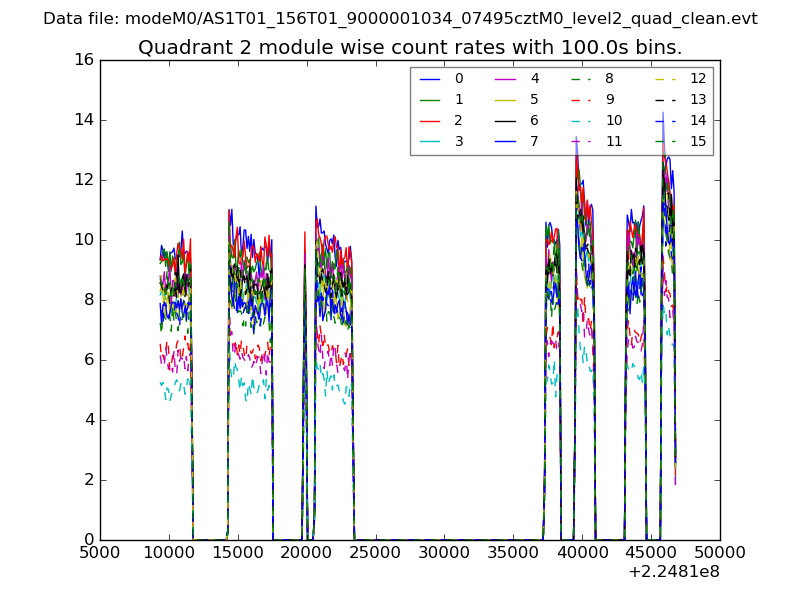
| Module-wise count rates for Quadrant C Data is divided into 100 sec bins |
 |
 |
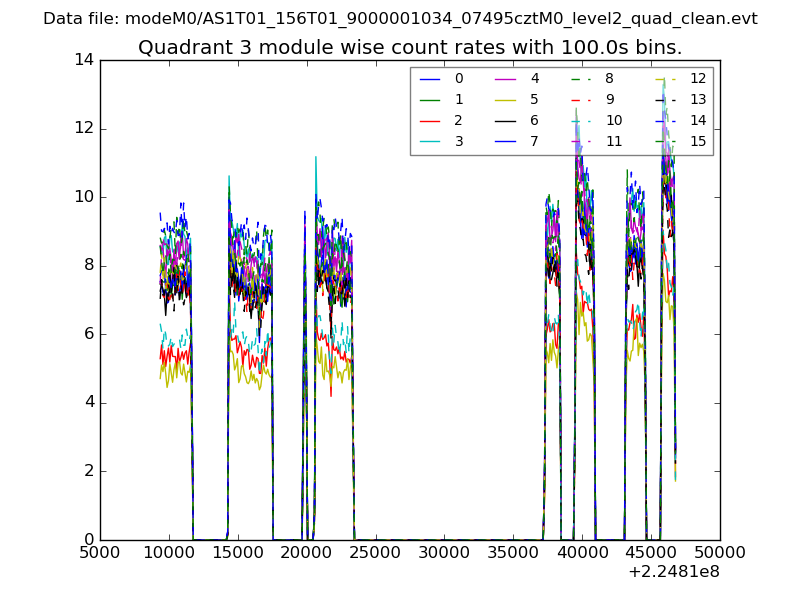
| Module-wise count rates for Quadrant D Data is divided into 100 sec bins |
 |
 |
| Parameter | Plot |
|---|---|
| CZT HV Monitor | 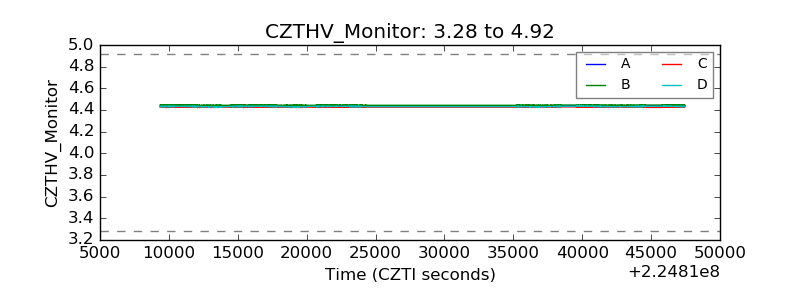 |
| D_VDD | 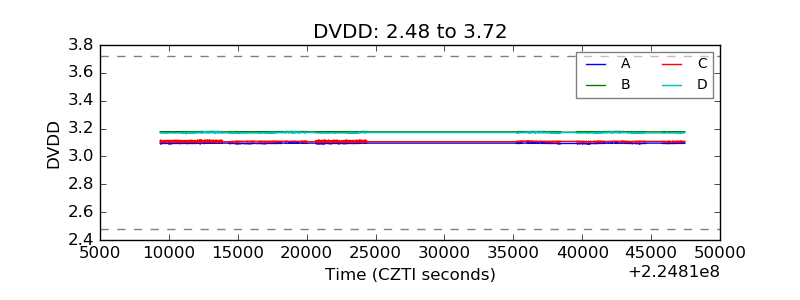 |
| Temperature 1 | 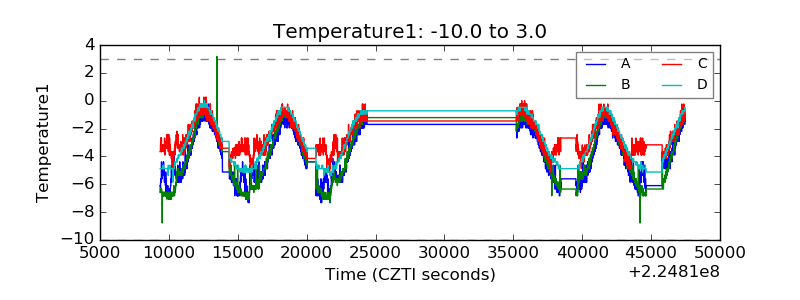 |
| Veto HV Monitor | 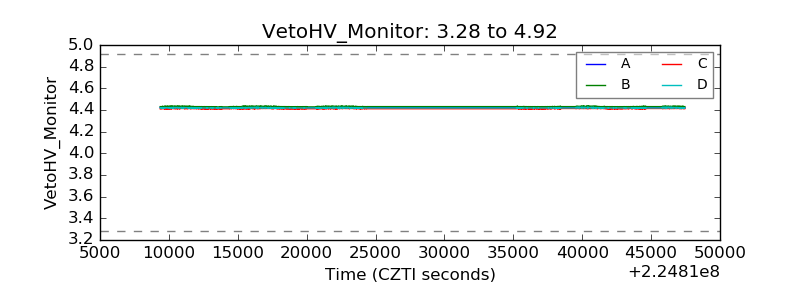 |
| Veto LLD | 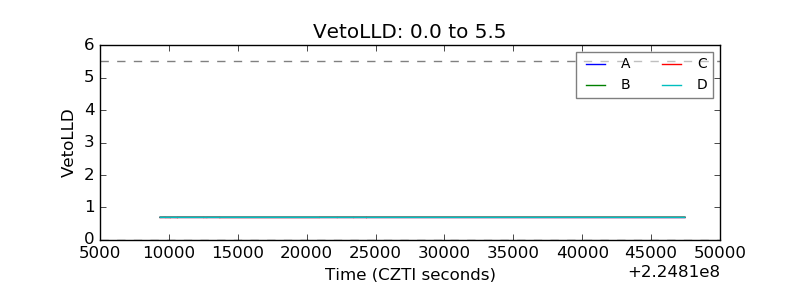 |
| Alpha Counter | 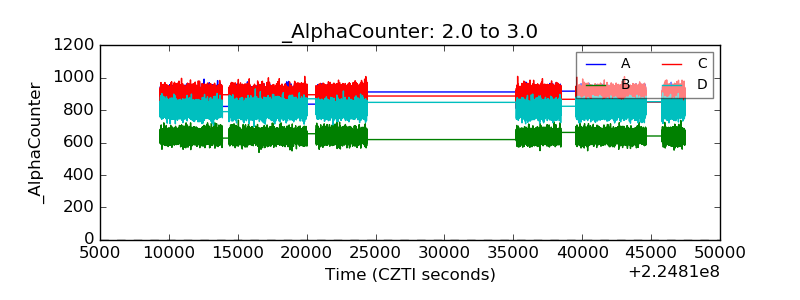 |
| _CPM_Rate | 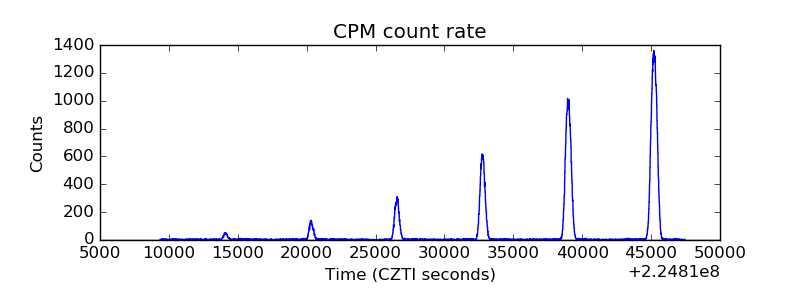 |
| CZT Counter |  |
| +2.5 Volts monitor |  |
| +5 Volts monitor |  |
| _ROLL_ROT | 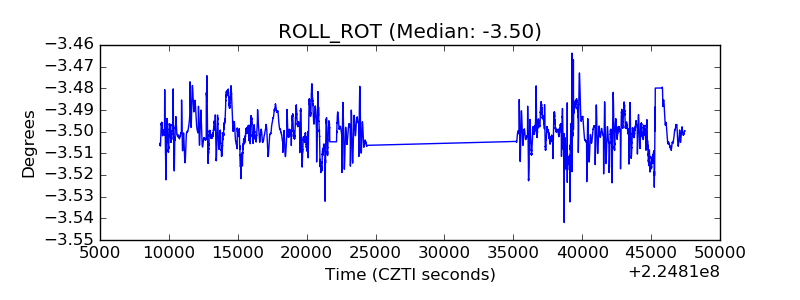 |
| _Roll_DEC | 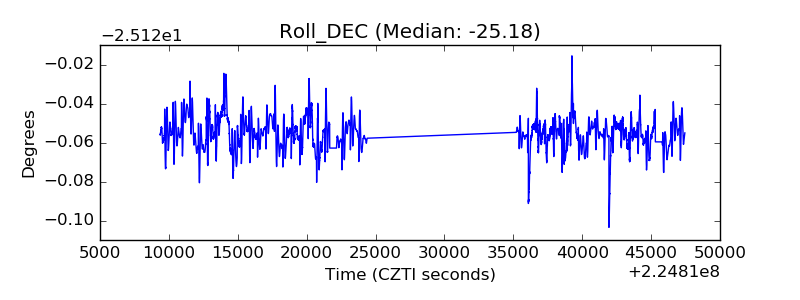 |
| _Roll_RA |  |
| Veto Counter | 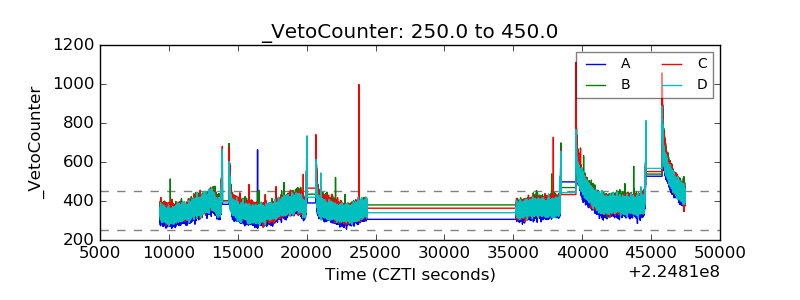 |