| Param | Original file | Final file |
|---|---|---|
| Filename | modeM0/AS1T01_156T01_9000001034_07497cztM0_level2.evt | modeM0/AS1T01_156T01_9000001034_07497cztM0_level2_quad_clean.evt |
| Size (bytes) | 2,753,985,600 | 480,651,840 |
| Size | 2.6 GB | 458.4 MB |
| Events in quadrant A | 19,195,075 | 2,981,307 |
| Events in quadrant B | 20,501,413 | 3,032,049 |
| Events in quadrant C | 18,815,649 | 2,998,412 |
| Events in quadrant D | 22,211,262 | 2,818,485 |
| Mode M9 | |||
|---|---|---|---|
| Quadrant | BADHDUFLAG | Total packets | Discarded packets |
| A | 0 | 76 | 0 |
| B | 0 | 76 | 0 |
| C | 0 | 76 | 0 |
| D | 0 | 76 | 0 |
| Mode SS | |||
|---|---|---|---|
| Quadrant | BADHDUFLAG | Total packets | Discarded packets |
| A | 0 | 810 | 0 |
| B | 0 | 810 | 0 |
| C | 0 | 810 | 0 |
| D | 0 | 810 | 0 |
| Mode M0 | |||
|---|---|---|---|
| Quadrant | BADHDUFLAG | Total packets | Discarded packets |
| A | 0 | 82175 | 8 |
| B | 0 | 85458 | 7 |
| C | 0 | 81670 | 7 |
| D | 0 | 92104 | 7 |
| Quadrant | Total seconds | Saturated seconds | Saturation percentage |
|---|---|---|---|
| A | 39729 | 340 | 0.855798% |
| B | 39729 | 406 | 1.021924% |
| C | 39729 | 278 | 0.699741% |
| D | 39729 | 868 | 2.184802% |
Noise dominated data is calculated using 1-second bins in cleaned event files. If a bin has >2000 counts, and if more than 50% of those come from <1% of pixels, then it is considered to be noise-dominated and hence unusable.
| Quadrant | # 1 sec bins | Bins with >0 counts | Bins with >2000 counts | High rate bins dominated by noise | Noise dominated (total time) | Noise dominated (detector-on time) | Marked lightcurve |
|---|---|---|---|---|---|---|---|
| A | 47289 | 39734 | 3 | 3 | 0.01% | 0.01% | 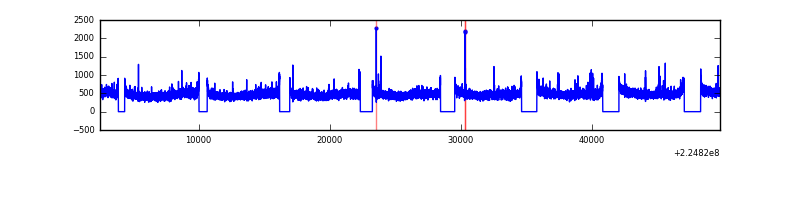 |
| B | 47289 | 39735 | 18 | 18 | 0.04% | 0.05% | 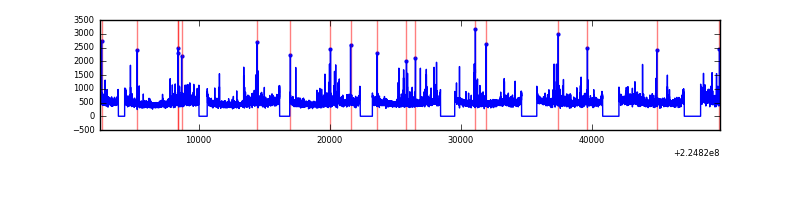 |
| C | 47289 | 39735 | 3 | 3 | 0.01% | 0.01% | 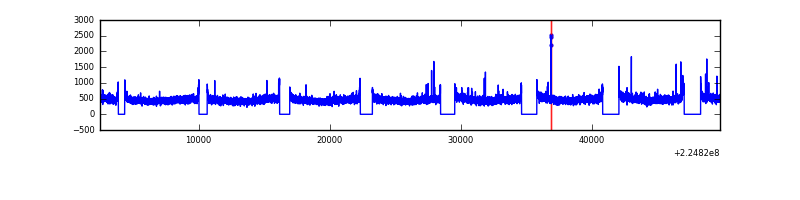 |
| D | 47289 | 39734 | 517 | 517 | 1.09% | 1.30% | 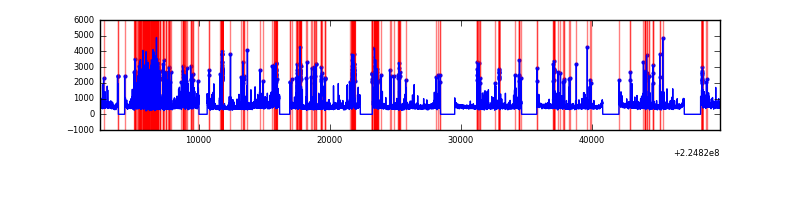 |
Top three noisy pixels from each quadrant. If the there are fewer than three noisy pixels in the level2.evt file, extra rows are filled as -1
| Pixel properties | Quadrant properties | ||||||
|---|---|---|---|---|---|---|---|
| Quadrant | DetID | PixID | Counts | Sigma | Mean | Median | Sigma |
| A | 15 | 239 | 65428 | 61.13 | 4933 | 4840 | 991.2 |
| A | 0 | 23 | 58915 | 54.56 | 4933 | 4840 | 991.2 |
| A | 0 | 226 | 50804 | 46.37 | 4933 | 4840 | 991.2 |
| B | 0 | 214 | 748398 | 803.01 | 4957 | 4857 | 925.9 |
| B | 0 | 219 | 175292 | 184.07 | 4957 | 4857 | 925.9 |
| B | 12 | 111 | 88309 | 90.13 | 4957 | 4857 | 925.9 |
| C | 1 | 16 | 38641 | 30.73 | 4797 | 4839 | 1100.0 |
| C | 13 | 61 | 36811 | 29.07 | 4797 | 4839 | 1100.0 |
| C | 12 | 4 | 25671 | 18.94 | 4797 | 4839 | 1100.0 |
| D | 1 | 52 | 1532951 | 1311.81 | 4786 | 4646 | 1165.0 |
| D | 2 | 152 | 745217 | 635.67 | 4786 | 4646 | 1165.0 |
| D | 2 | 136 | 486677 | 413.75 | 4786 | 4646 | 1165.0 |
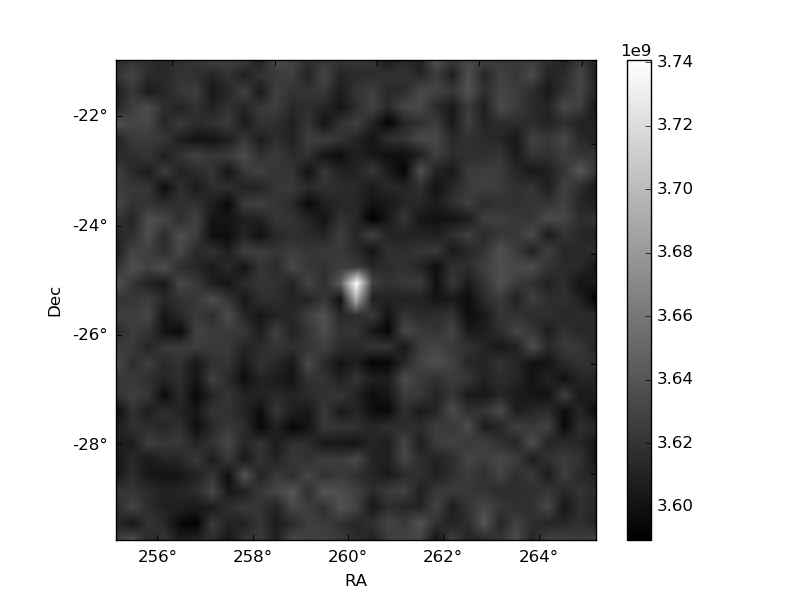
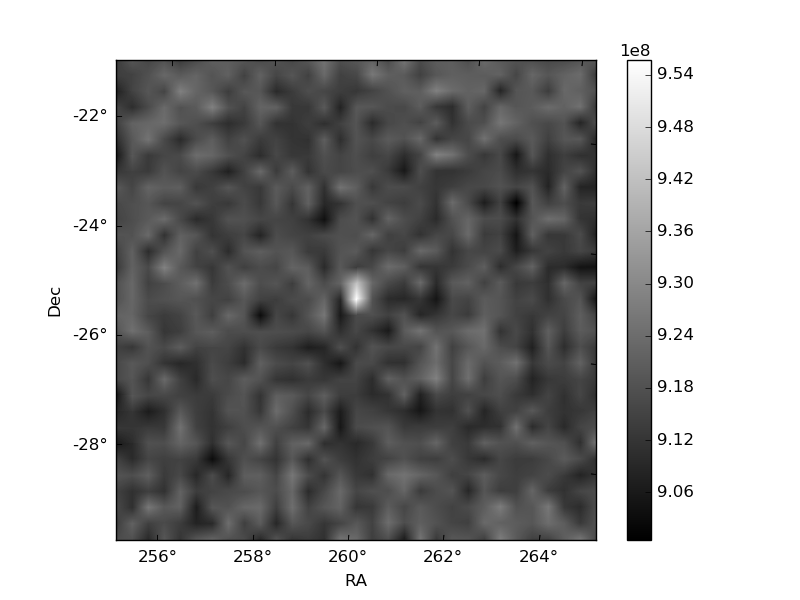
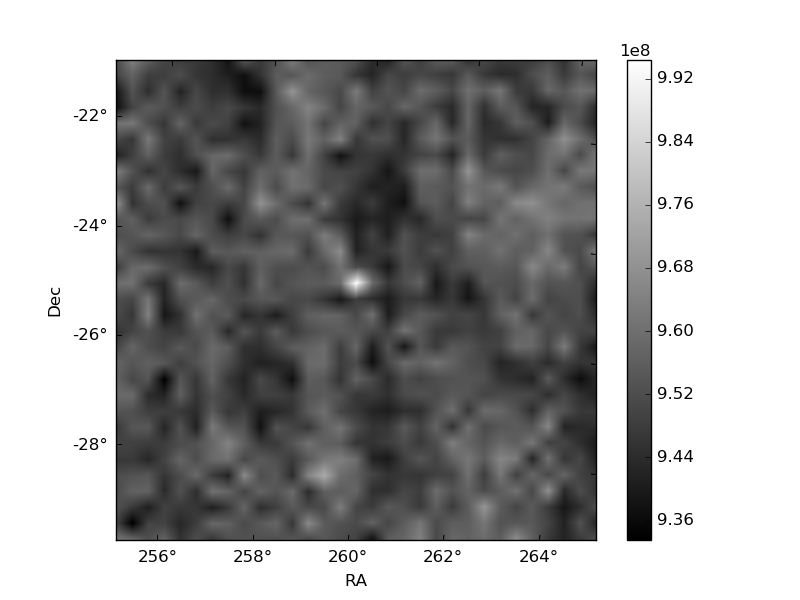
Histogram calculated using DETX and DETY for each event in the final _common_clean file
| Quadrant A | 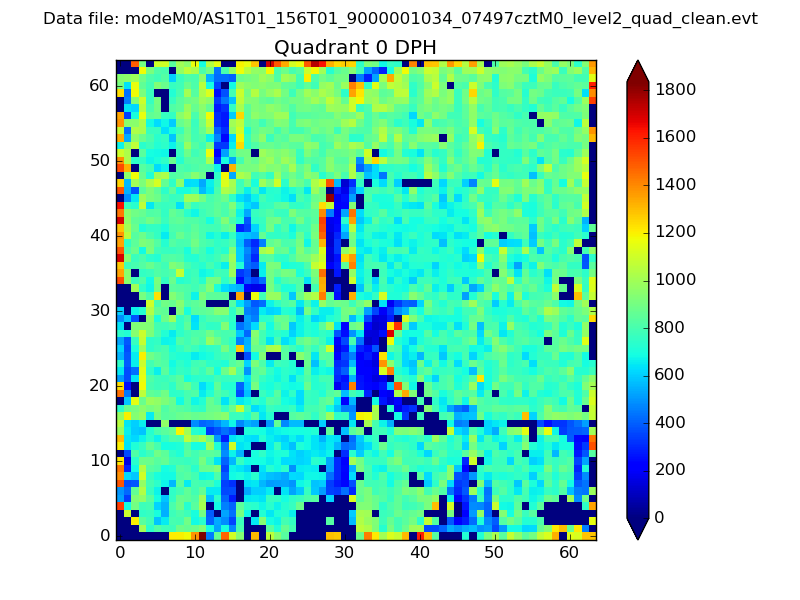 |
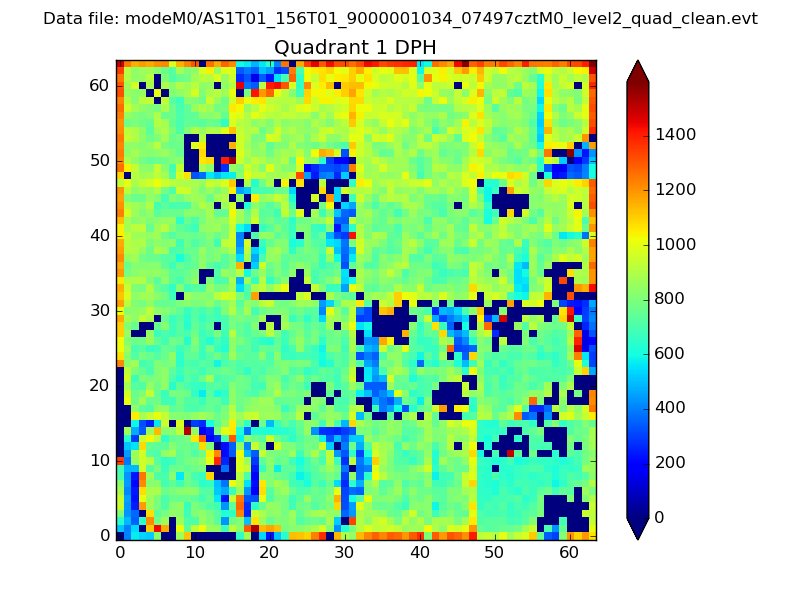 |
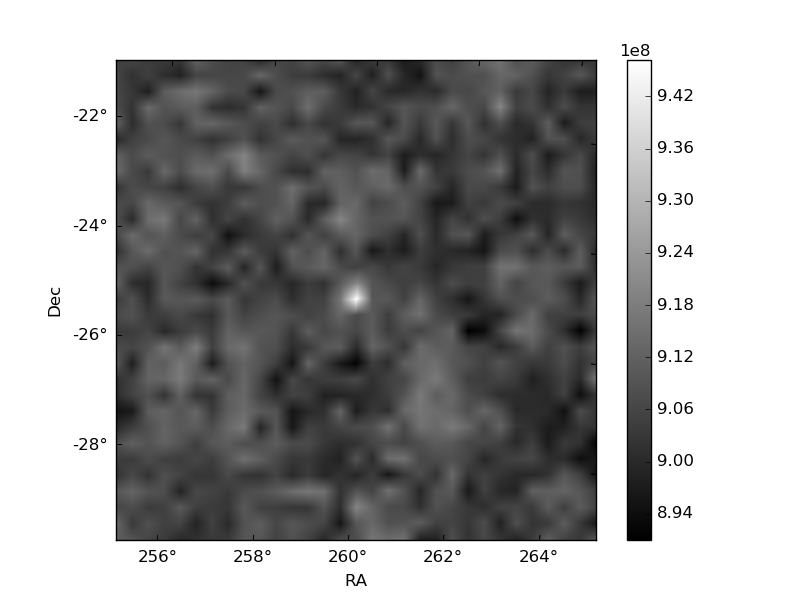
Quadrant B |
|---|---|---|---|
| Quadrant D | 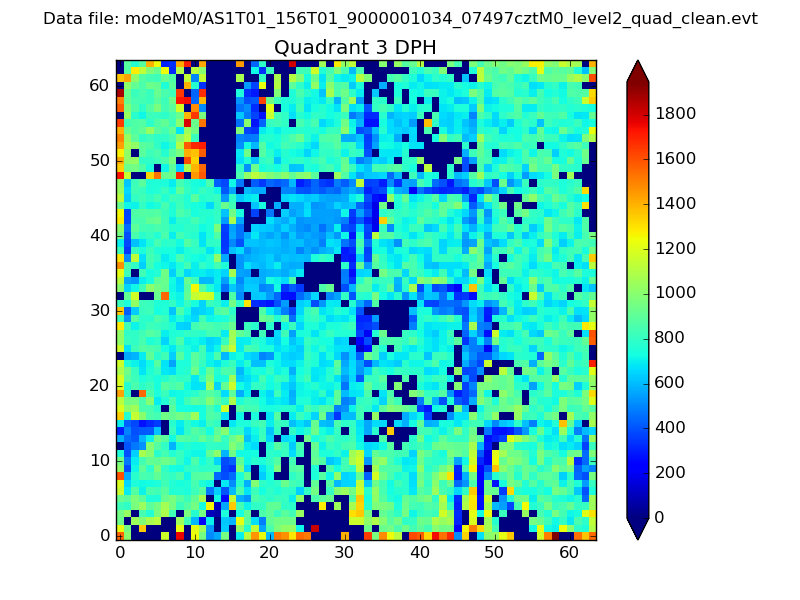 |
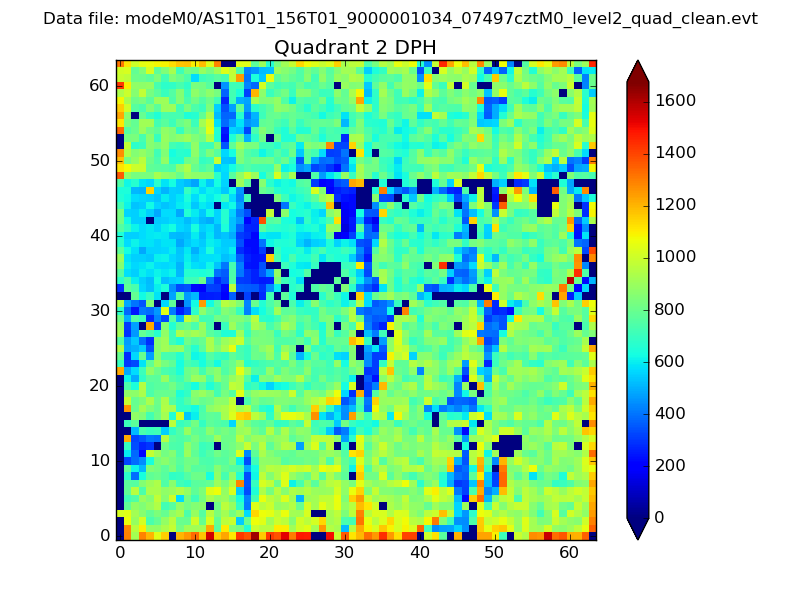 |
Quadrant C |
| Plot type | Count rate plots | Images |
|---|---|---|
| Comparison with Poisson distribution Blue bars denote a histogram of data divided into 1 sec bins. Red curve is a Poisson curve with rate = median count rate of data. |
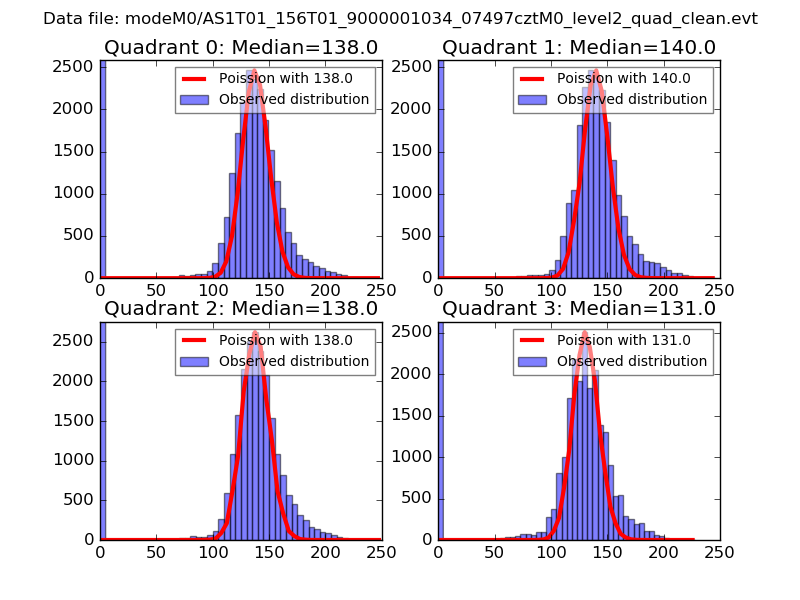 |
 |
| Quadrant-wise count rates Data is divided into 100 sec bins |
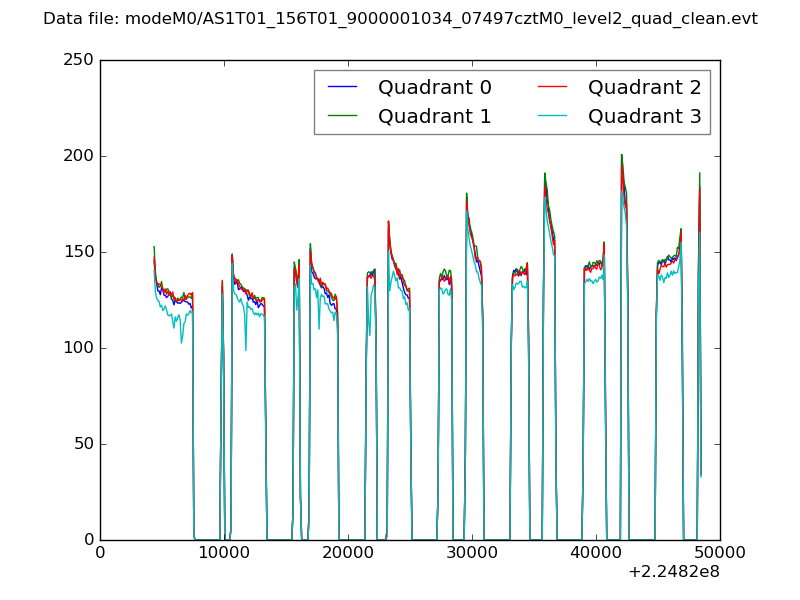 |
|
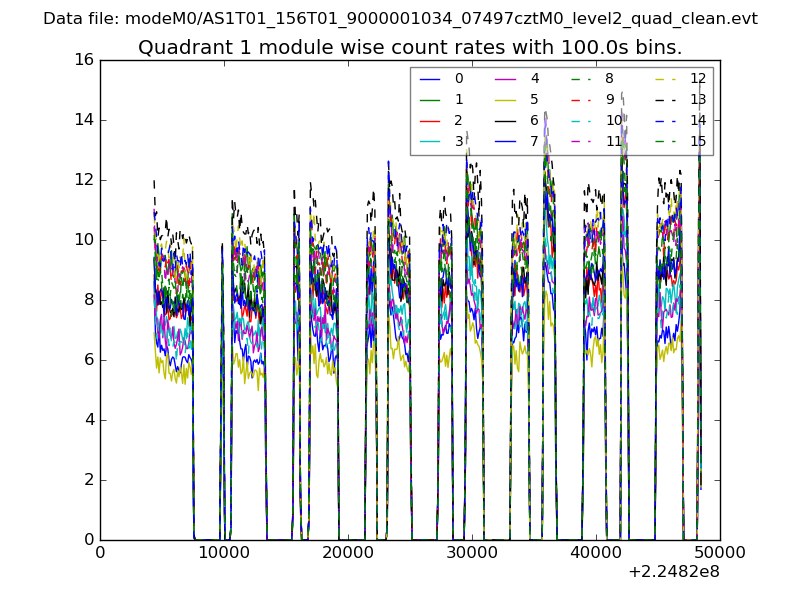
| Module-wise count rates for Quadrant A Data is divided into 100 sec bins |
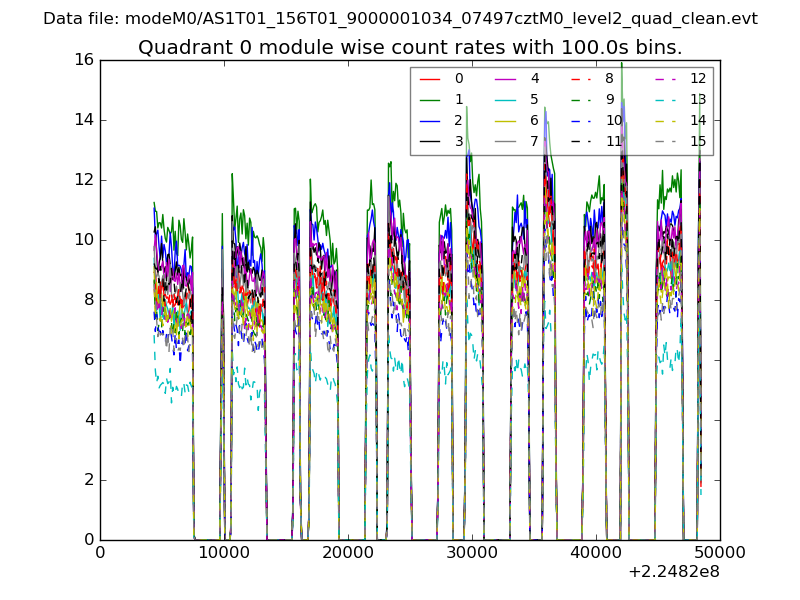 |
 |
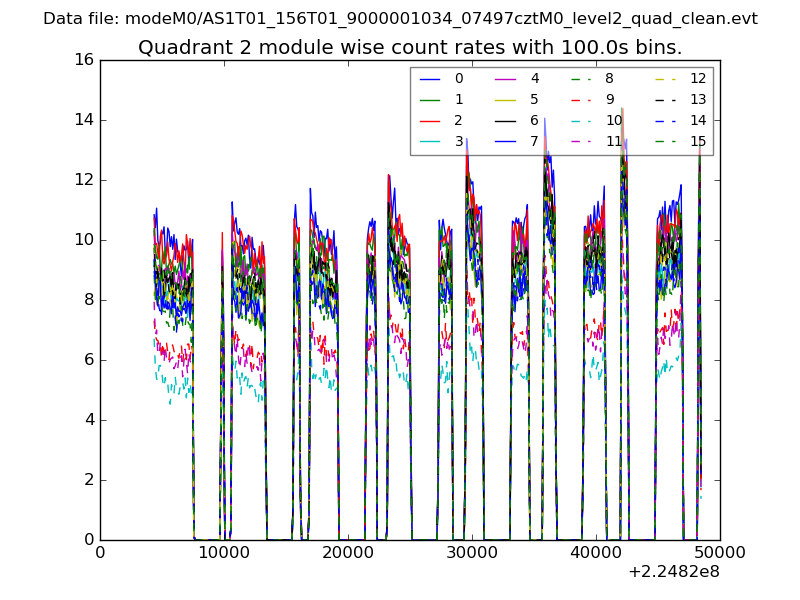
| Module-wise count rates for Quadrant B Data is divided into 100 sec bins |
 |
 |
| Module-wise count rates for Quadrant C Data is divided into 100 sec bins |
 |
 |
| Module-wise count rates for Quadrant D Data is divided into 100 sec bins |
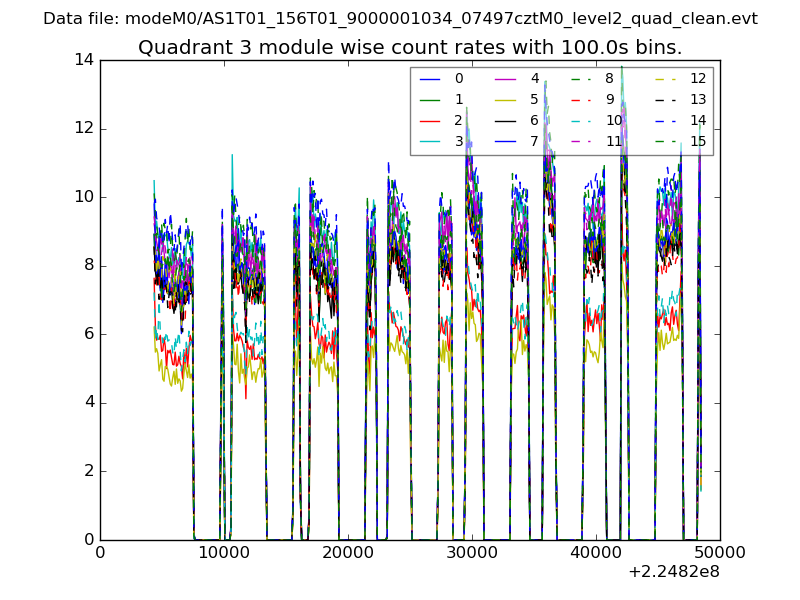 |
 |
| Parameter | Plot |
|---|---|
| CZT HV Monitor | 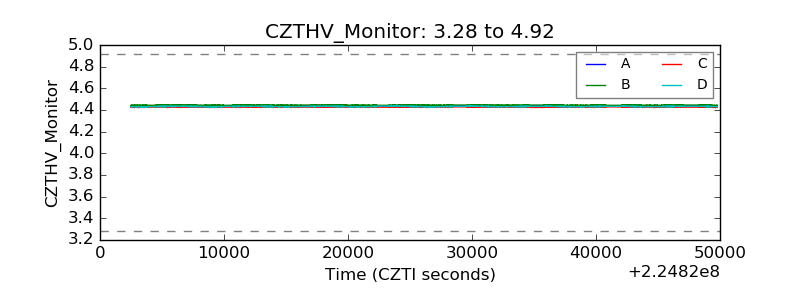 |
| D_VDD | 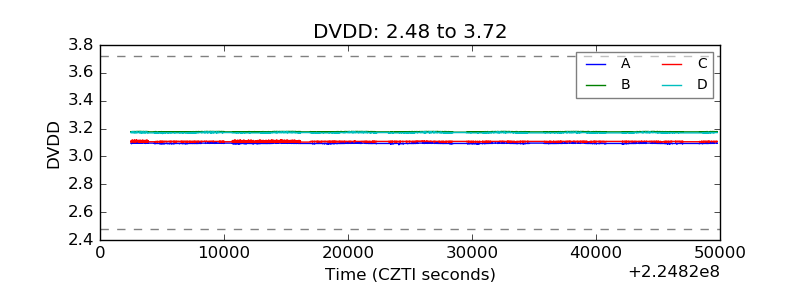 |
| Temperature 1 |  |
| Veto HV Monitor | 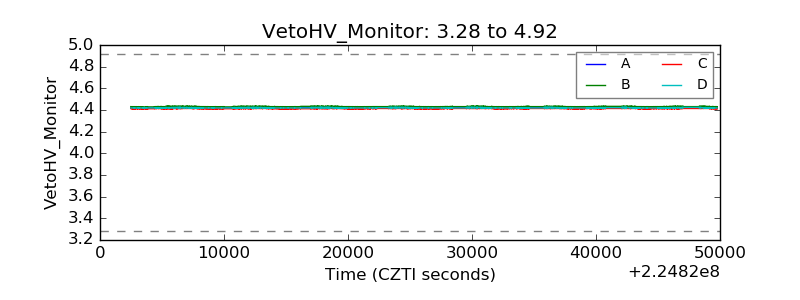 |
| Veto LLD | 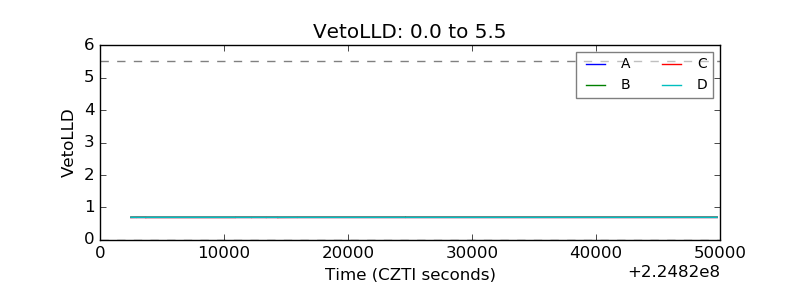 |
| Alpha Counter | 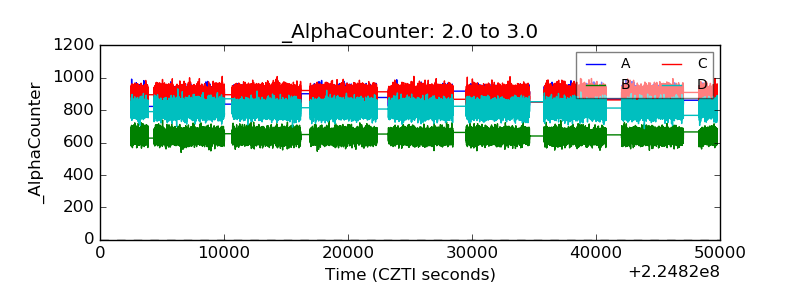 |
| _CPM_Rate | 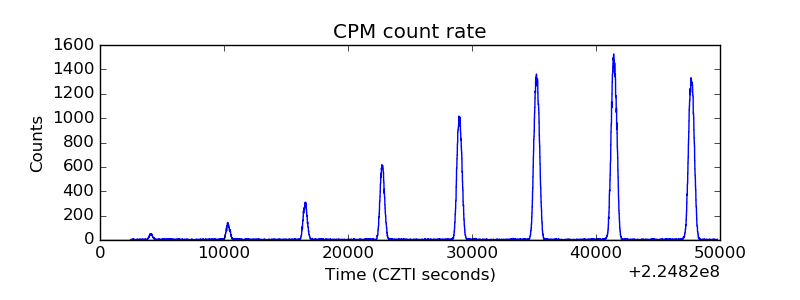 |
| CZT Counter | 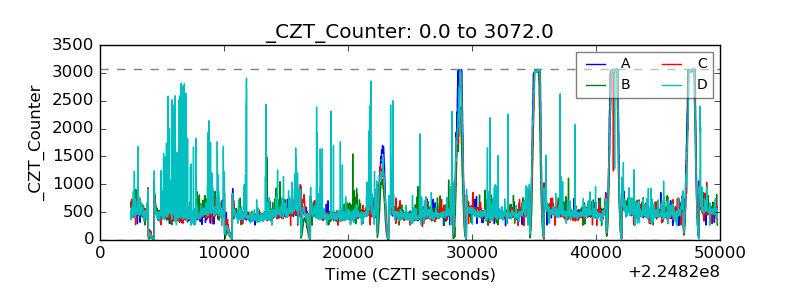 |
| +2.5 Volts monitor |  |
| +5 Volts monitor |  |
| _ROLL_ROT | 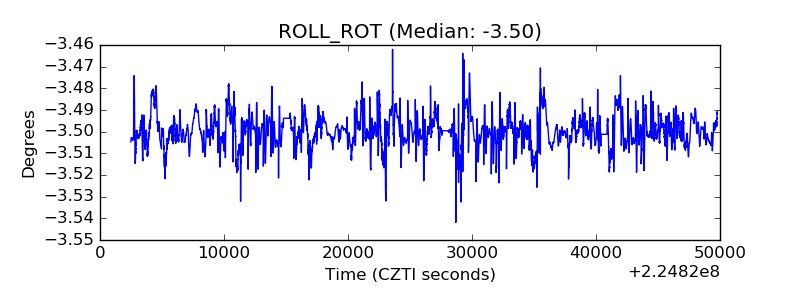 |
| _Roll_DEC |  |
| _Roll_RA | 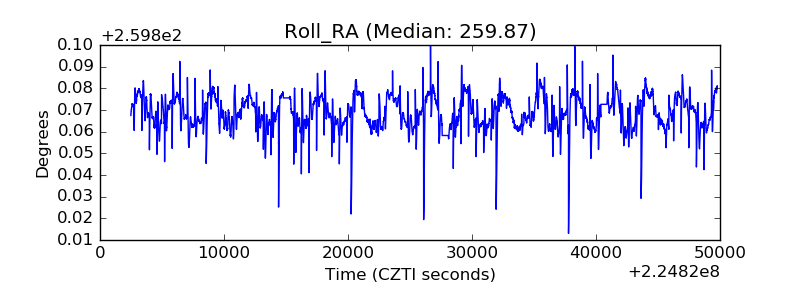 |
| Veto Counter | 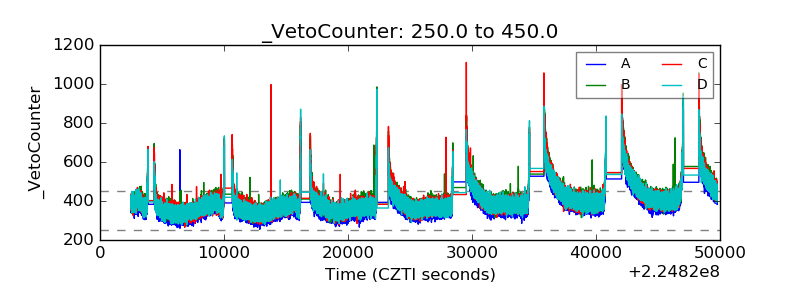 |