| Param | Original file | Final file |
|---|---|---|
| Filename | modeM0/AS1T01_156T01_9000001034_07499cztM0_level2.evt | modeM0/AS1T01_156T01_9000001034_07499cztM0_level2_quad_clean.evt |
| Size (bytes) | 477,262,080 | 73,379,520 |
| Size | 455.2 MB | 70.0 MB |
| Events in quadrant A | 3,320,839 | 444,148 |
| Events in quadrant B | 3,507,068 | 451,962 |
| Events in quadrant C | 3,339,981 | 442,137 |
| Events in quadrant D | 3,835,815 | 421,550 |
| Mode M9 | |||
|---|---|---|---|
| Quadrant | BADHDUFLAG | Total packets | Discarded packets |
| A | 0 | 14 | 0 |
| B | 0 | 14 | 0 |
| C | 0 | 14 | 0 |
| D | 0 | 15 | 0 |
| Mode SS | |||
|---|---|---|---|
| Quadrant | BADHDUFLAG | Total packets | Discarded packets |
| A | 0 | 134 | 0 |
| B | 0 | 134 | 0 |
| C | 0 | 134 | 0 |
| D | 0 | 134 | 0 |
| Mode M0 | |||
|---|---|---|---|
| Quadrant | BADHDUFLAG | Total packets | Discarded packets |
| A | 0 | 13967 | 3 |
| B | 0 | 14540 | 2 |
| C | 0 | 14121 | 2 |
| D | 0 | 15828 | 2 |
| Quadrant | Total seconds | Saturated seconds | Saturation percentage |
|---|---|---|---|
| A | 6628 | 142 | 2.142426% |
| B | 6628 | 150 | 2.263126% |
| C | 6628 | 96 | 1.448401% |
| D | 6628 | 193 | 2.911889% |
Noise dominated data is calculated using 1-second bins in cleaned event files. If a bin has >2000 counts, and if more than 50% of those come from <1% of pixels, then it is considered to be noise-dominated and hence unusable.
| Quadrant | # 1 sec bins | Bins with >0 counts | Bins with >2000 counts | High rate bins dominated by noise | Noise dominated (total time) | Noise dominated (detector-on time) | Marked lightcurve |
|---|---|---|---|---|---|---|---|
| A | 7713 | 6628 | 0 | 0 | 0.00% | 0.00% | 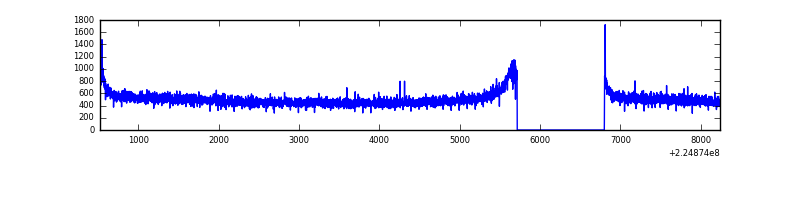 |
| B | 7713 | 6628 | 2 | 2 | 0.03% | 0.03% | 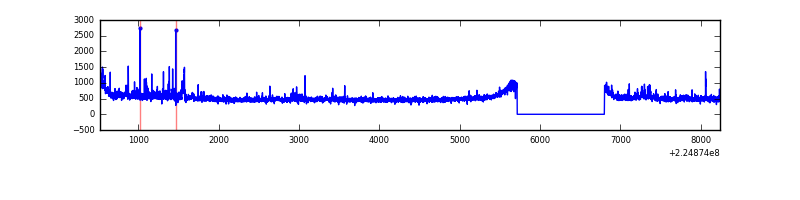 |
| C | 7713 | 6629 | 6 | 6 | 0.08% | 0.09% | 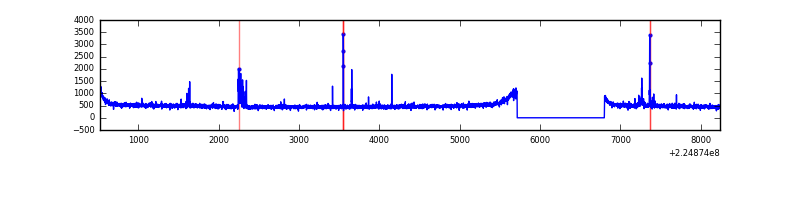 |
| D | 7713 | 6629 | 61 | 61 | 0.79% | 0.92% | 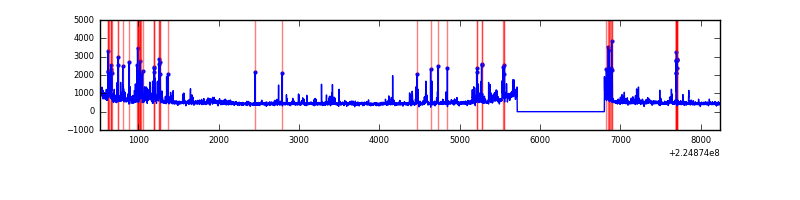 |
Top three noisy pixels from each quadrant. If the there are fewer than three noisy pixels in the level2.evt file, extra rows are filled as -1
| Pixel properties | Quadrant properties | ||||||
|---|---|---|---|---|---|---|---|
| Quadrant | DetID | PixID | Counts | Sigma | Mean | Median | Sigma |
| A | 15 | 239 | 16344 | 89.53 | 853 | 836 | 173.2 |
| A | 3 | 1 | 9531 | 50.2 | 853 | 836 | 173.2 |
| A | 0 | 226 | 8442 | 43.91 | 853 | 836 | 173.2 |
| B | 0 | 214 | 89775 | 542.64 | 857 | 838 | 163.9 |
| B | 4 | 81 | 27575 | 163.13 | 857 | 838 | 163.9 |
| B | 0 | 219 | 27099 | 160.23 | 857 | 838 | 163.9 |
| C | 1 | 16 | 97590 | 504.87 | 825 | 831 | 191.6 |
| C | 8 | 229 | 22720 | 114.21 | 825 | 831 | 191.6 |
| C | 13 | 61 | 6269 | 28.37 | 825 | 831 | 191.6 |
| D | 2 | 152 | 314986 | 1555.26 | 823 | 799 | 202.0 |
| D | 2 | 14 | 194449 | 958.59 | 823 | 799 | 202.0 |
| D | 12 | 233 | 80503 | 394.54 | 823 | 799 | 202.0 |
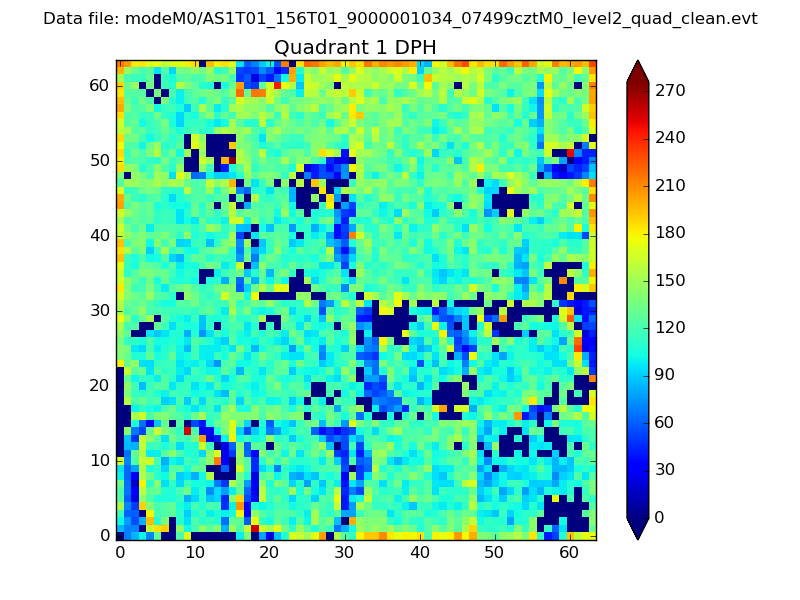
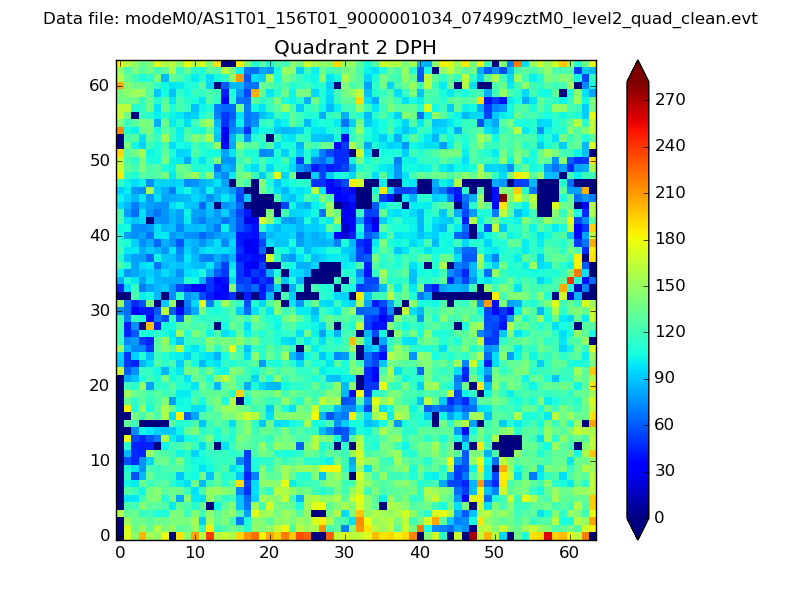
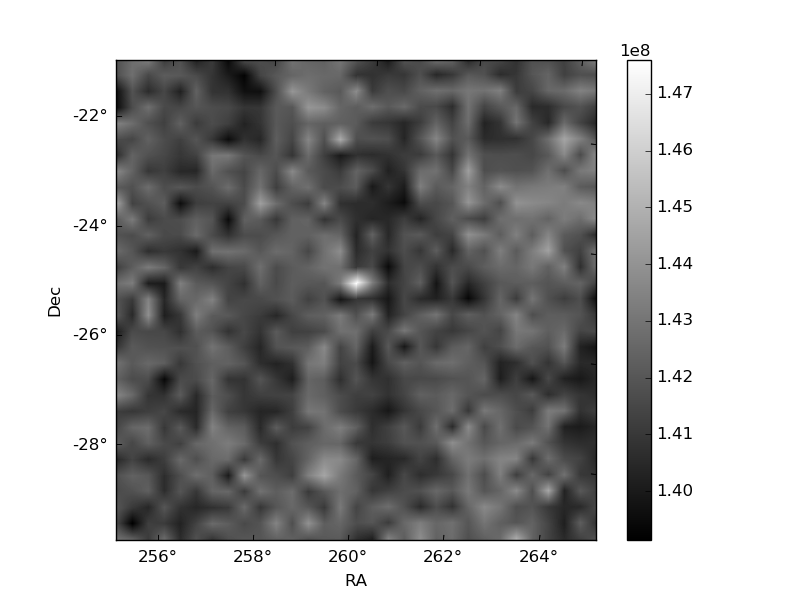
Histogram calculated using DETX and DETY for each event in the final _common_clean file
| Quadrant A |  |
 |
Quadrant B |
|---|---|---|---|
| Quadrant D |  |
 |
Quadrant C |
| Plot type | Count rate plots | Images |
|---|---|---|
| Comparison with Poisson distribution Blue bars denote a histogram of data divided into 1 sec bins. Red curve is a Poisson curve with rate = median count rate of data. |
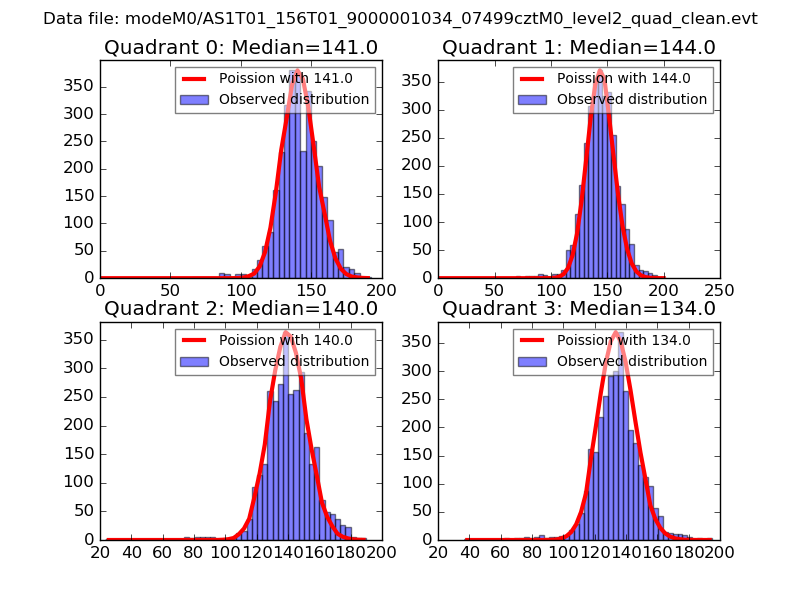 |
 |
| Quadrant-wise count rates Data is divided into 100 sec bins |
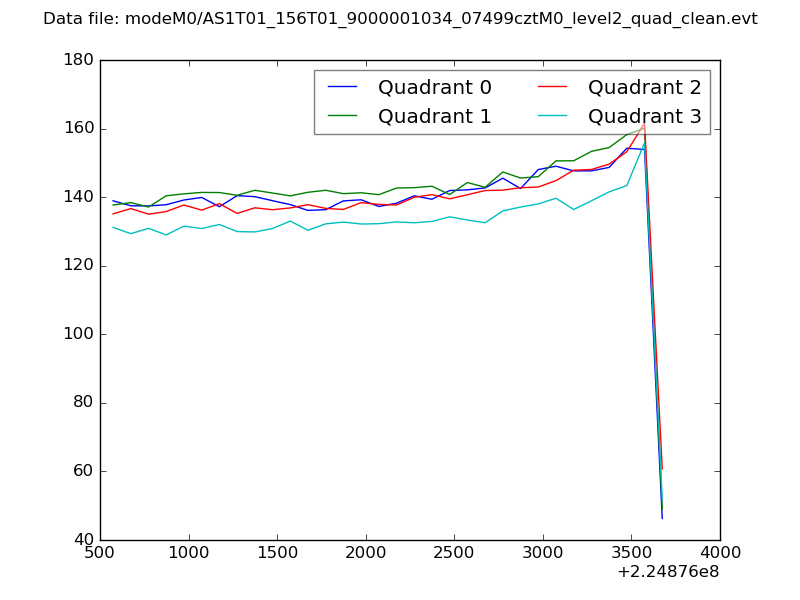 |
|
| Module-wise count rates for Quadrant A Data is divided into 100 sec bins |
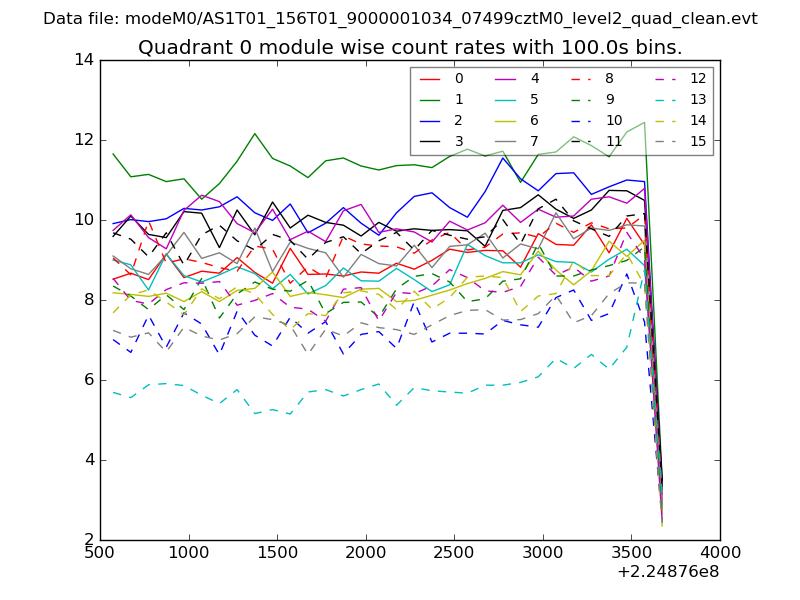 |
 |
| Module-wise count rates for Quadrant B Data is divided into 100 sec bins |
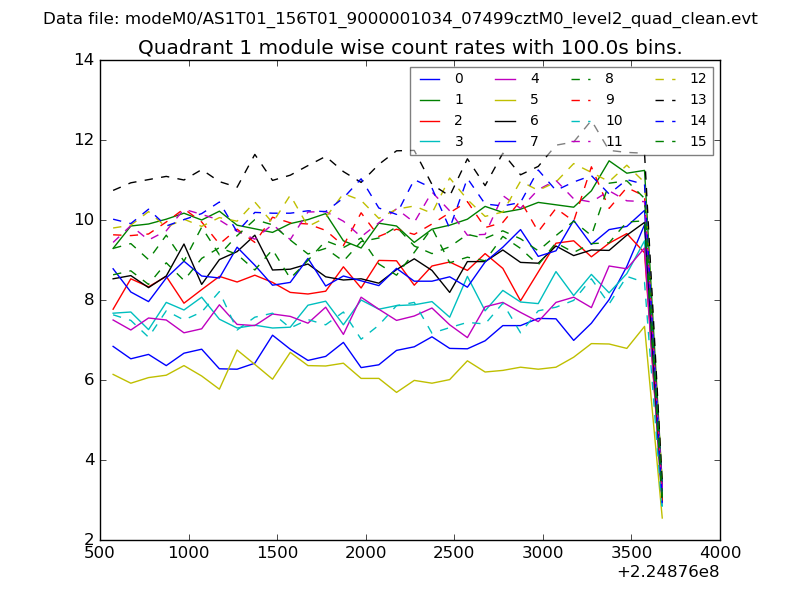 |
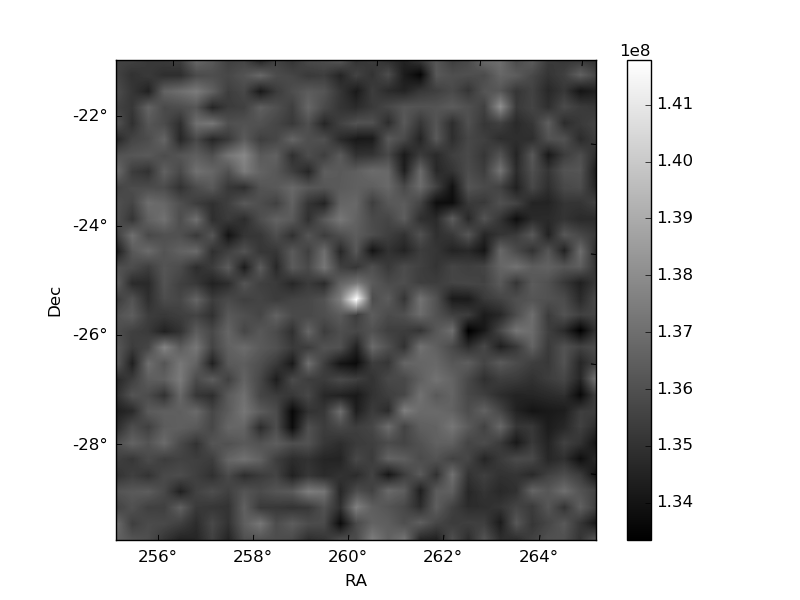 |
| Module-wise count rates for Quadrant C Data is divided into 100 sec bins |
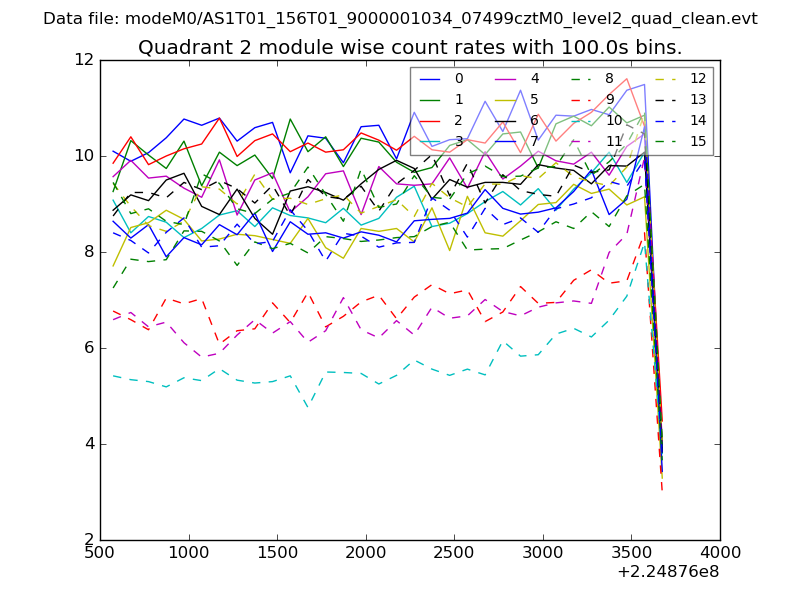 |
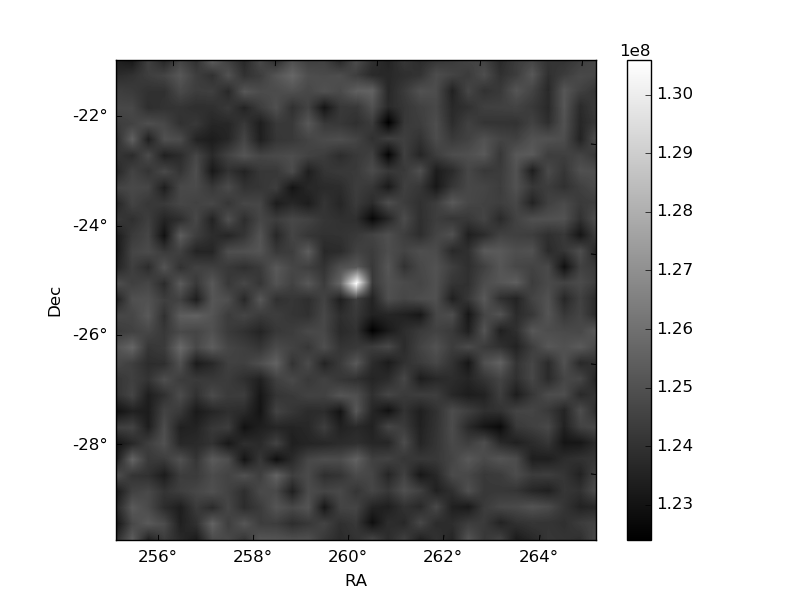 |
| Module-wise count rates for Quadrant D Data is divided into 100 sec bins |
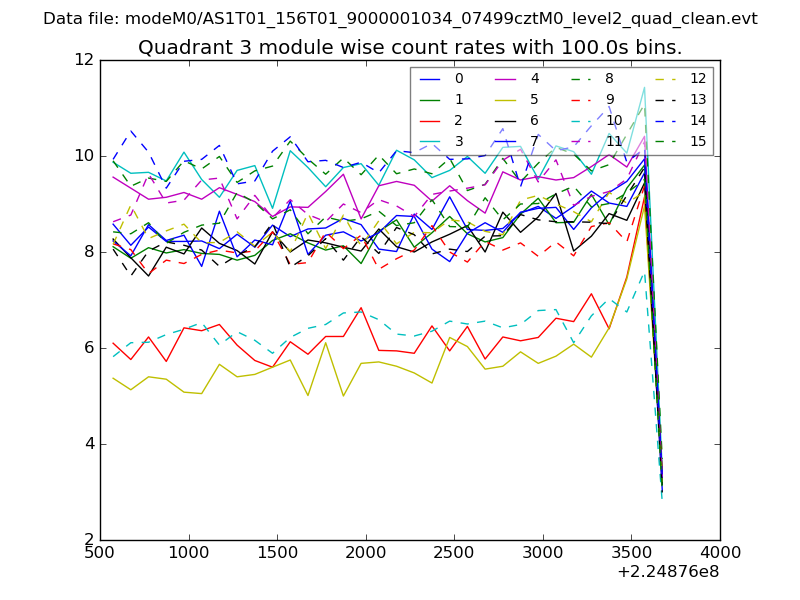 |
 |
| Parameter | Plot |
|---|---|
| CZT HV Monitor | 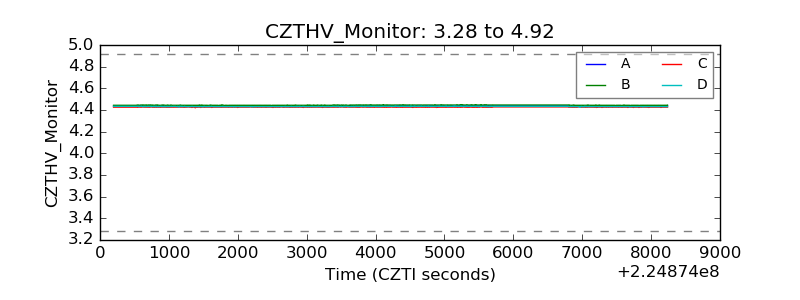 |
| D_VDD | 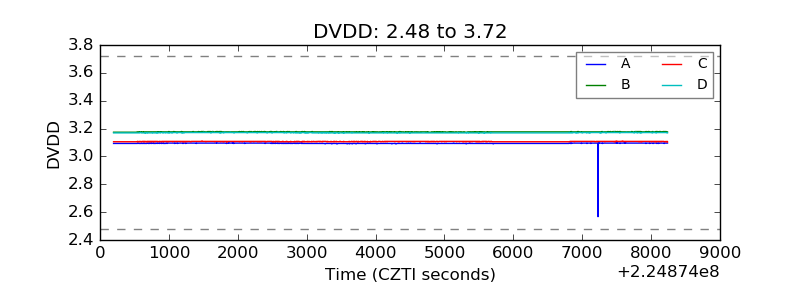 |
| Temperature 1 | 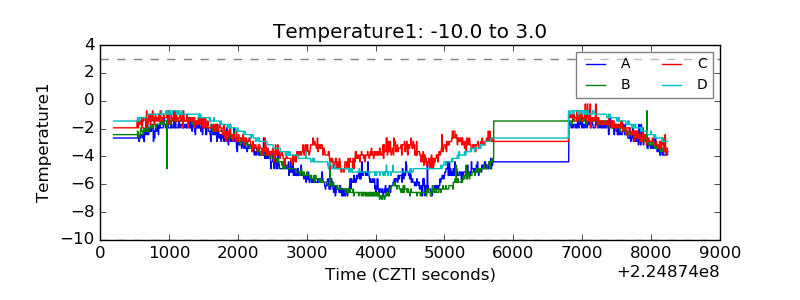 |
| Veto HV Monitor | 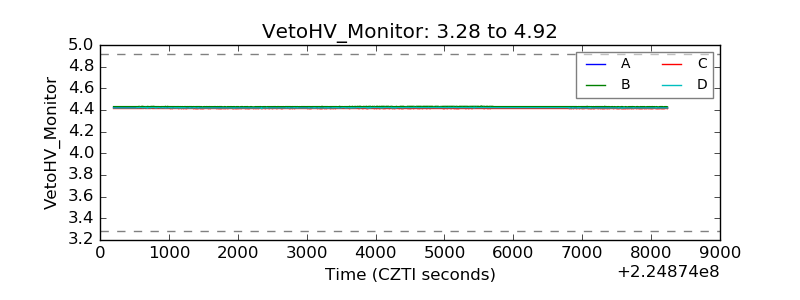 |
| Veto LLD | 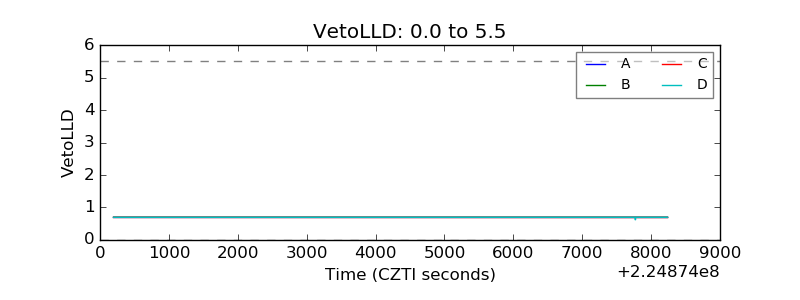 |
| Alpha Counter | 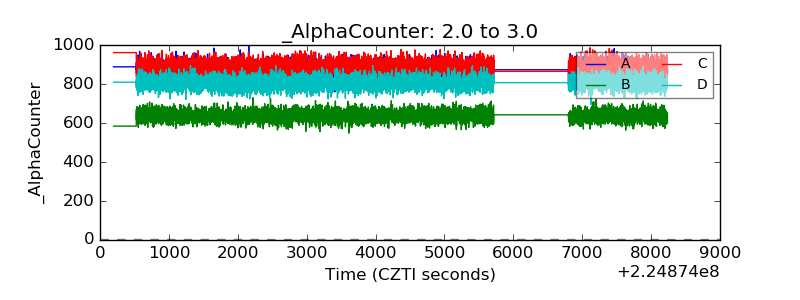 |
| _CPM_Rate | 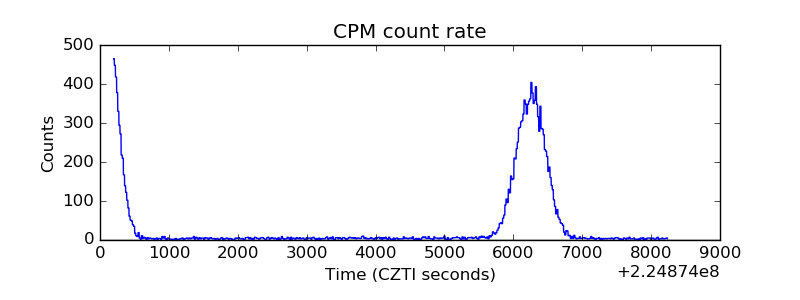 |
| CZT Counter | 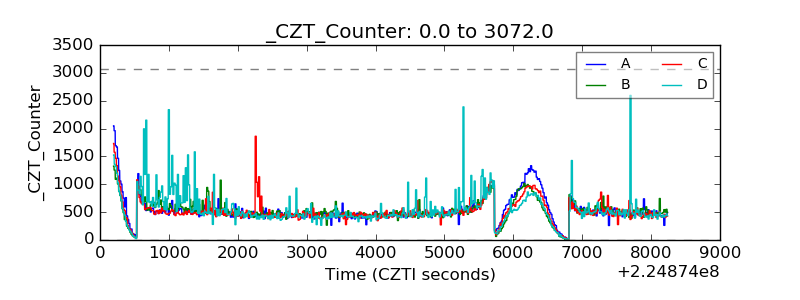 |
| +2.5 Volts monitor |  |
| +5 Volts monitor |  |
| _ROLL_ROT | 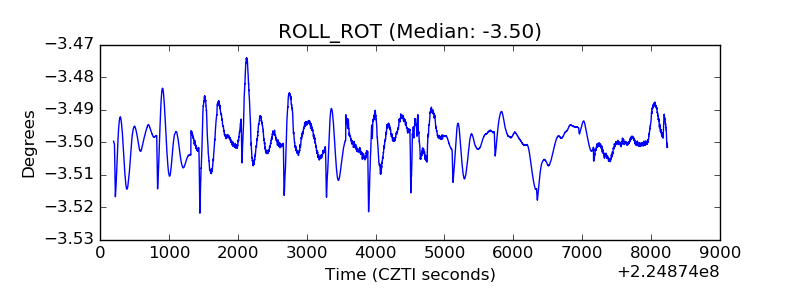 |
| _Roll_DEC | 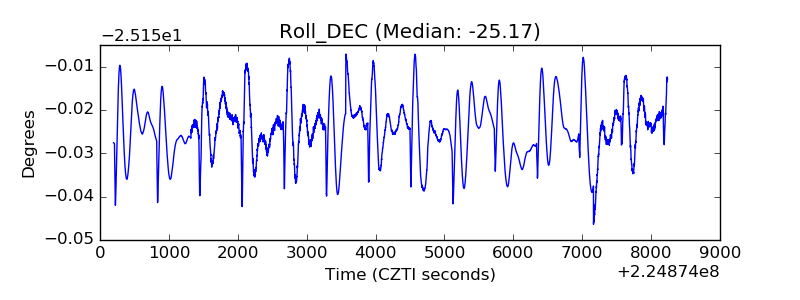 |
| _Roll_RA | 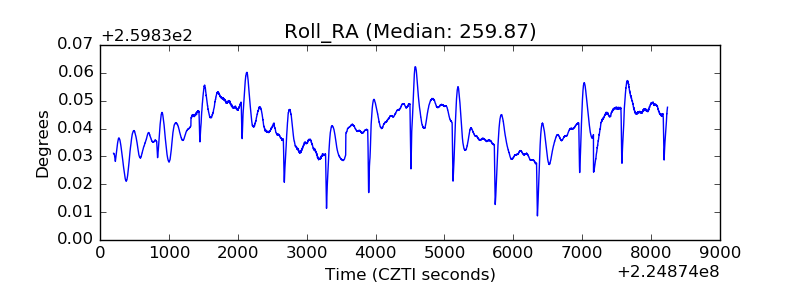 |
| Veto Counter | 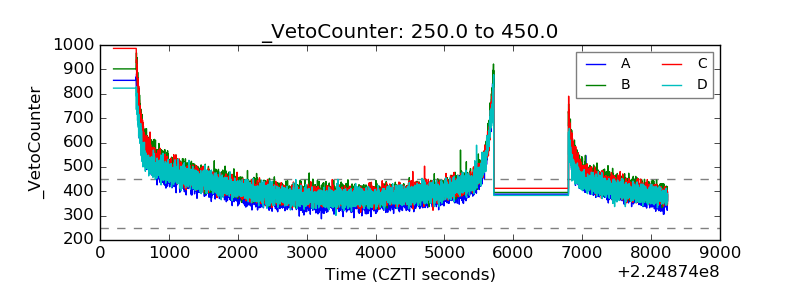 |