| Param | Original file | Final file |
|---|---|---|
| Filename | modeM0/AS1T01_156T01_9000001034_07502cztM0_level2.evt | modeM0/AS1T01_156T01_9000001034_07502cztM0_level2_quad_clean.evt |
| Size (bytes) | 539,550,720 | 98,458,560 |
| Size | 514.6 MB | 93.9 MB |
| Events in quadrant A | 3,754,705 | 613,745 |
| Events in quadrant B | 3,994,030 | 622,545 |
| Events in quadrant C | 3,893,283 | 612,740 |
| Events in quadrant D | 4,161,625 | 583,122 |
| Mode M9 | |||
|---|---|---|---|
| Quadrant | BADHDUFLAG | Total packets | Discarded packets |
| A | 0 | 7 | 0 |
| B | 0 | 7 | 0 |
| C | 0 | 7 | 0 |
| D | 0 | 7 | 0 |
| Mode SS | |||
|---|---|---|---|
| Quadrant | BADHDUFLAG | Total packets | Discarded packets |
| A | 0 | 164 | 0 |
| B | 0 | 164 | 0 |
| C | 0 | 164 | 0 |
| D | 0 | 164 | 0 |
| Mode M0 | |||
|---|---|---|---|
| Quadrant | BADHDUFLAG | Total packets | Discarded packets |
| A | 0 | 16385 | 3 |
| B | 0 | 17038 | 2 |
| C | 0 | 16816 | 2 |
| D | 0 | 17757 | 2 |
| Quadrant | Total seconds | Saturated seconds | Saturation percentage |
|---|---|---|---|
| A | 7906 | 89 | 1.125727% |
| B | 7906 | 127 | 1.606375% |
| C | 7906 | 79 | 0.999241% |
| D | 7906 | 138 | 1.745510% |
Noise dominated data is calculated using 1-second bins in cleaned event files. If a bin has >2000 counts, and if more than 50% of those come from <1% of pixels, then it is considered to be noise-dominated and hence unusable.
| Quadrant | # 1 sec bins | Bins with >0 counts | Bins with >2000 counts | High rate bins dominated by noise | Noise dominated (total time) | Noise dominated (detector-on time) | Marked lightcurve |
|---|---|---|---|---|---|---|---|
| A | 8596 | 7909 | 0 | 0 | 0.00% | 0.00% | 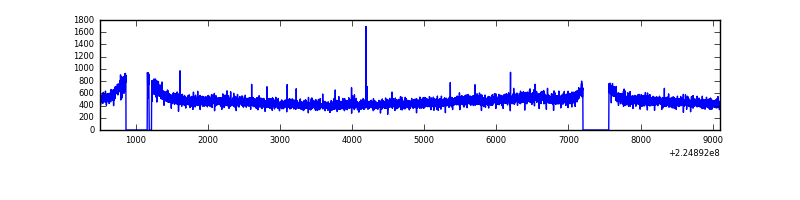 |
| B | 8596 | 7909 | 1 | 1 | 0.01% | 0.01% | 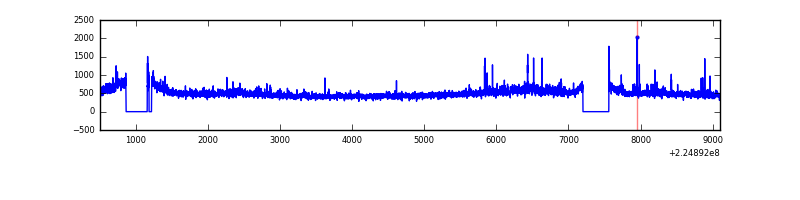 |
| C | 8596 | 7909 | 21 | 21 | 0.24% | 0.27% | 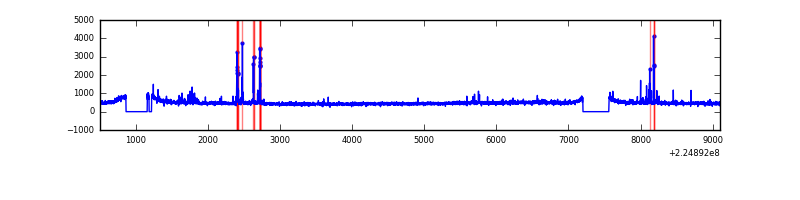 |
| D | 8596 | 7909 | 71 | 71 | 0.83% | 0.90% | 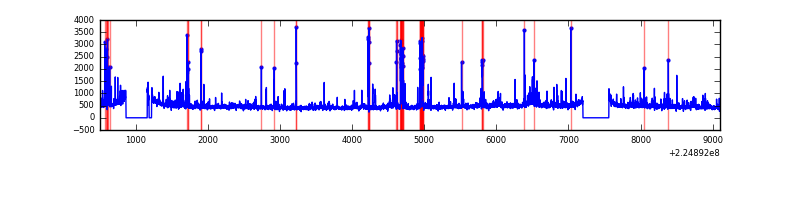 |
Top three noisy pixels from each quadrant. If the there are fewer than three noisy pixels in the level2.evt file, extra rows are filled as -1
| Pixel properties | Quadrant properties | ||||||
|---|---|---|---|---|---|---|---|
| Quadrant | DetID | PixID | Counts | Sigma | Mean | Median | Sigma |
| A | 15 | 239 | 16224 | 76.55 | 968 | 947 | 199.6 |
| A | 0 | 226 | 9304 | 41.88 | 968 | 947 | 199.6 |
| A | 12 | 194 | 8699 | 38.85 | 968 | 947 | 199.6 |
| B | 0 | 214 | 137976 | 731.05 | 978 | 955 | 187.4 |
| B | 0 | 219 | 33146 | 171.75 | 978 | 955 | 187.4 |
| B | 4 | 173 | 18669 | 94.51 | 978 | 955 | 187.4 |
| C | 1 | 16 | 124326 | 559.47 | 941 | 948 | 220.5 |
| C | 8 | 229 | 86723 | 388.95 | 941 | 948 | 220.5 |
| C | 13 | 61 | 7376 | 29.15 | 941 | 948 | 220.5 |
| D | 2 | 14 | 209754 | 902.4 | 936 | 906 | 231.4 |
| D | 2 | 136 | 147926 | 635.25 | 936 | 906 | 231.4 |
| D | 14 | 34 | 120647 | 517.38 | 936 | 906 | 231.4 |
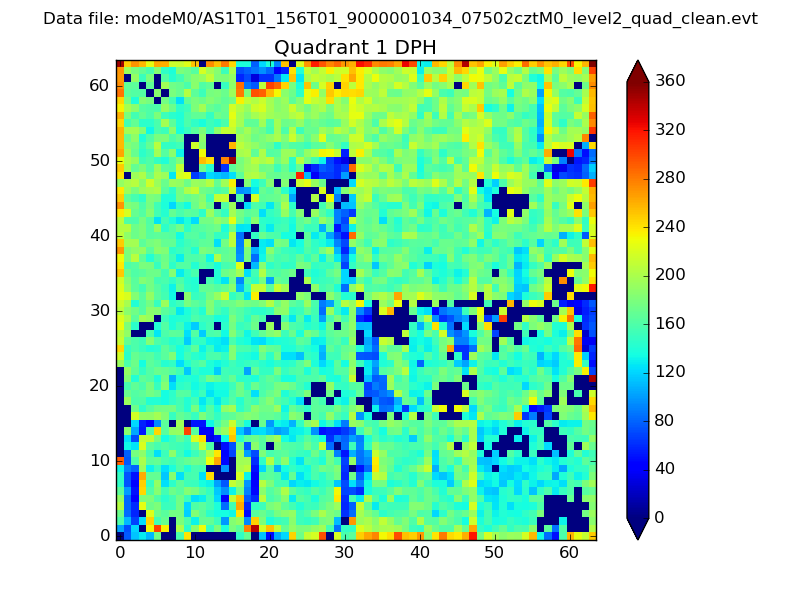
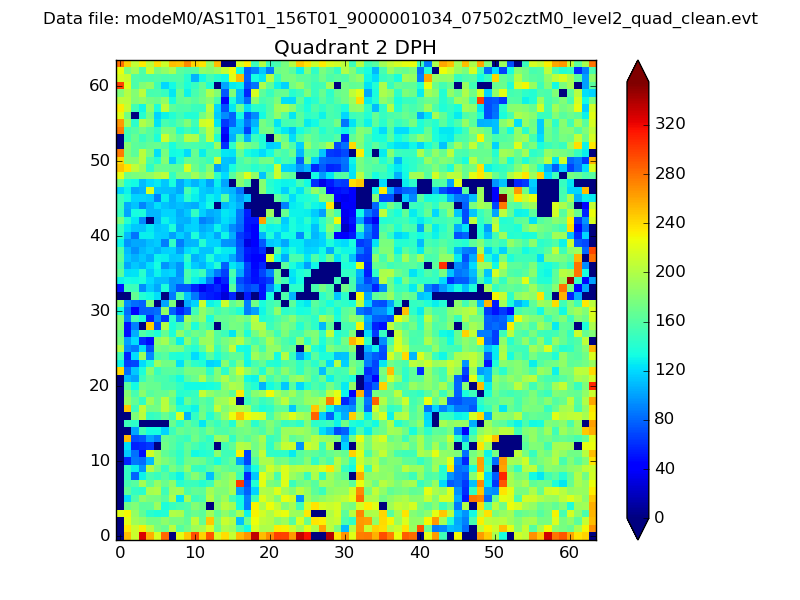
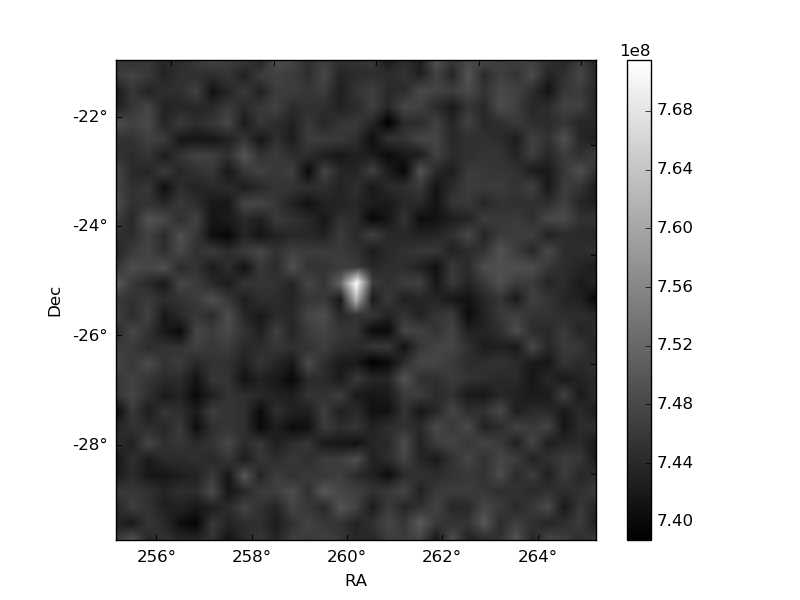
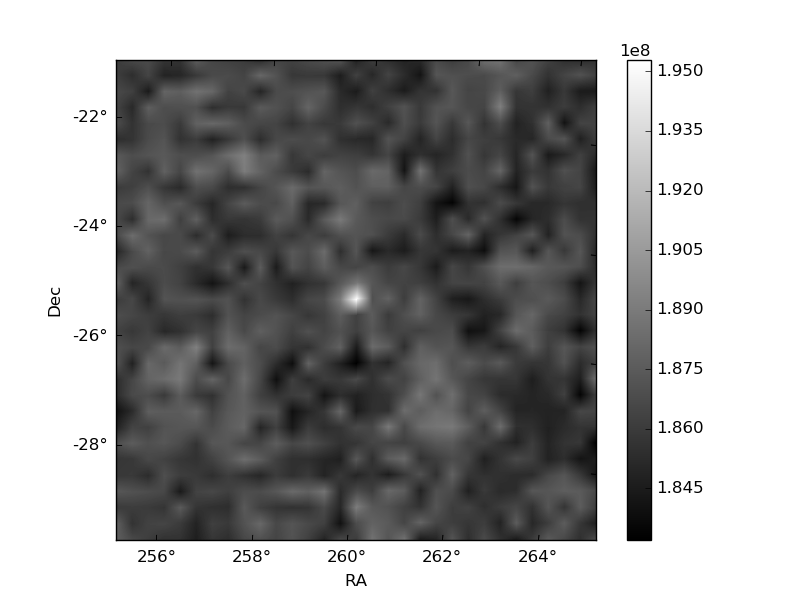
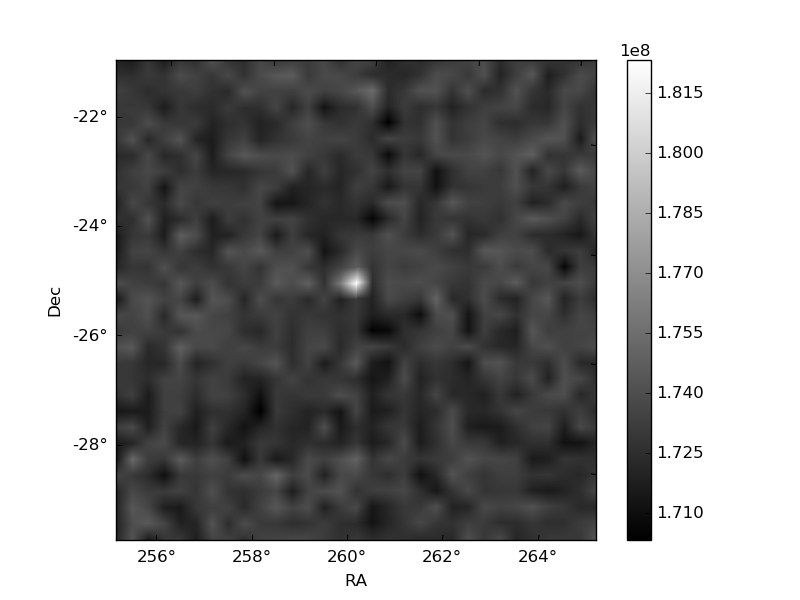
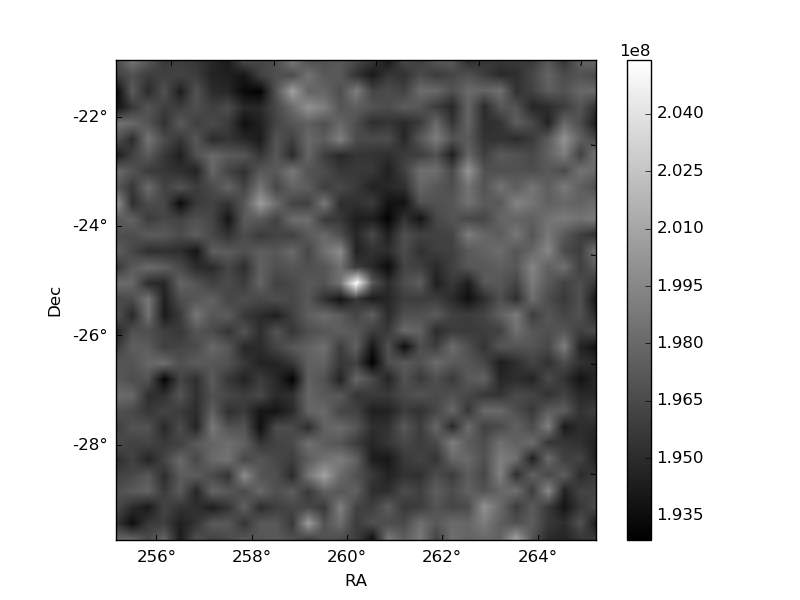
Histogram calculated using DETX and DETY for each event in the final _common_clean file
| Quadrant A |  |
 |
Quadrant B |
|---|---|---|---|
| Quadrant D | 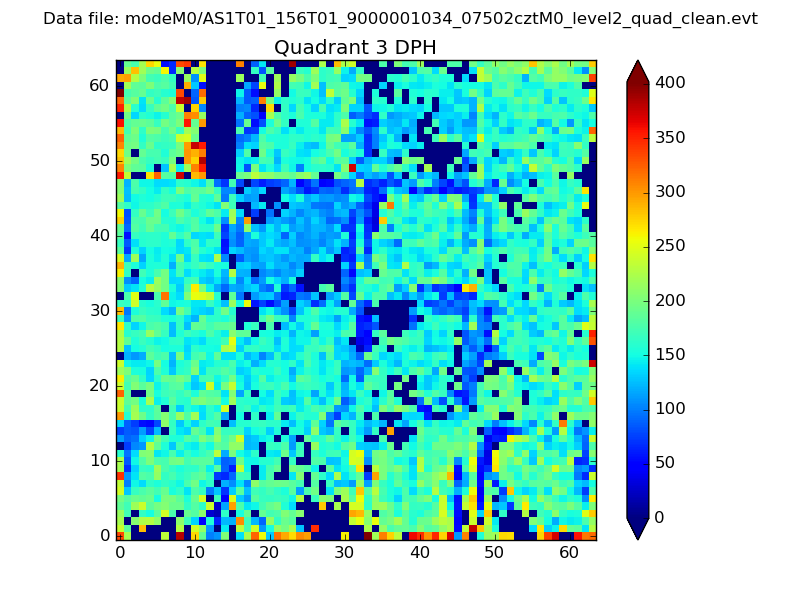 |
 |
Quadrant C |
| Plot type | Count rate plots | Images |
|---|---|---|
| Comparison with Poisson distribution Blue bars denote a histogram of data divided into 1 sec bins. Red curve is a Poisson curve with rate = median count rate of data. |
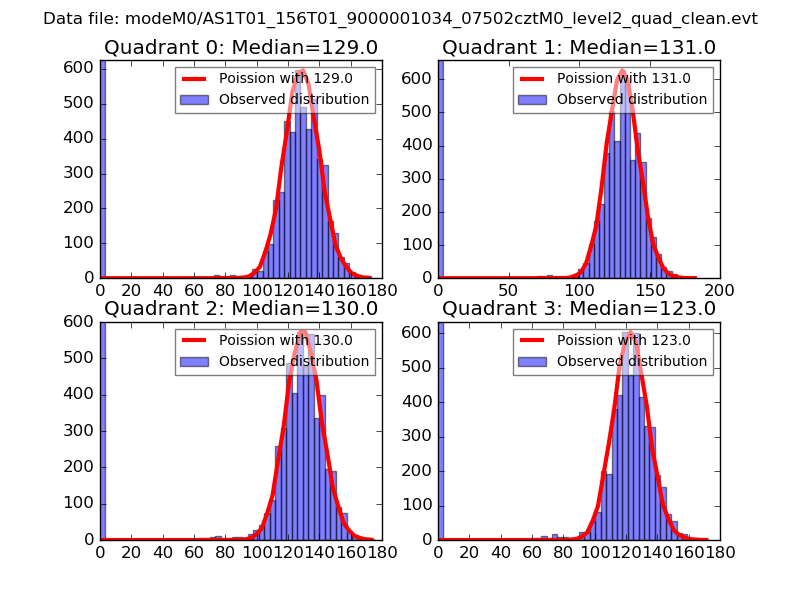 |
 |
| Quadrant-wise count rates Data is divided into 100 sec bins |
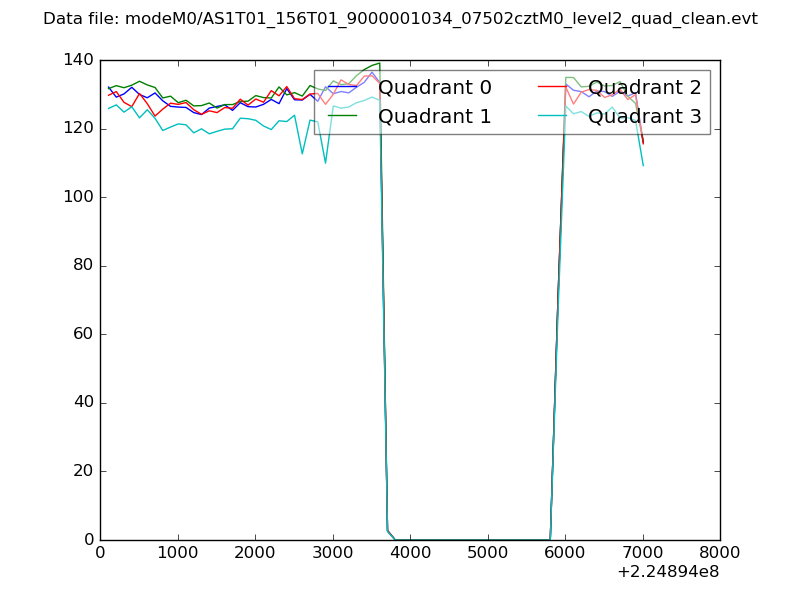 |
|
| Module-wise count rates for Quadrant A Data is divided into 100 sec bins |
 |
 |
| Module-wise count rates for Quadrant B Data is divided into 100 sec bins |
 |
 |
| Module-wise count rates for Quadrant C Data is divided into 100 sec bins |
 |
 |
| Module-wise count rates for Quadrant D Data is divided into 100 sec bins |
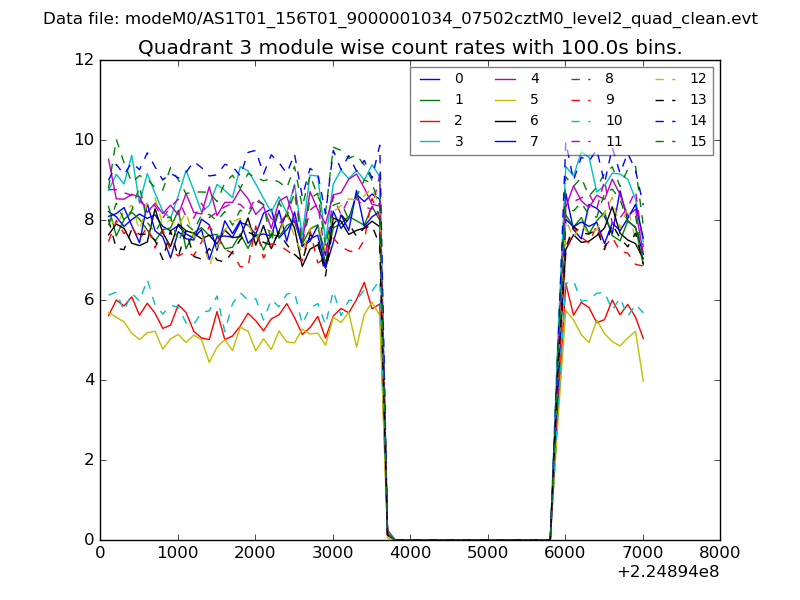 |
 |
| Parameter | Plot |
|---|---|
| CZT HV Monitor | 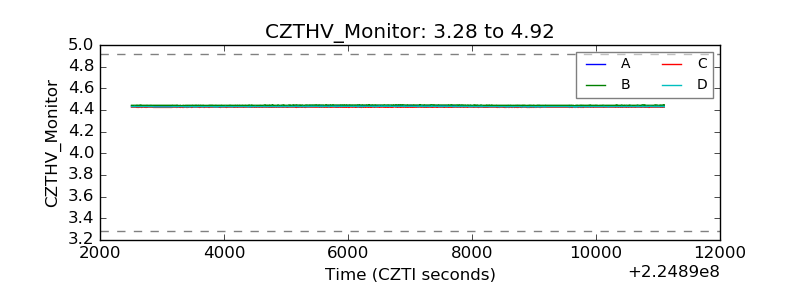 |
| D_VDD | 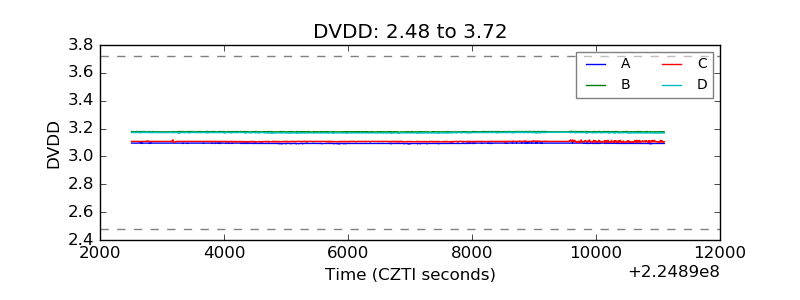 |
| Temperature 1 | 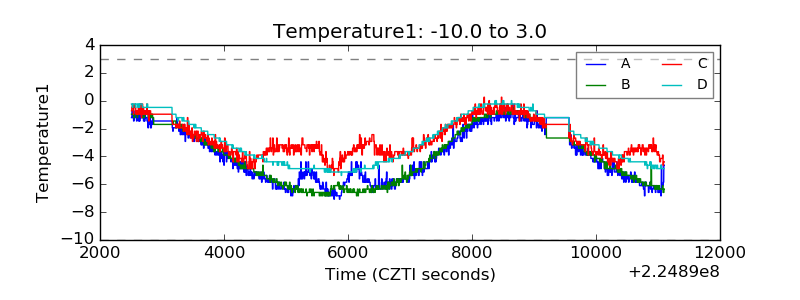 |
| Veto HV Monitor | 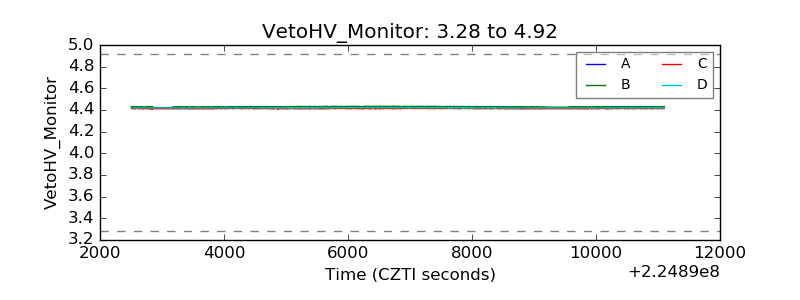 |
| Veto LLD | 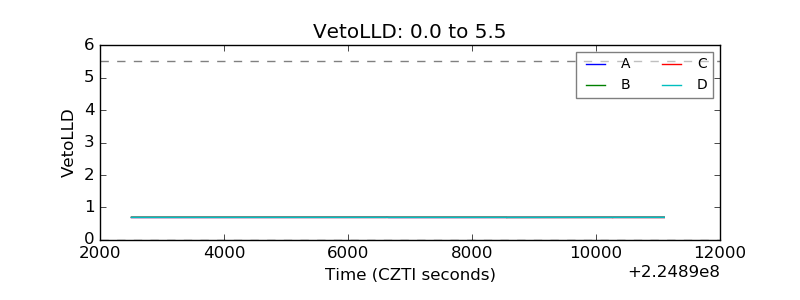 |
| Alpha Counter | 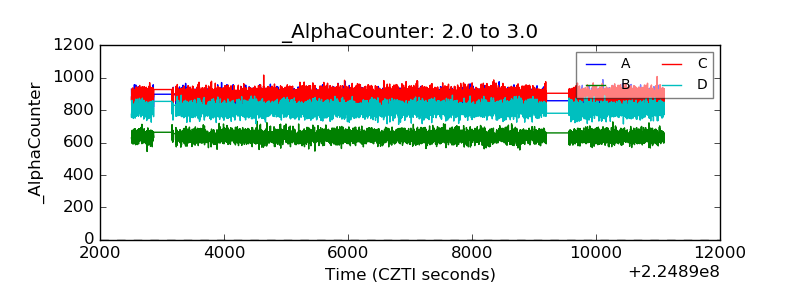 |
| _CPM_Rate | 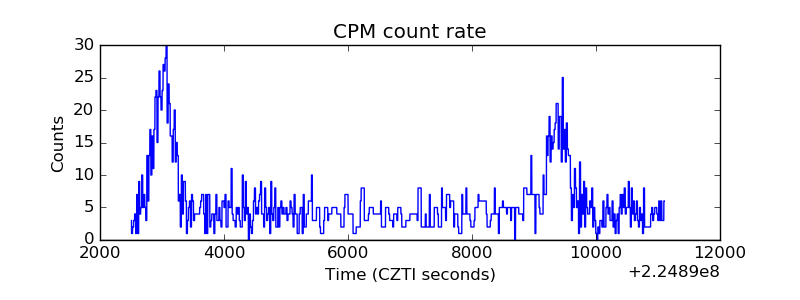 |
| CZT Counter | 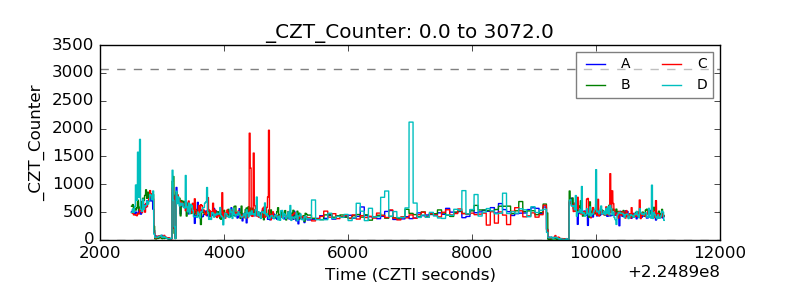 |
| +2.5 Volts monitor |  |
| +5 Volts monitor | 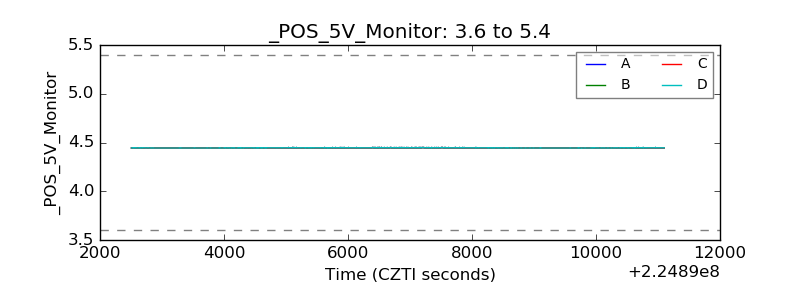 |
| _ROLL_ROT | 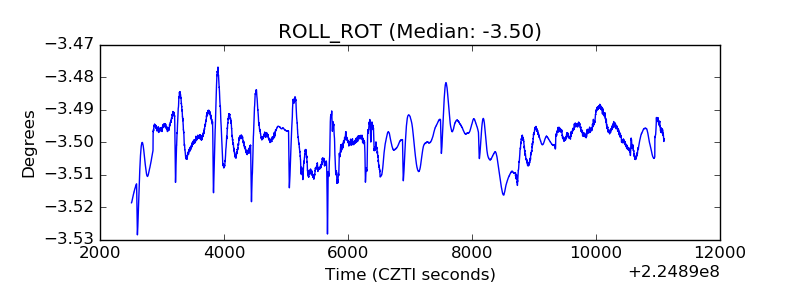 |
| _Roll_DEC | 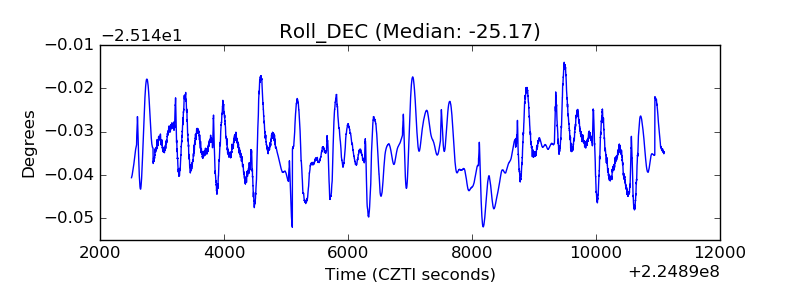 |
| _Roll_RA | 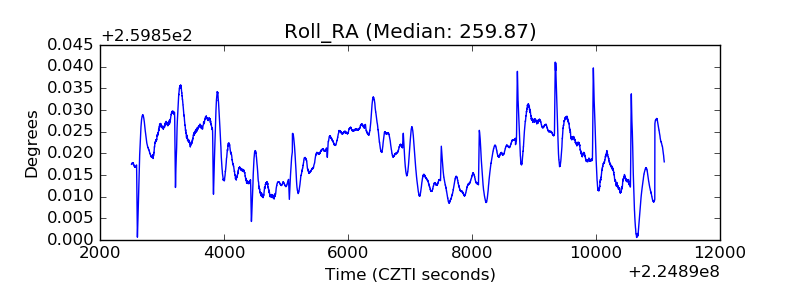 |
| Veto Counter | 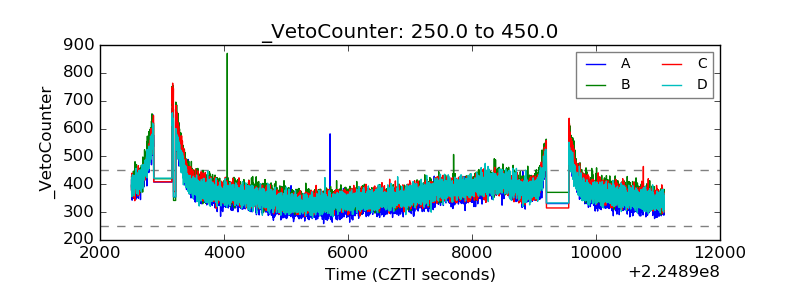 |