| Param | Original file | Final file |
|---|---|---|
| Filename | modeM0/AS1T01_156T01_9000001034_07503cztM0_level2.evt | modeM0/AS1T01_156T01_9000001034_07503cztM0_level2_quad_clean.evt |
| Size (bytes) | 491,201,280 | 94,979,520 |
| Size | 468.4 MB | 90.6 MB |
| Events in quadrant A | 3,413,335 | 597,143 |
| Events in quadrant B | 3,685,886 | 606,761 |
| Events in quadrant C | 3,514,476 | 600,378 |
| Events in quadrant D | 3,770,427 | 567,866 |
| Mode M9 | |||
|---|---|---|---|
| Quadrant | BADHDUFLAG | Total packets | Discarded packets |
| A | 0 | 7 | 0 |
| B | 0 | 7 | 0 |
| C | 0 | 7 | 0 |
| D | 0 | 7 | 0 |
| Mode SS | |||
|---|---|---|---|
| Quadrant | BADHDUFLAG | Total packets | Discarded packets |
| A | 0 | 150 | 0 |
| B | 0 | 150 | 0 |
| C | 0 | 150 | 0 |
| D | 0 | 150 | 0 |
| Mode M0 | |||
|---|---|---|---|
| Quadrant | BADHDUFLAG | Total packets | Discarded packets |
| A | 0 | 14944 | 3 |
| B | 0 | 15680 | 2 |
| C | 0 | 15199 | 2 |
| D | 0 | 16071 | 2 |
| Quadrant | Total seconds | Saturated seconds | Saturation percentage |
|---|---|---|---|
| A | 7237 | 28 | 0.386901% |
| B | 7237 | 64 | 0.884344% |
| C | 7237 | 39 | 0.538897% |
| D | 7237 | 91 | 1.257427% |
Noise dominated data is calculated using 1-second bins in cleaned event files. If a bin has >2000 counts, and if more than 50% of those come from <1% of pixels, then it is considered to be noise-dominated and hence unusable.
| Quadrant | # 1 sec bins | Bins with >0 counts | Bins with >2000 counts | High rate bins dominated by noise | Noise dominated (total time) | Noise dominated (detector-on time) | Marked lightcurve |
|---|---|---|---|---|---|---|---|
| A | 7982 | 7239 | 1 | 1 | 0.01% | 0.01% | 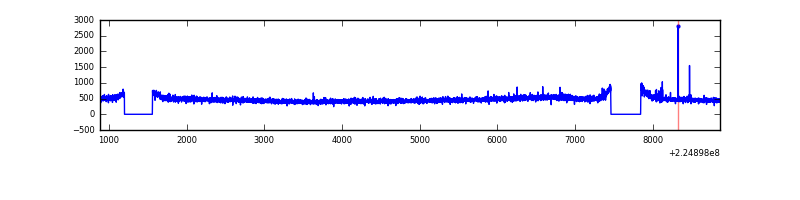 |
| B | 7982 | 7239 | 4 | 4 | 0.05% | 0.06% | 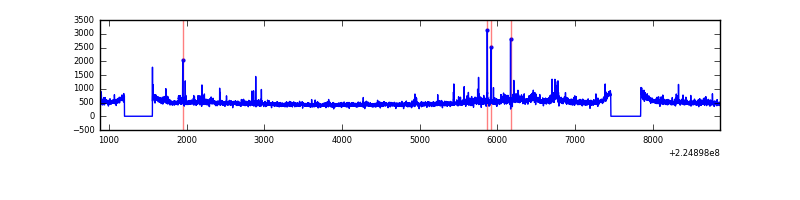 |
| C | 7982 | 7239 | 8 | 8 | 0.10% | 0.11% | 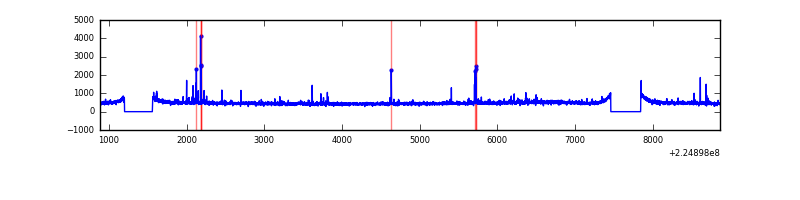 |
| D | 7982 | 7239 | 58 | 58 | 0.73% | 0.80% | 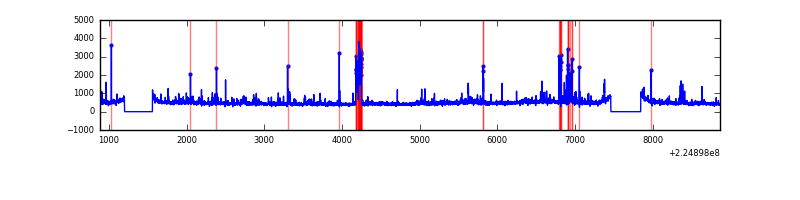 |
Top three noisy pixels from each quadrant. If the there are fewer than three noisy pixels in the level2.evt file, extra rows are filled as -1
| Pixel properties | Quadrant properties | ||||||
|---|---|---|---|---|---|---|---|
| Quadrant | DetID | PixID | Counts | Sigma | Mean | Median | Sigma |
| A | 15 | 239 | 13921 | 72.07 | 881 | 862 | 181.2 |
| A | 3 | 1 | 9529 | 47.83 | 881 | 862 | 181.2 |
| A | 0 | 226 | 8360 | 41.38 | 881 | 862 | 181.2 |
| B | 0 | 214 | 105862 | 609.77 | 892 | 870 | 172.2 |
| B | 0 | 219 | 51542 | 294.29 | 892 | 870 | 172.2 |
| B | 0 | 229 | 37440 | 212.39 | 892 | 870 | 172.2 |
| C | 8 | 229 | 66378 | 325.41 | 860 | 867 | 201.3 |
| C | 1 | 16 | 55990 | 273.81 | 860 | 867 | 201.3 |
| C | 8 | 128 | 12246 | 56.52 | 860 | 867 | 201.3 |
| D | 2 | 14 | 168334 | 783.29 | 855 | 826 | 213.9 |
| D | 2 | 136 | 106541 | 494.34 | 855 | 826 | 213.9 |
| D | 2 | 152 | 85669 | 396.74 | 855 | 826 | 213.9 |
Histogram calculated using DETX and DETY for each event in the final _common_clean file
| Quadrant A | 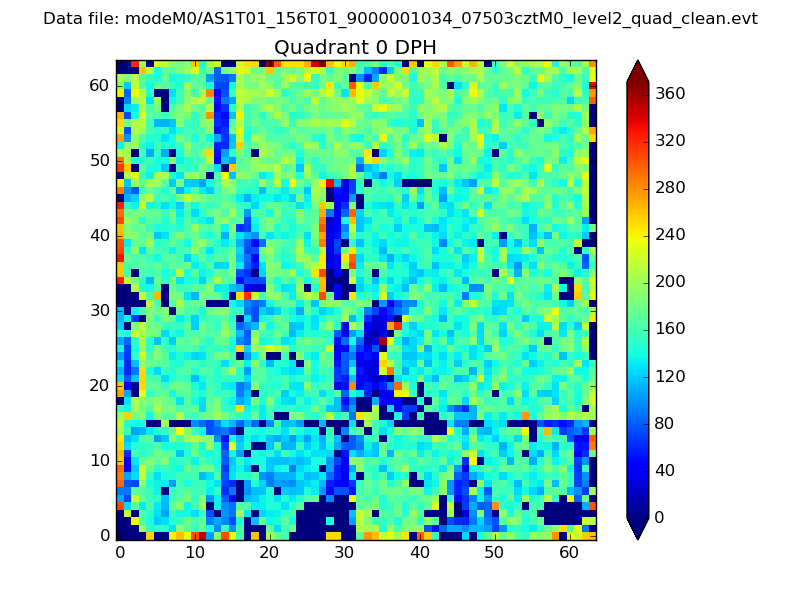 |
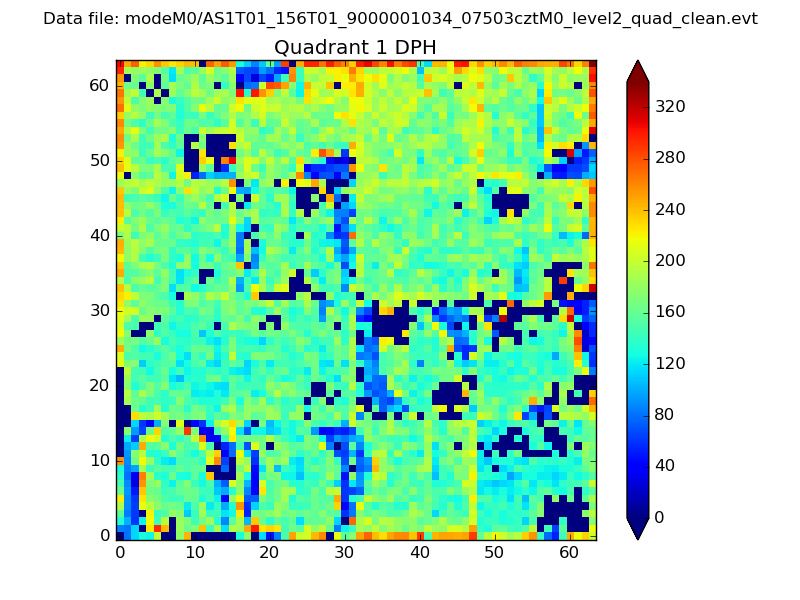 |
Quadrant B |
|---|---|---|---|
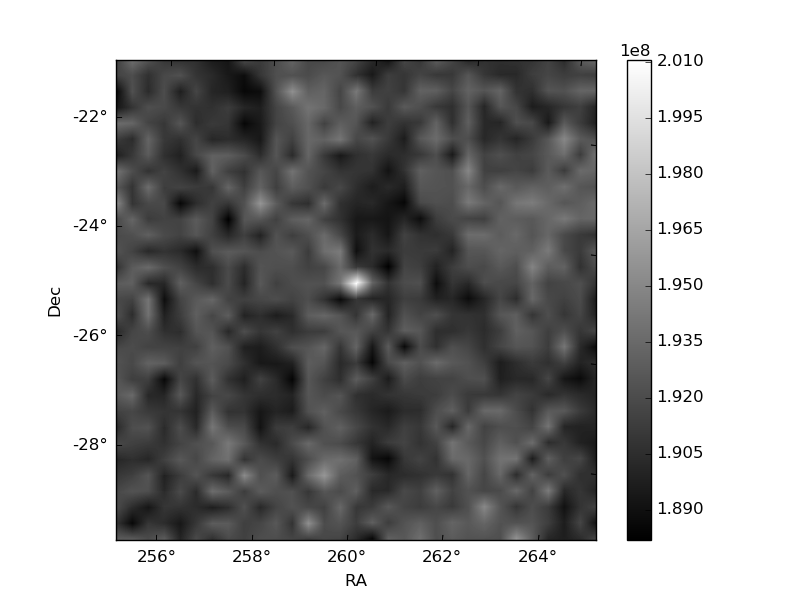
| Quadrant D | 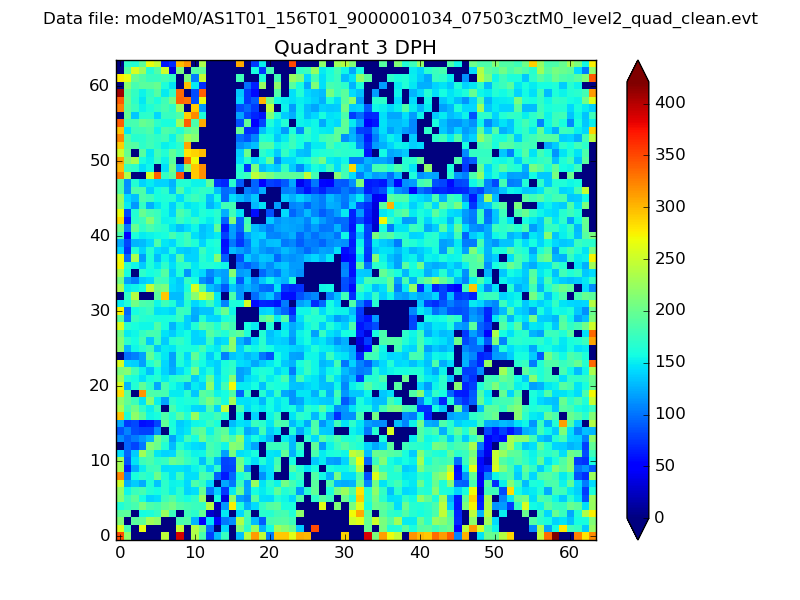 |
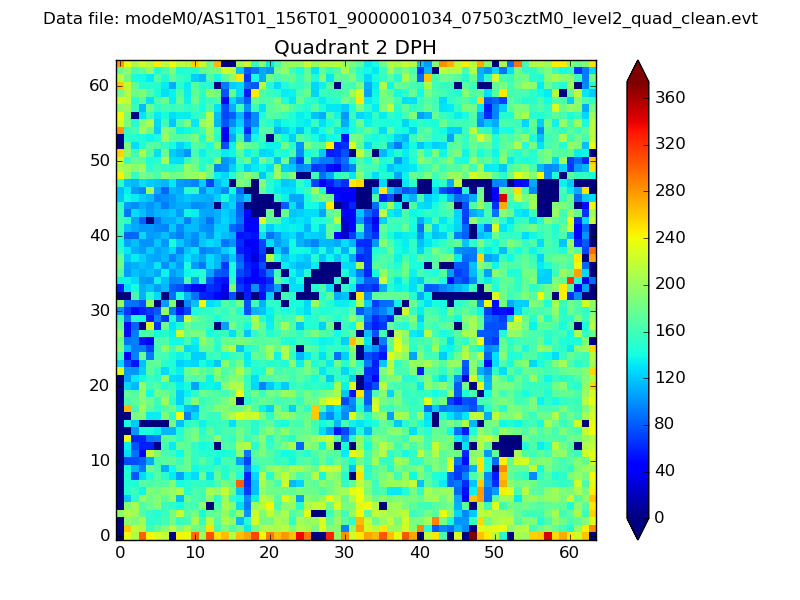 |
Quadrant C |
| Plot type | Count rate plots | Images |
|---|---|---|
| Comparison with Poisson distribution Blue bars denote a histogram of data divided into 1 sec bins. Red curve is a Poisson curve with rate = median count rate of data. |
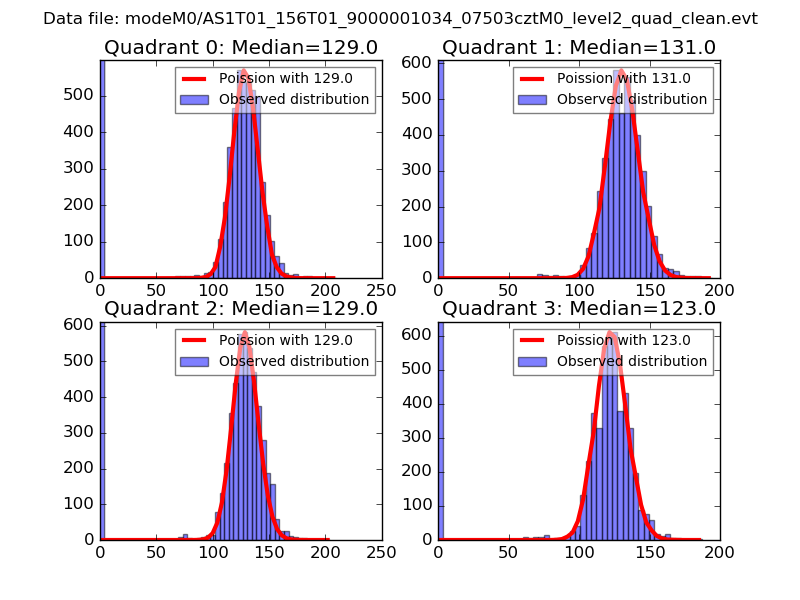 |
 |
| Quadrant-wise count rates Data is divided into 100 sec bins |
 |
|
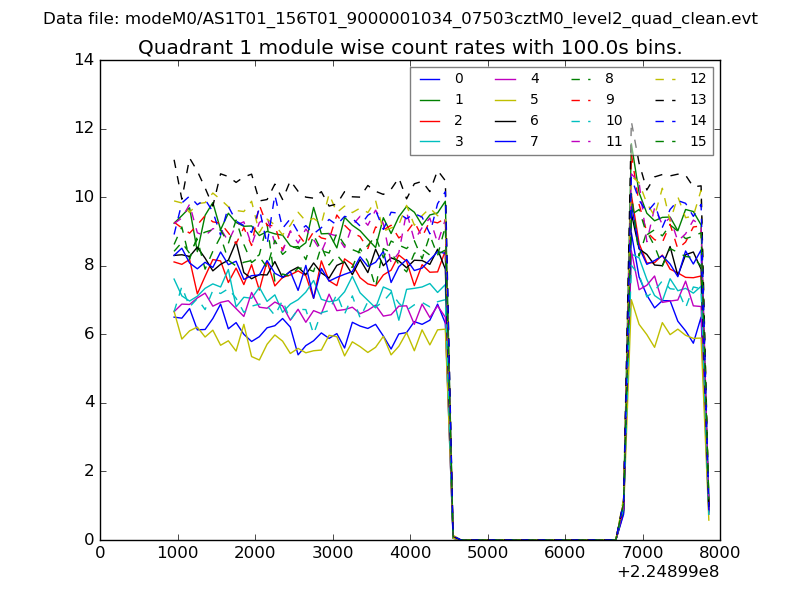
| Module-wise count rates for Quadrant A Data is divided into 100 sec bins |
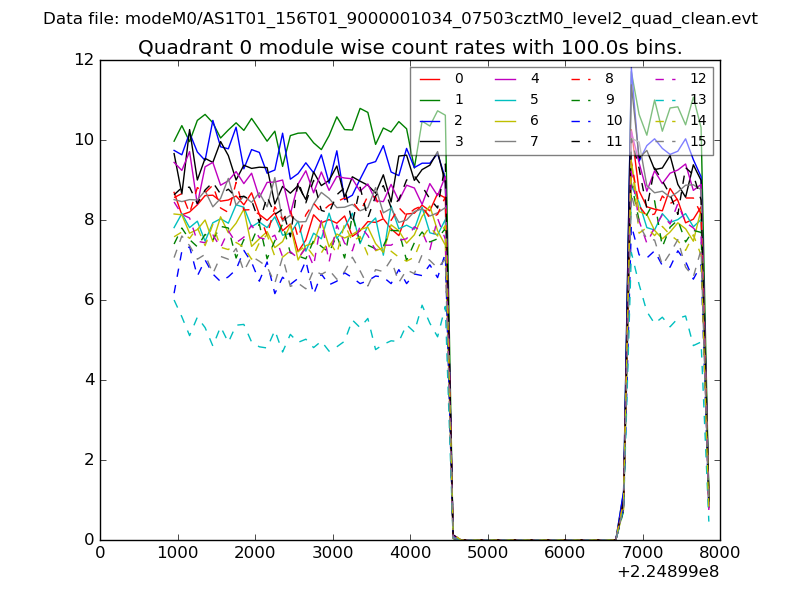 |
 |
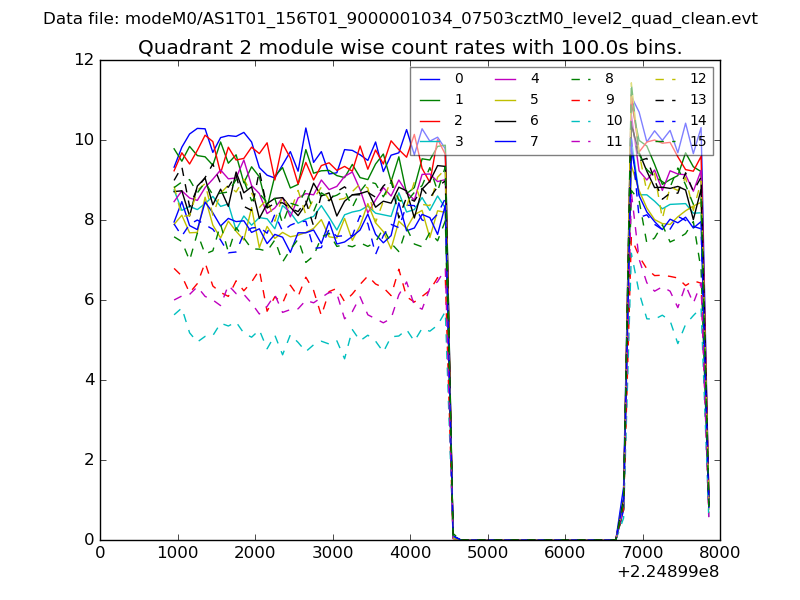
| Module-wise count rates for Quadrant B Data is divided into 100 sec bins |
 |
 |
| Module-wise count rates for Quadrant C Data is divided into 100 sec bins |
 |
 |
| Module-wise count rates for Quadrant D Data is divided into 100 sec bins |
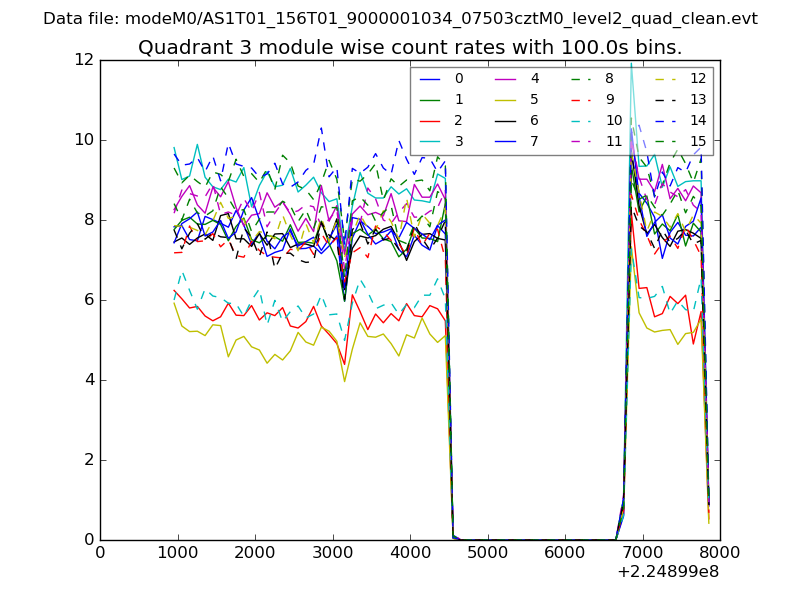 |
 |
| Parameter | Plot |
|---|---|
| CZT HV Monitor | 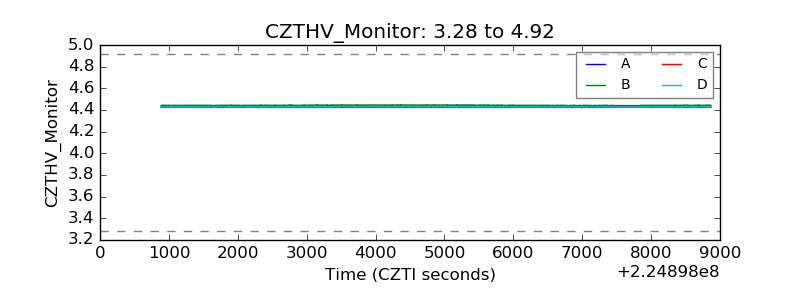 |
| D_VDD | 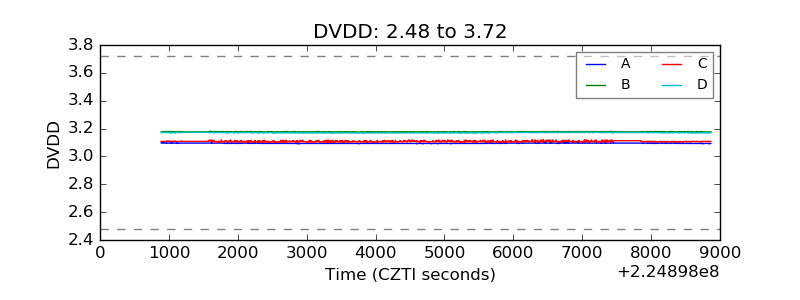 |
| Temperature 1 |  |
| Veto HV Monitor | 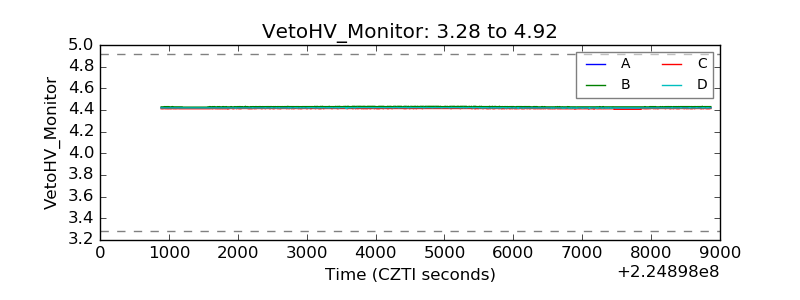 |
| Veto LLD | 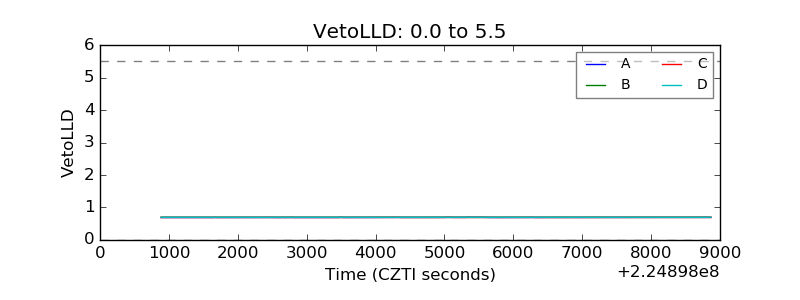 |
| Alpha Counter | 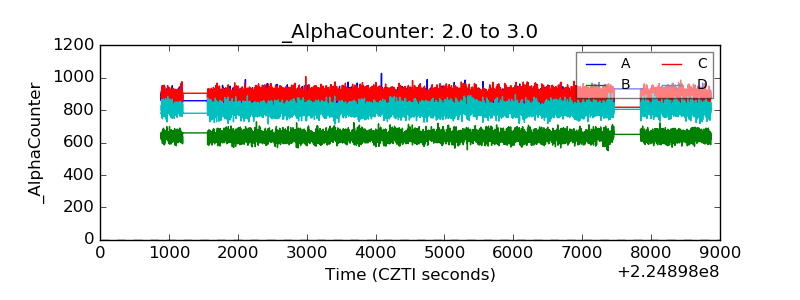 |
| _CPM_Rate | 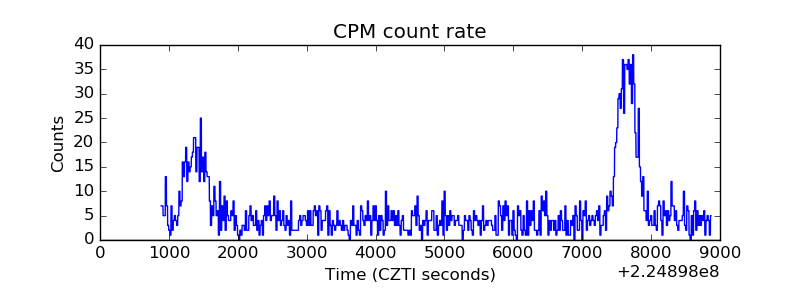 |
| CZT Counter | 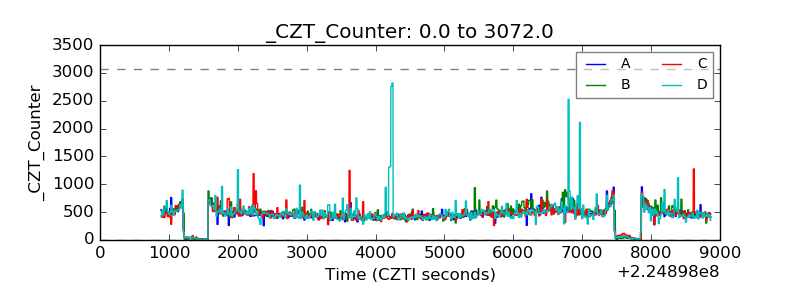 |
| +2.5 Volts monitor |  |
| +5 Volts monitor |  |
| _ROLL_ROT | 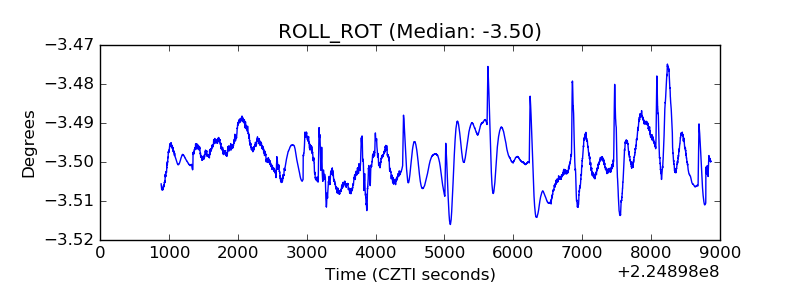 |
| _Roll_DEC | 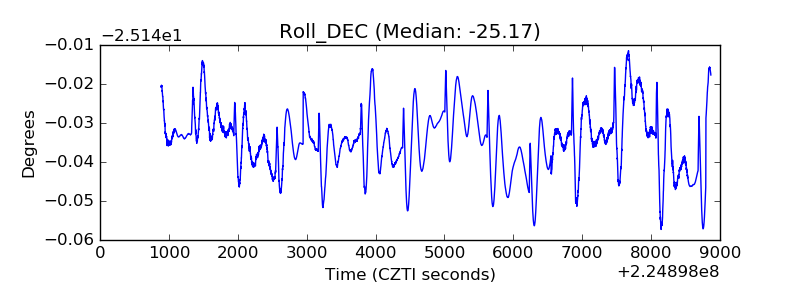 |
| _Roll_RA | 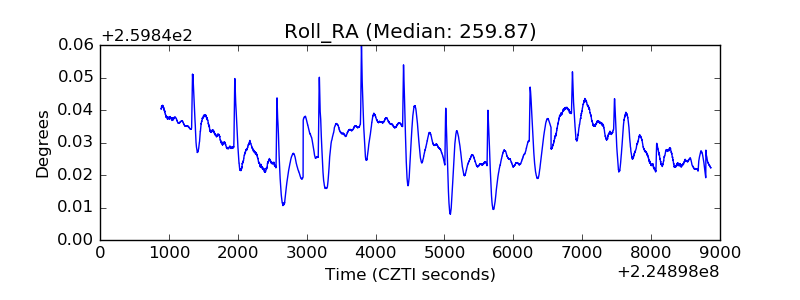 |
| Veto Counter | 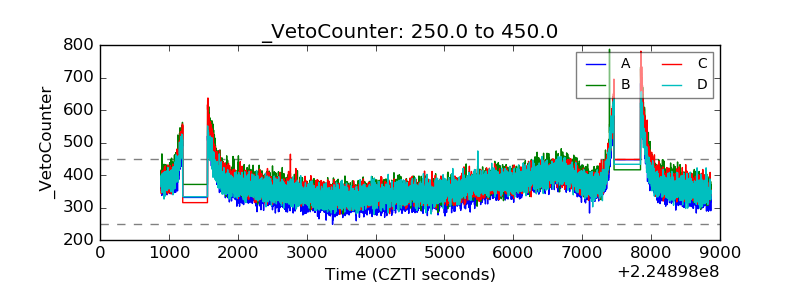 |