| Param | Original file | Final file |
|---|---|---|
| Filename | modeM0/AS1T01_156T01_9000001034_07507cztM0_level2.evt | modeM0/AS1T01_156T01_9000001034_07507cztM0_level2_quad_clean.evt |
| Size (bytes) | 740,583,360 | 140,552,640 |
| Size | 706.3 MB | 134.0 MB |
| Events in quadrant A | 5,166,350 | 871,682 |
| Events in quadrant B | 5,692,504 | 885,209 |
| Events in quadrant C | 5,277,872 | 882,897 |
| Events in quadrant D | 5,527,933 | 836,831 |
| Mode M9 | |||
|---|---|---|---|
| Quadrant | BADHDUFLAG | Total packets | Discarded packets |
| A | 0 | 8 | 0 |
| B | 0 | 8 | 0 |
| C | 0 | 8 | 0 |
| D | 0 | 8 | 0 |
| Mode SS | |||
|---|---|---|---|
| Quadrant | BADHDUFLAG | Total packets | Discarded packets |
| A | 0 | 230 | 0 |
| B | 0 | 230 | 0 |
| C | 0 | 230 | 0 |
| D | 0 | 230 | 0 |
| Mode M0 | |||
|---|---|---|---|
| Quadrant | BADHDUFLAG | Total packets | Discarded packets |
| A | 0 | 22955 | 1 |
| B | 0 | 24291 | 1 |
| C | 0 | 23221 | 1 |
| D | 0 | 24103 | 1 |
| Quadrant | Total seconds | Saturated seconds | Saturation percentage |
|---|---|---|---|
| A | 11271 | 54 | 0.479106% |
| B | 11271 | 74 | 0.656552% |
| C | 11271 | 50 | 0.443616% |
| D | 11271 | 73 | 0.647680% |
Noise dominated data is calculated using 1-second bins in cleaned event files. If a bin has >2000 counts, and if more than 50% of those come from <1% of pixels, then it is considered to be noise-dominated and hence unusable.
| Quadrant | # 1 sec bins | Bins with >0 counts | Bins with >2000 counts | High rate bins dominated by noise | Noise dominated (total time) | Noise dominated (detector-on time) | Marked lightcurve |
|---|---|---|---|---|---|---|---|
| A | 11861 | 11272 | 2 | 2 | 0.02% | 0.02% | 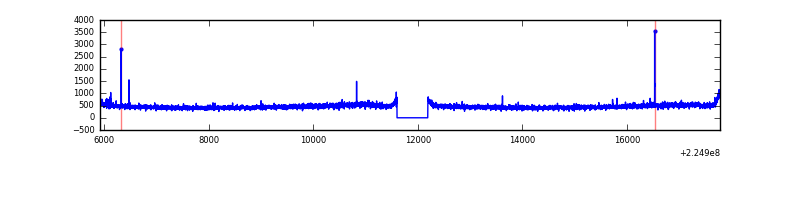 |
| B | 11861 | 11272 | 5 | 5 | 0.04% | 0.04% | 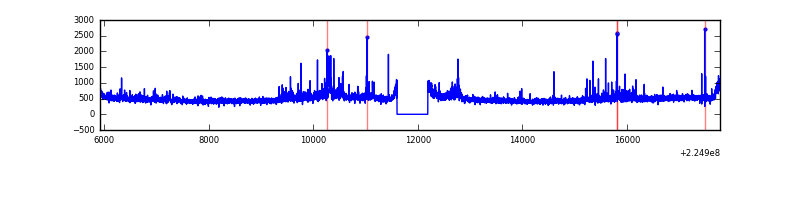 |
| C | 11861 | 11272 | 3 | 3 | 0.03% | 0.03% | 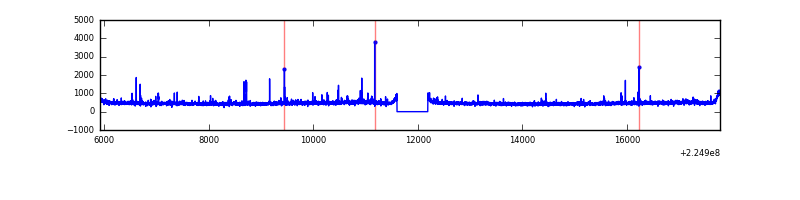 |
| D | 11861 | 11272 | 31 | 31 | 0.26% | 0.28% | 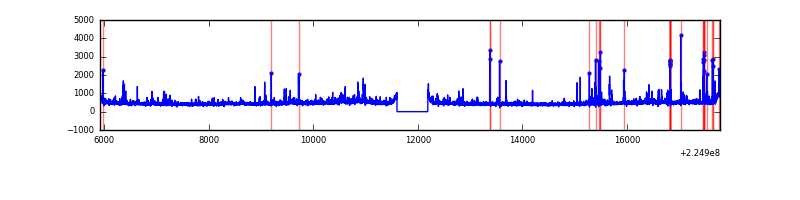 |
Top three noisy pixels from each quadrant. If the there are fewer than three noisy pixels in the level2.evt file, extra rows are filled as -1
| Pixel properties | Quadrant properties | ||||||
|---|---|---|---|---|---|---|---|
| Quadrant | DetID | PixID | Counts | Sigma | Mean | Median | Sigma |
| A | 0 | 226 | 12699 | 41.9 | 1335 | 1307 | 271.9 |
| A | 12 | 194 | 11777 | 38.51 | 1335 | 1307 | 271.9 |
| A | 15 | 239 | 10468 | 33.7 | 1335 | 1307 | 271.9 |
| B | 0 | 214 | 205928 | 794.52 | 1351 | 1321 | 257.5 |
| B | 0 | 219 | 148894 | 573.05 | 1351 | 1321 | 257.5 |
| B | 0 | 229 | 64808 | 246.53 | 1351 | 1321 | 257.5 |
| C | 1 | 16 | 60455 | 194.33 | 1307 | 1316 | 304.3 |
| C | 8 | 229 | 55765 | 178.92 | 1307 | 1316 | 304.3 |
| C | 9 | 68 | 53267 | 170.71 | 1307 | 1316 | 304.3 |
| D | 2 | 136 | 182493 | 560.55 | 1305 | 1266 | 323.3 |
| D | 2 | 152 | 117937 | 360.87 | 1305 | 1266 | 323.3 |
| D | 5 | 233 | 93543 | 285.42 | 1305 | 1266 | 323.3 |
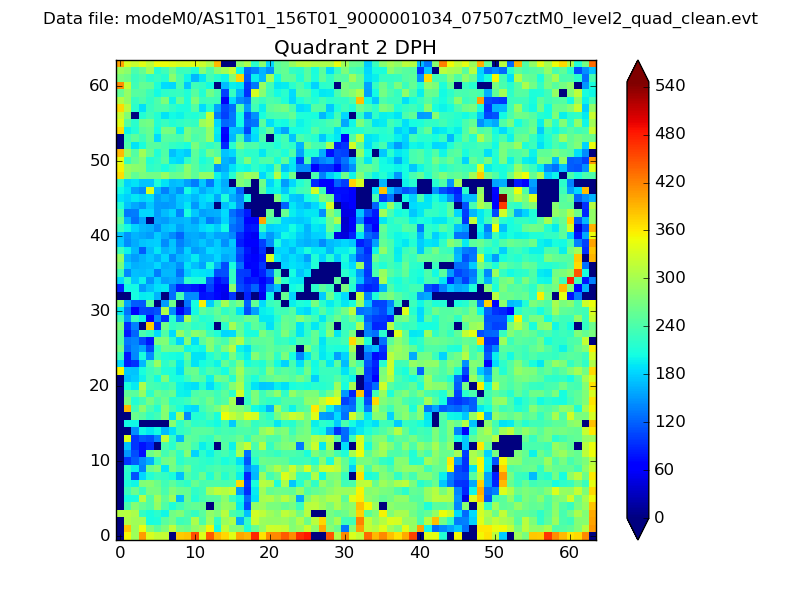
Histogram calculated using DETX and DETY for each event in the final _common_clean file
| Quadrant A | 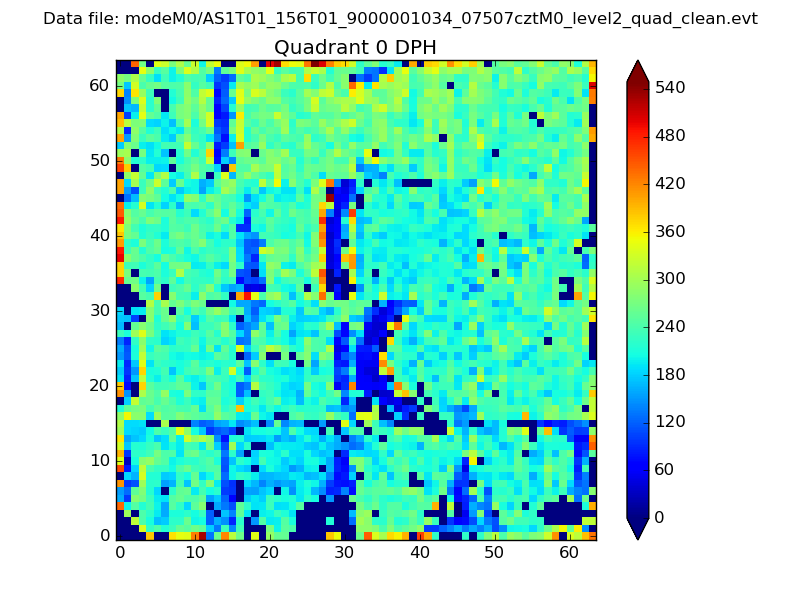 |
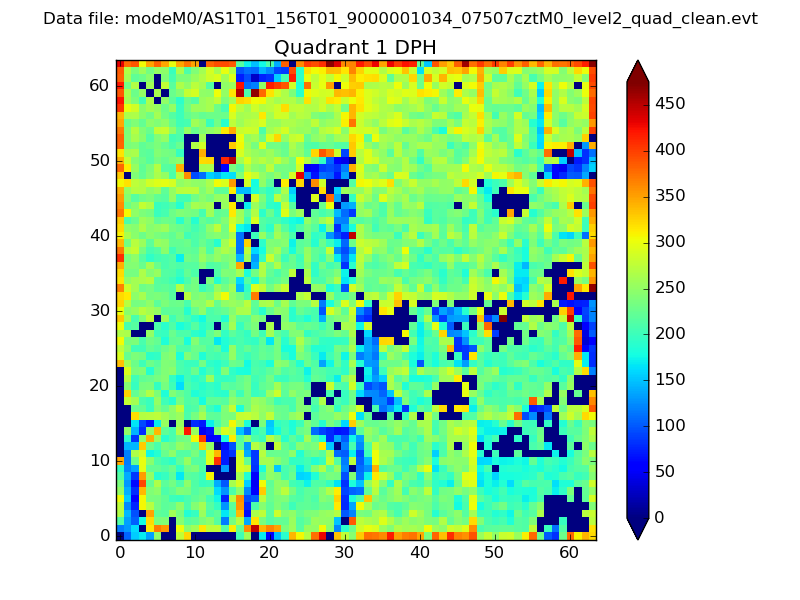 |
Quadrant B |
|---|---|---|---|
| Quadrant D | 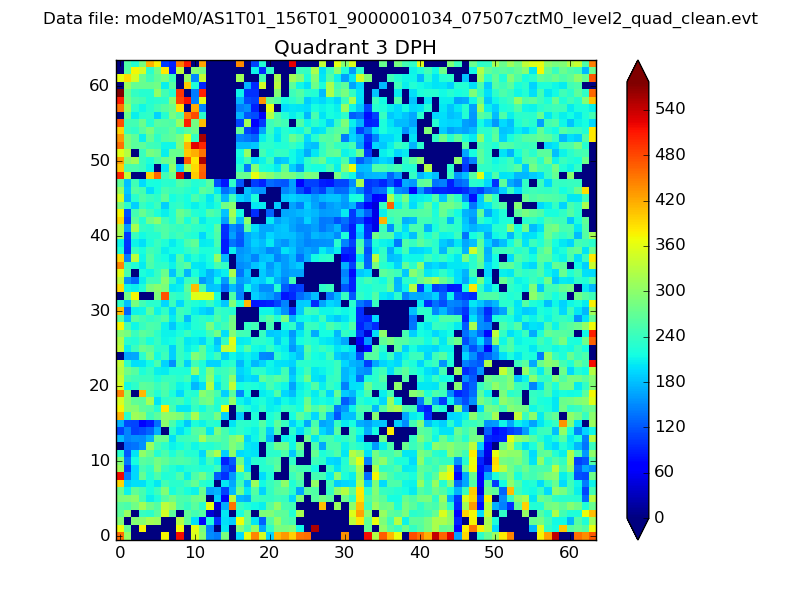 |
 |
Quadrant C |
| Plot type | Count rate plots | Images |
|---|---|---|
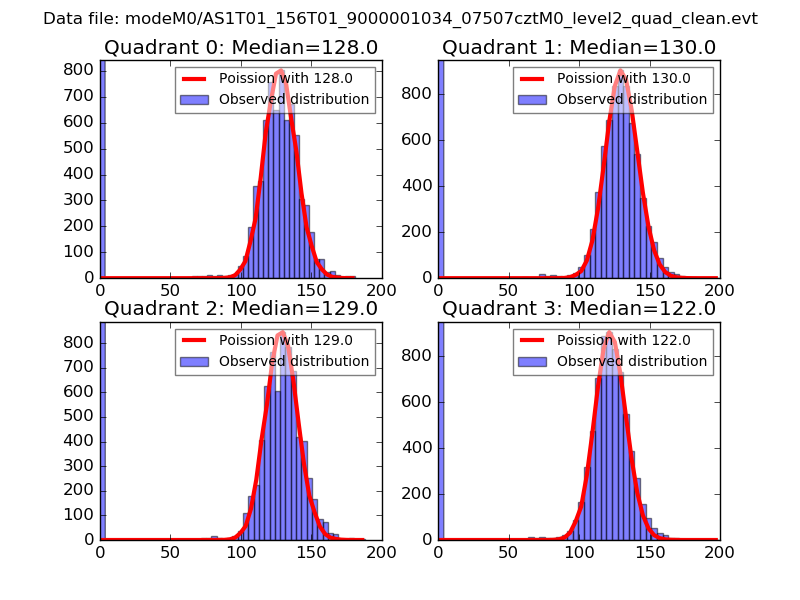
| Comparison with Poisson distribution Blue bars denote a histogram of data divided into 1 sec bins. Red curve is a Poisson curve with rate = median count rate of data. |
 |
 |
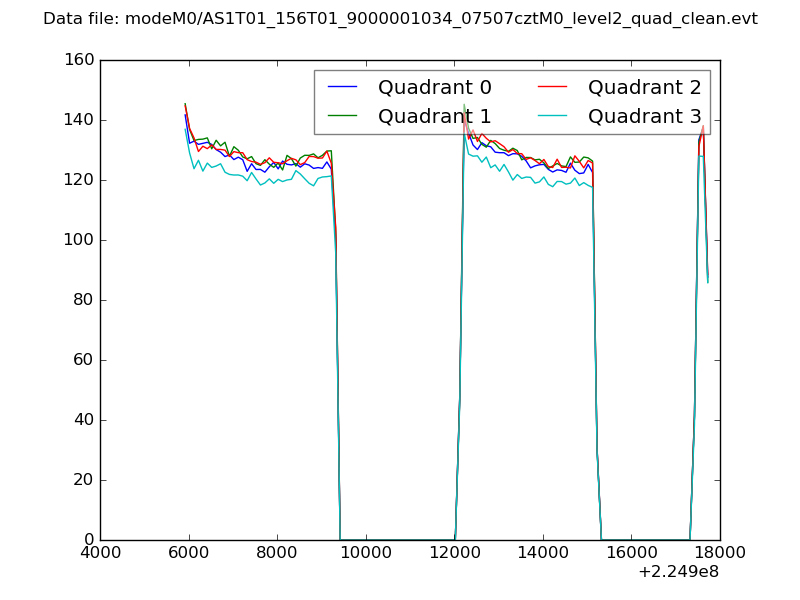
| Quadrant-wise count rates Data is divided into 100 sec bins |
 |
|
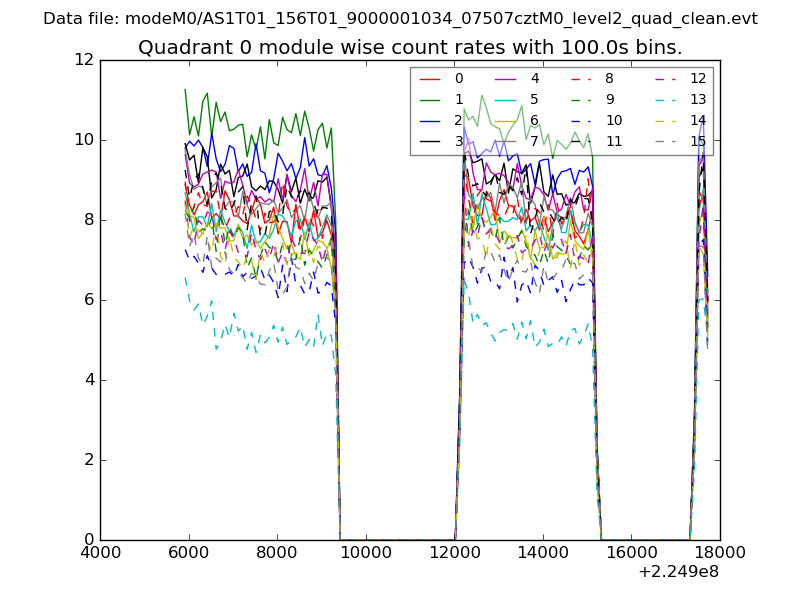
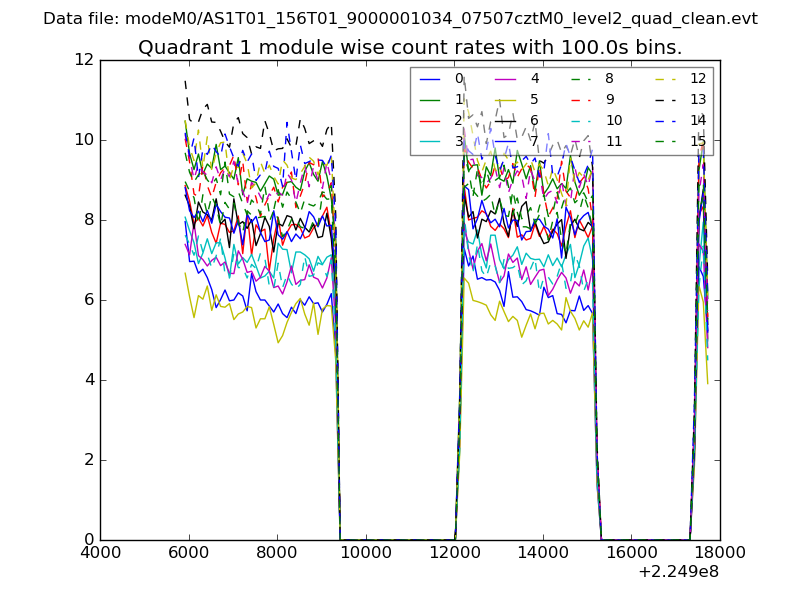
| Module-wise count rates for Quadrant A Data is divided into 100 sec bins |
 |
 |
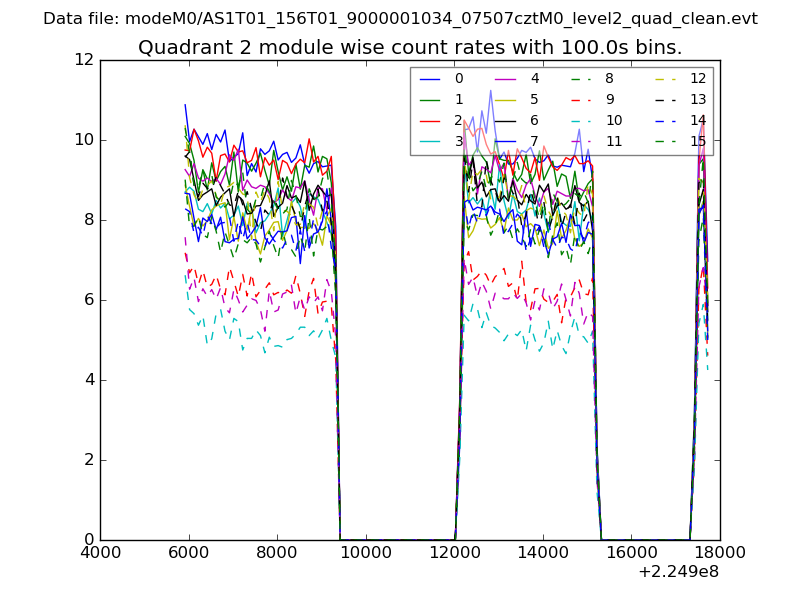
| Module-wise count rates for Quadrant B Data is divided into 100 sec bins |
 |
 |
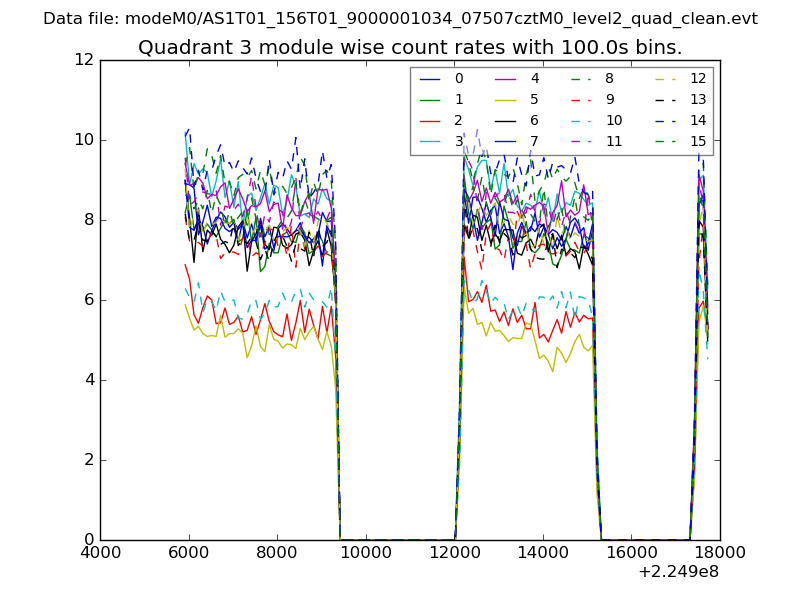
| Module-wise count rates for Quadrant C Data is divided into 100 sec bins |
 |
 |
| Module-wise count rates for Quadrant D Data is divided into 100 sec bins |
 |
 |
| Parameter | Plot |
|---|---|
| CZT HV Monitor | 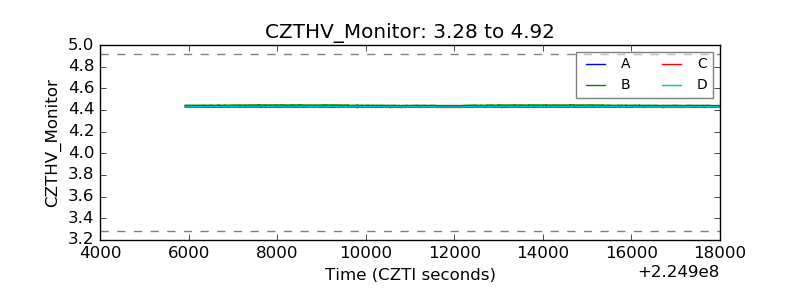 |
| D_VDD | 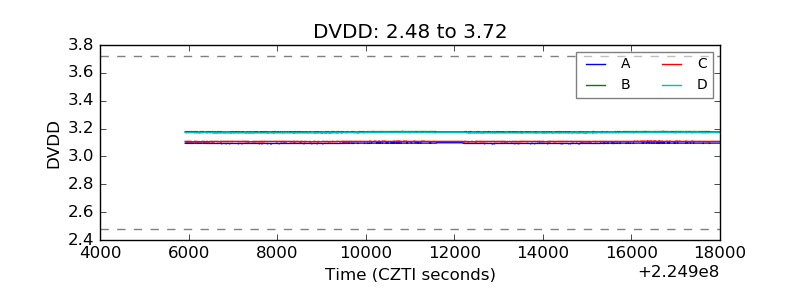 |
| Temperature 1 | 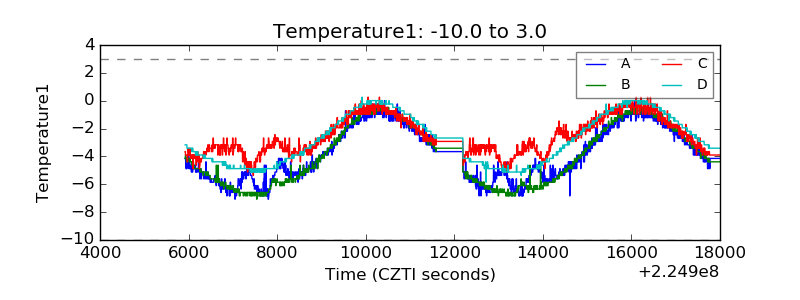 |
| Veto HV Monitor | 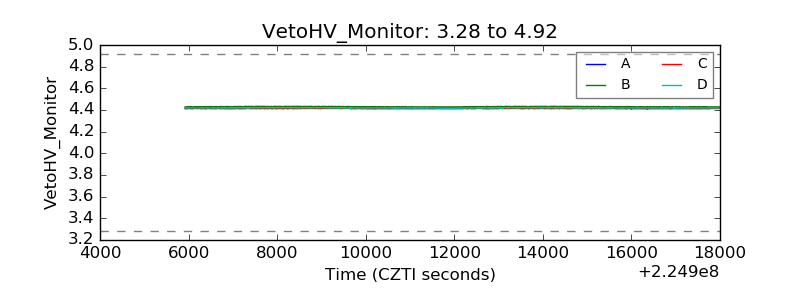 |
| Veto LLD | 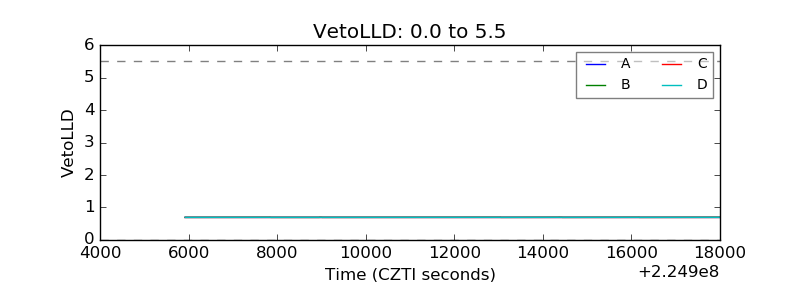 |
| Alpha Counter | 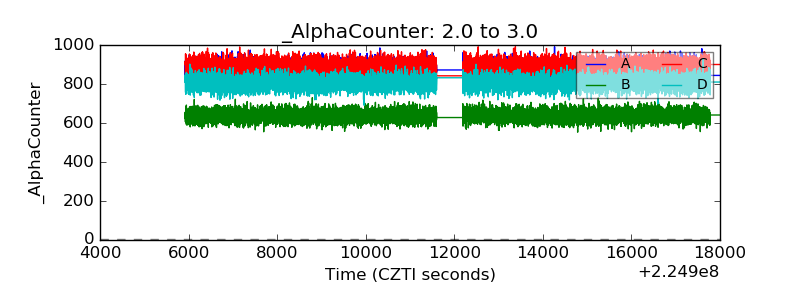 |
| _CPM_Rate | 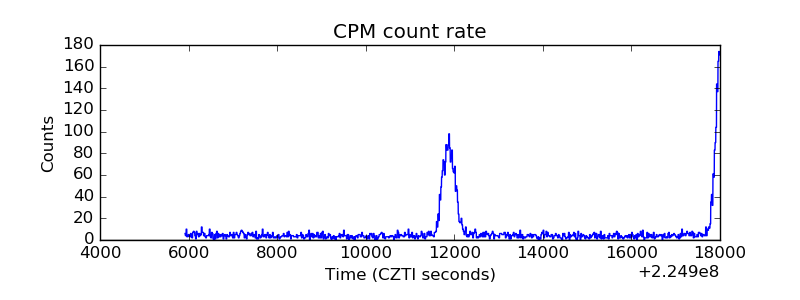 |
| CZT Counter |  |
| +2.5 Volts monitor |  |
| +5 Volts monitor | 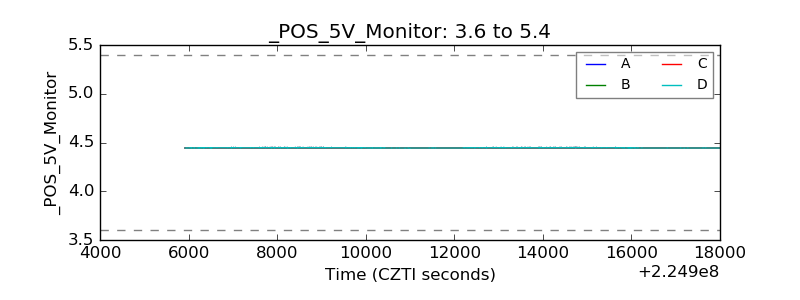 |
| _ROLL_ROT | 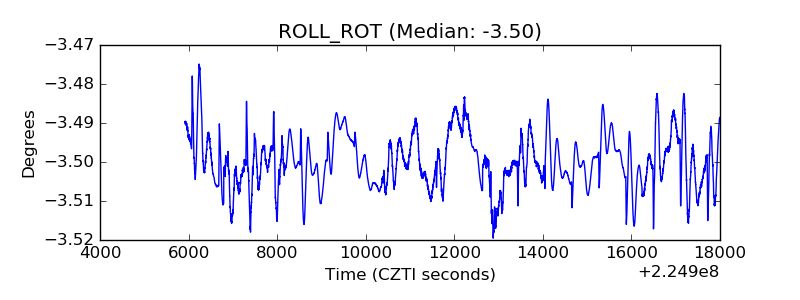 |
| _Roll_DEC | 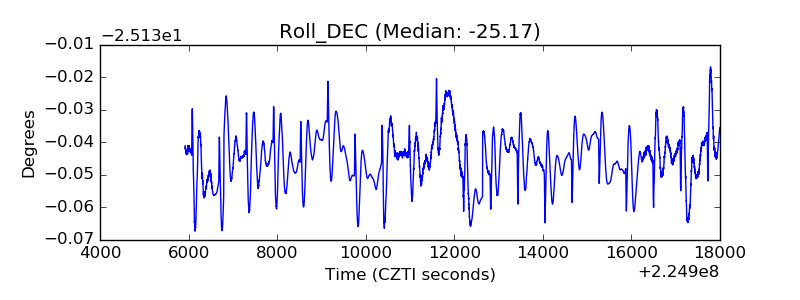 |
| _Roll_RA | 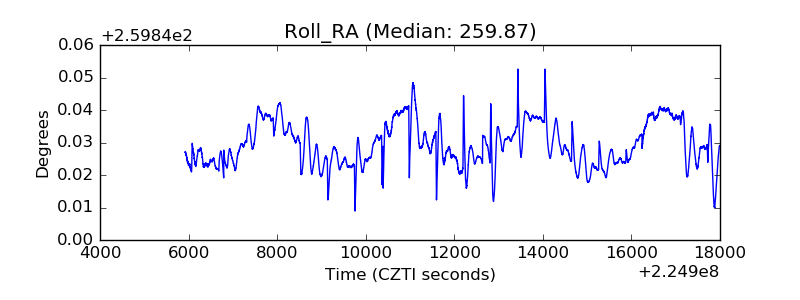 |
| Veto Counter | 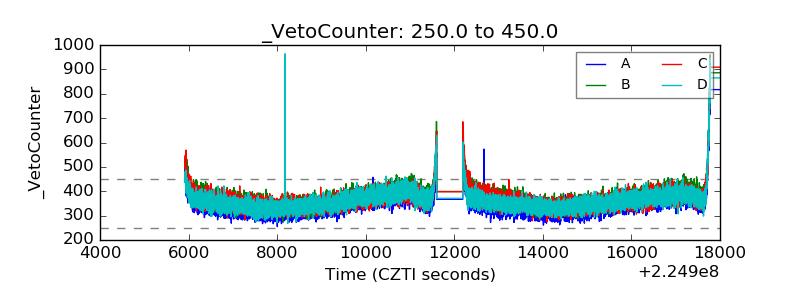 |