| Param | Original file | Final file |
|---|---|---|
| Filename | modeM0/AS1A02_134T01_9000001036cztM0_level2.fits | modeM0/AS1A02_134T01_9000001036cztM0_level2_quad_clean.evt |
| Size (bytes) | 786,801,600 | 890,890,560 |
| Size | 750.4 MB | 849.6 MB |
| Events in quadrant A | 4,770,664 | 5,602,123 |
| Events in quadrant B | 4,602,712 | 5,577,059 |
| Events in quadrant C | 4,624,764 | 5,187,624 |
| Events in quadrant D | 4,009,272 | 4,795,750 |
| Mode SS | |||
|---|---|---|---|
| Quadrant | BADHDUFLAG | Total packets | Discarded packets |
| A | 0 | 1736 | 0 |
| B | 0 | 1736 | 0 |
| C | 0 | 1736 | 0 |
| D | 0 | 1736 | 0 |
| Mode M0 | |||
|---|---|---|---|
| Quadrant | BADHDUFLAG | Total packets | Discarded packets |
| A | 0 | 173646 | 0 |
| B | 0 | 179675 | 0 |
| C | 0 | 190110 | 0 |
| D | 0 | 195032 | 0 |
| Mode M9 | |||
|---|---|---|---|
| Quadrant | BADHDUFLAG | Total packets | Discarded packets |
| A | 0 | 125 | 0 |
| B | 0 | 125 | 0 |
| C | 0 | 125 | 0 |
| D | 0 | 125 | 0 |
| Quadrant | Total seconds | Saturated seconds | Saturation percentage |
|---|---|---|---|
| A | 84877 | 662 | 0.779952% |
| B | 84877 | 899 | 1.059180% |
| C | 84877 | 1091 | 1.285389% |
| D | 84877 | 1772 | 2.087727% |
Noise dominated data is calculated using 1-second bins in cleaned event files. If a bin has >2000 counts, and if more than 50% of those come from <1% of pixels, then it is considered to be noise-dominated and hence unusable.
| Quadrant | # 1 sec bins | Bins with >0 counts | Bins with >2000 counts | High rate bins dominated by noise | Noise dominated (total time) | Noise dominated (detector-on time) | Marked lightcurve |
|---|---|---|---|---|---|---|---|
| A | 97793 | 84872 | 0 | 0 | 0.00% | 0.00% | 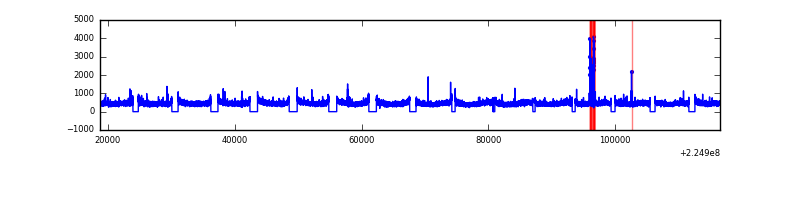 |
| B | 97793 | 84871 | 0 | 0 | 0.00% | 0.00% |  |
| C | 97793 | 84874 | 0 | 0 | 0.00% | 0.00% |  |
| D | 97793 | 84866 | 0 | 0 | 0.00% | 0.00% |  |
Top three noisy pixels from each quadrant. If the there are fewer than three noisy pixels in the level2.evt file, extra rows are filled as -1
| Pixel properties | Quadrant properties | ||||||
|---|---|---|---|---|---|---|---|
| Quadrant | DetID | PixID | Counts | Sigma | Mean | Median | Sigma |
| A | 0 | 29 | 4736 | 11.38 | 1239 | 1161 | 314.1 |
| A | 7 | 110 | 3940 | 8.85 | 1239 | 1161 | 314.1 |
| A | 0 | 30 | 3787 | 8.36 | 1239 | 1161 | 314.1 |
| B | 2 | 9 | 3959 | 11.9 | 1212 | 1157 | 235.5 |
| B | 14 | 254 | 3198 | 8.67 | 1212 | 1157 | 235.5 |
| B | 12 | 226 | 3047 | 8.03 | 1212 | 1157 | 235.5 |
| C | 1 | 80 | 3408 | 7.0 | 1222 | 1135 | 324.5 |
| C | 1 | 81 | 3355 | 6.84 | 1222 | 1135 | 324.5 |
| C | 12 | 241 | 3302 | 6.68 | 1222 | 1135 | 324.5 |
| D | 3 | 14 | 2964 | 6.34 | 1141 | 1039 | 303.8 |
| D | 6 | 231 | 2919 | 6.19 | 1141 | 1039 | 303.8 |
| D | 7 | 5 | 2866 | 6.01 | 1141 | 1039 | 303.8 |
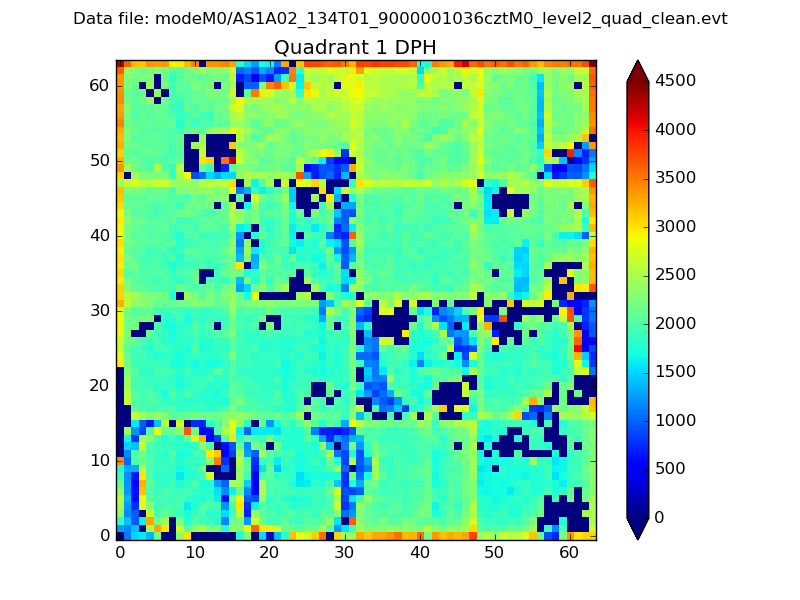
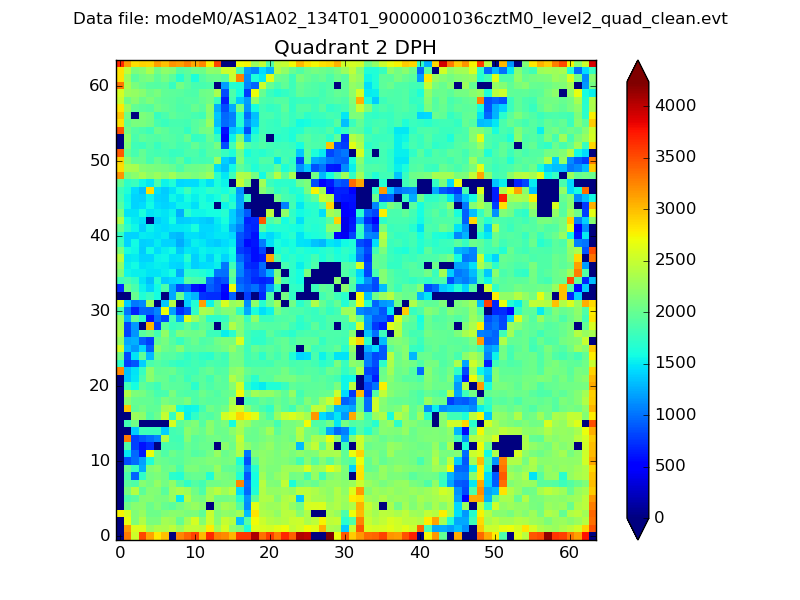
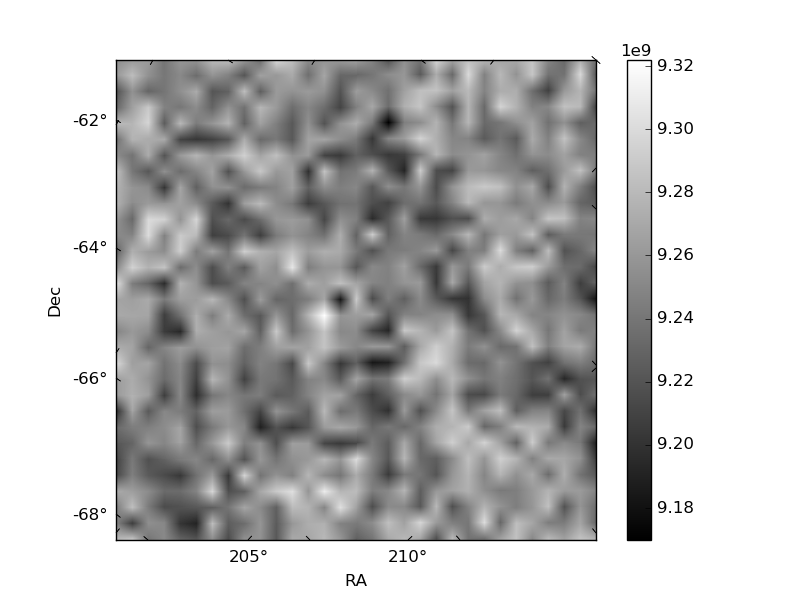
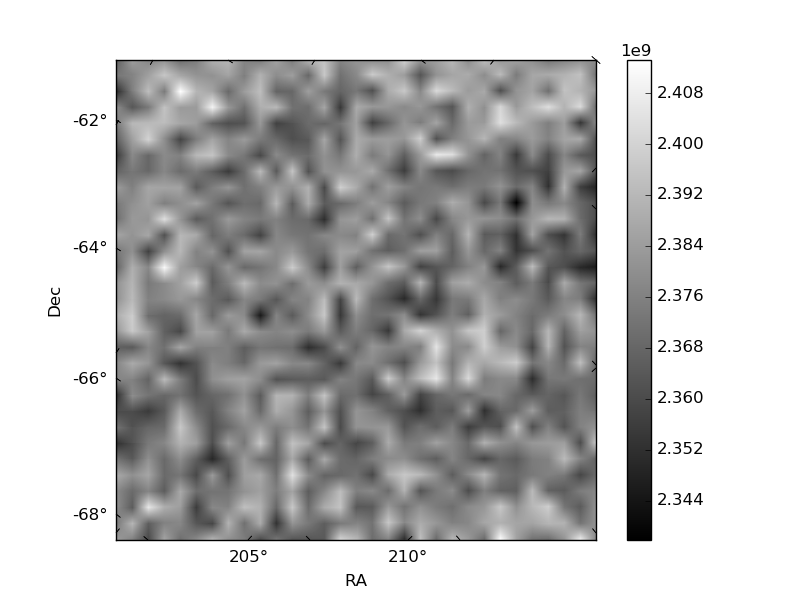
Histogram calculated using DETX and DETY for each event in the final _common_clean file
| Quadrant A |  |
 |
Quadrant B |
|---|---|---|---|
| Quadrant D | 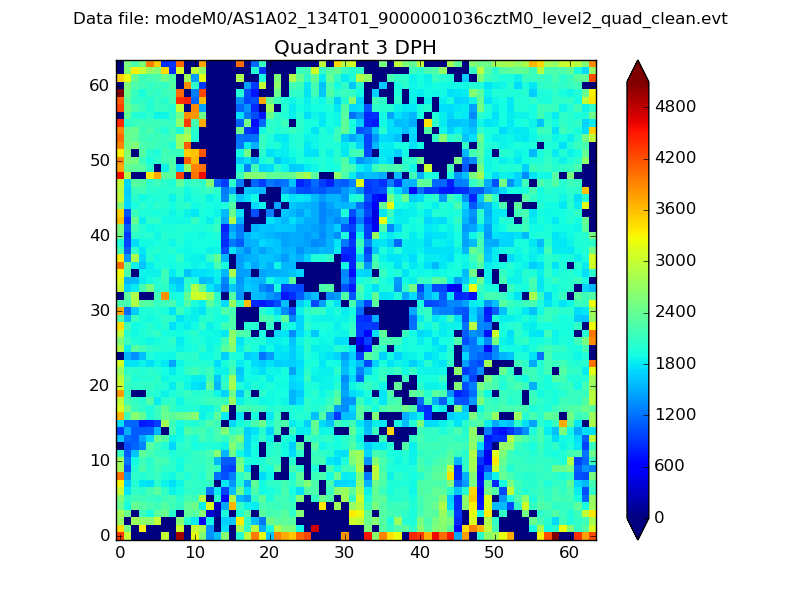 |
 |
Quadrant C |
| Plot type | Count rate plots | Images |
|---|---|---|
| Comparison with Poisson distribution Blue bars denote a histogram of data divided into 1 sec bins. Red curve is a Poisson curve with rate = median count rate of data. |
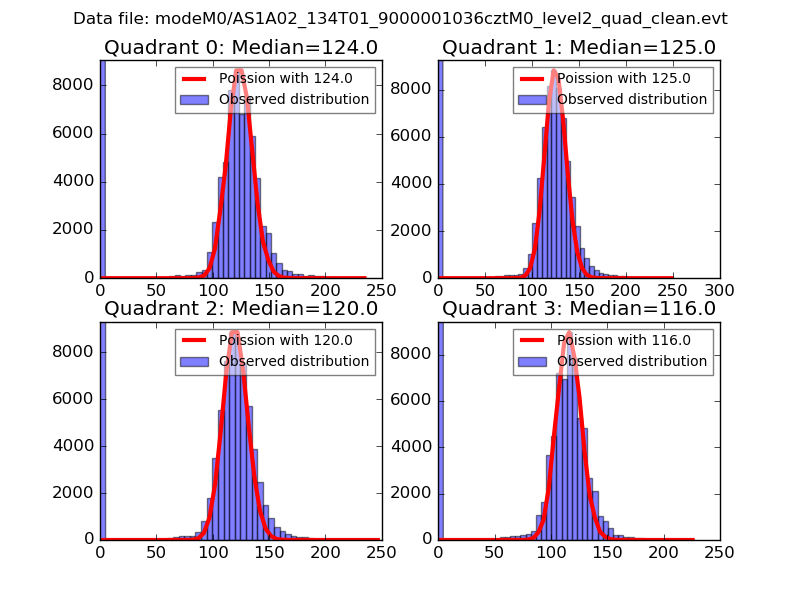 |
 |
| Quadrant-wise count rates Data is divided into 100 sec bins |
 |
|
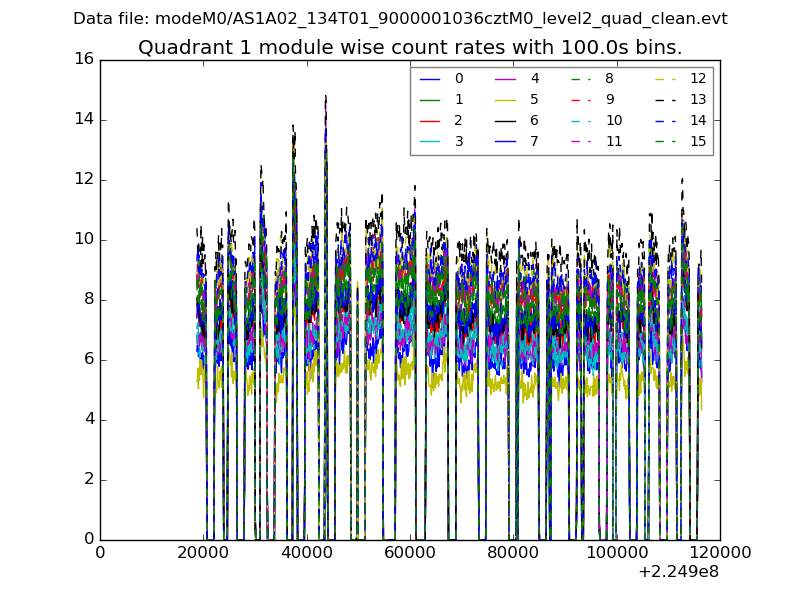
| Module-wise count rates for Quadrant A Data is divided into 100 sec bins |
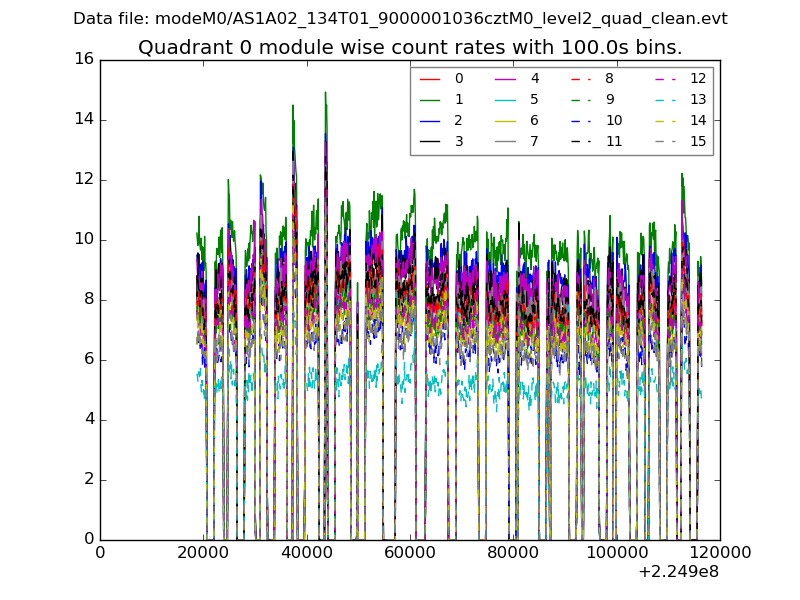 |
 |
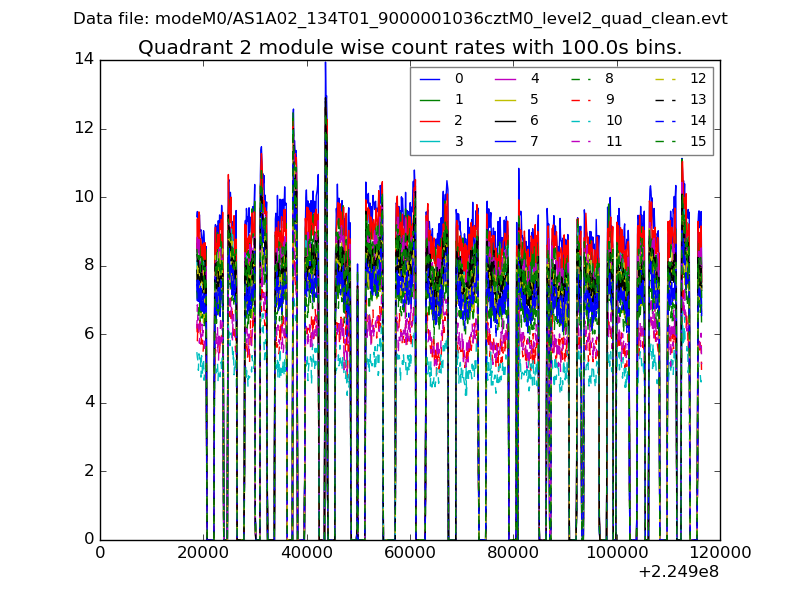
| Module-wise count rates for Quadrant B Data is divided into 100 sec bins |
 |
 |
| Module-wise count rates for Quadrant C Data is divided into 100 sec bins |
 |
 |
| Module-wise count rates for Quadrant D Data is divided into 100 sec bins |
 |
 |
| Parameter | Plot |
|---|---|
| CZT HV Monitor | 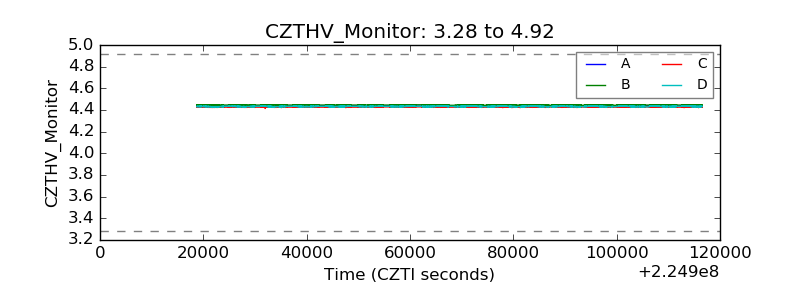 |
| D_VDD | 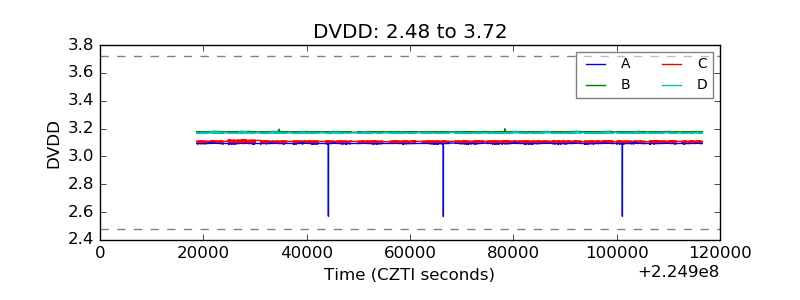 |
| Temperature 1 | 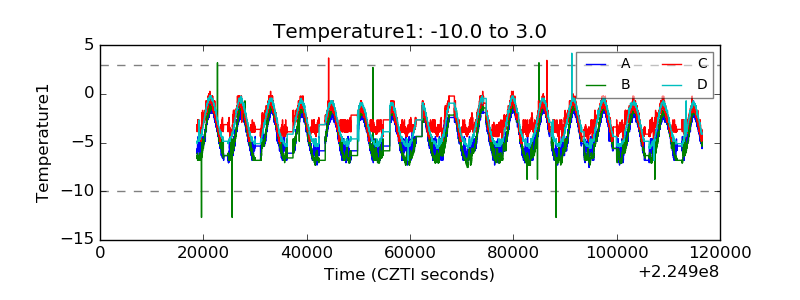 |
| Veto HV Monitor |  |
| Veto LLD | 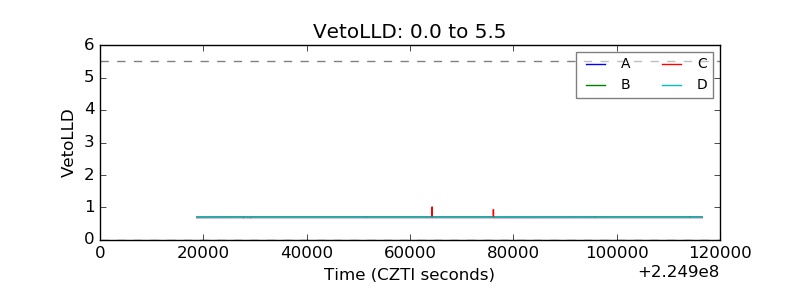 |
| Alpha Counter | 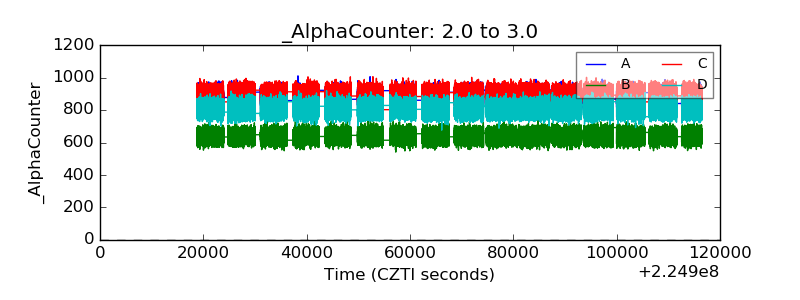 |
| _CPM_Rate | 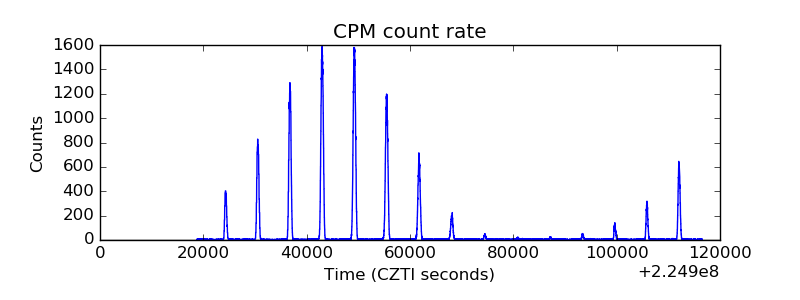 |
| CZT Counter |  |
| +2.5 Volts monitor | 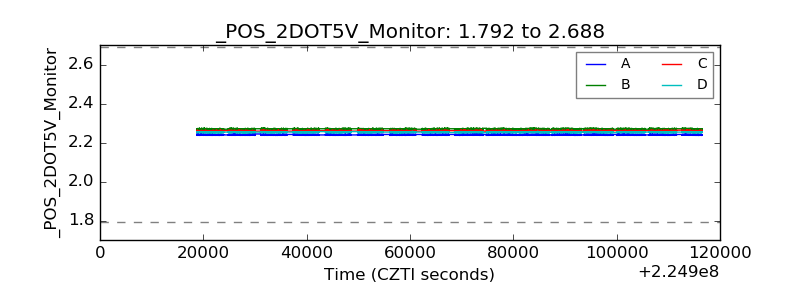 |
| +5 Volts monitor |  |
| _ROLL_ROT | 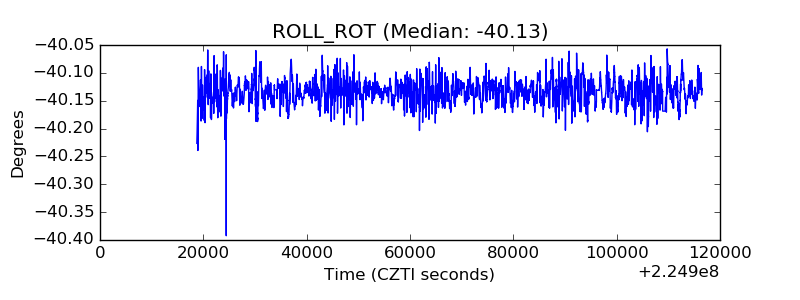 |
| _Roll_DEC | 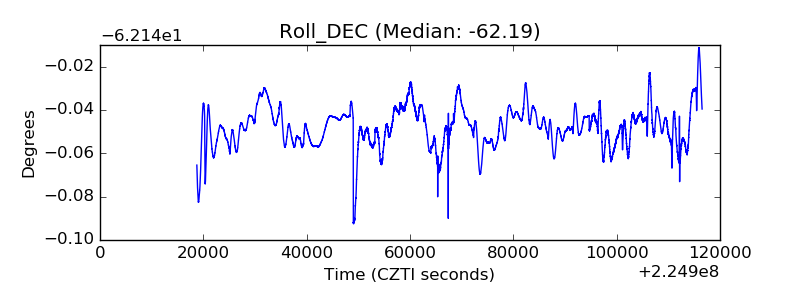 |
| _Roll_RA | 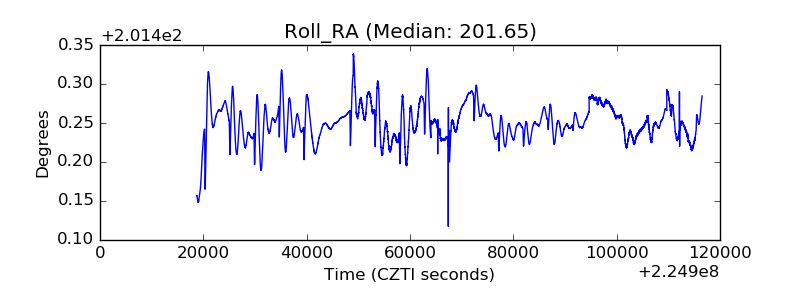 |
| Veto Counter | 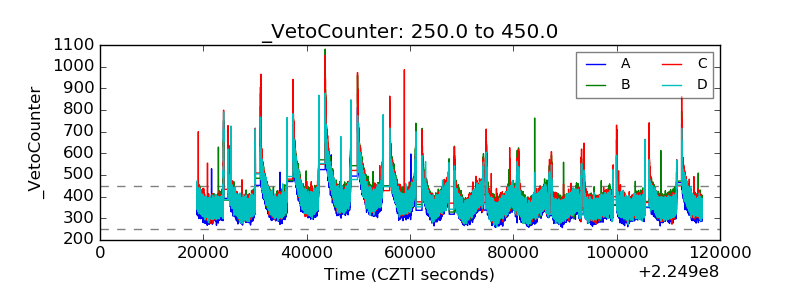 |