| Param | Original file | Final file |
|---|---|---|
| Filename | modeM0/AS1A02_134T01_9000001036_07507cztM0_level2.evt | modeM0/AS1A02_134T01_9000001036_07507cztM0_level2_quad_clean.evt |
| Size (bytes) | 209,839,680 | 37,532,160 |
| Size | 200.1 MB | 35.8 MB |
| Events in quadrant A | 1,387,563 | 231,609 |
| Events in quadrant B | 1,545,926 | 236,027 |
| Events in quadrant C | 1,396,248 | 227,697 |
| Events in quadrant D | 1,802,478 | 209,979 |
| Mode SS | |||
|---|---|---|---|
| Quadrant | BADHDUFLAG | Total packets | Discarded packets |
| A | 0 | 64 | 0 |
| B | 0 | 64 | 0 |
| C | 0 | 64 | 0 |
| D | 0 | 64 | 0 |
| Mode M0 | |||
|---|---|---|---|
| Quadrant | BADHDUFLAG | Total packets | Discarded packets |
| A | 0 | 6513 | 1 |
| B | 0 | 6737 | 0 |
| C | 0 | 6515 | 0 |
| D | 0 | 7675 | 0 |
| Quadrant | Total seconds | Saturated seconds | Saturation percentage |
|---|---|---|---|
| A | 3250 | 3 | 0.092308% |
| B | 3250 | 3 | 0.092308% |
| C | 3250 | 0 | 0.000000% |
| D | 3250 | 121 | 3.723077% |
Noise dominated data is calculated using 1-second bins in cleaned event files. If a bin has >2000 counts, and if more than 50% of those come from <1% of pixels, then it is considered to be noise-dominated and hence unusable.
| Quadrant | # 1 sec bins | Bins with >0 counts | Bins with >2000 counts | High rate bins dominated by noise | Noise dominated (total time) | Noise dominated (detector-on time) | Marked lightcurve |
|---|---|---|---|---|---|---|---|
| A | 3250 | 3250 | 0 | 0 | 0.00% | 0.00% | 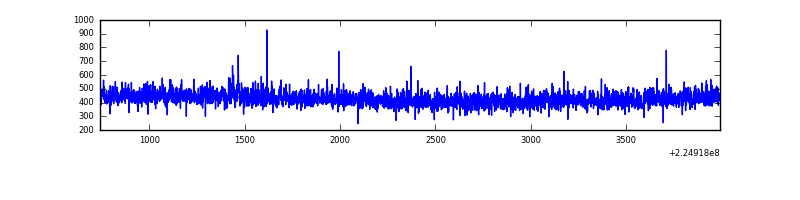 |
| B | 3250 | 3250 | 2 | 2 | 0.06% | 0.06% | 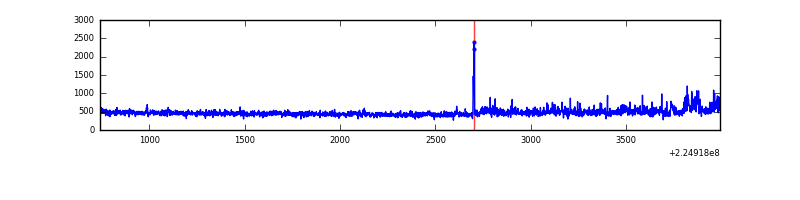 |
| C | 3250 | 3250 | 0 | 0 | 0.00% | 0.00% | 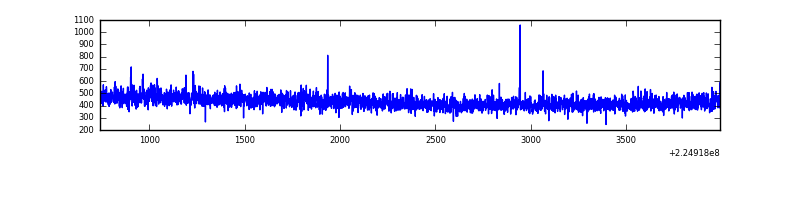 |
| D | 3250 | 3250 | 96 | 96 | 2.95% | 2.95% | 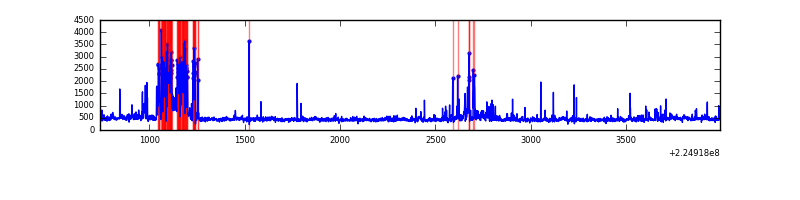 |
Top three noisy pixels from each quadrant. If the there are fewer than three noisy pixels in the level2.evt file, extra rows are filled as -1
| Pixel properties | Quadrant properties | ||||||
|---|---|---|---|---|---|---|---|
| Quadrant | DetID | PixID | Counts | Sigma | Mean | Median | Sigma |
| A | 13 | 248 | 4404 | 54.65 | 358 | 349 | 74.2 |
| A | 0 | 226 | 3224 | 38.75 | 358 | 349 | 74.2 |
| A | 15 | 239 | 3154 | 37.81 | 358 | 349 | 74.2 |
| B | 0 | 214 | 87234 | 1225.76 | 359 | 349 | 70.9 |
| B | 0 | 229 | 57019 | 799.49 | 359 | 349 | 70.9 |
| B | 0 | 219 | 7359 | 98.9 | 359 | 349 | 70.9 |
| C | 8 | 229 | 7778 | 89.26 | 353 | 354 | 83.2 |
| C | 1 | 16 | 3070 | 32.66 | 353 | 354 | 83.2 |
| C | 13 | 61 | 2776 | 29.12 | 353 | 354 | 83.2 |
| D | 2 | 152 | 409019 | 4750.78 | 347 | 336 | 86.0 |
| D | 2 | 136 | 20681 | 236.5 | 347 | 336 | 86.0 |
| D | 13 | 29 | 19269 | 220.09 | 347 | 336 | 86.0 |
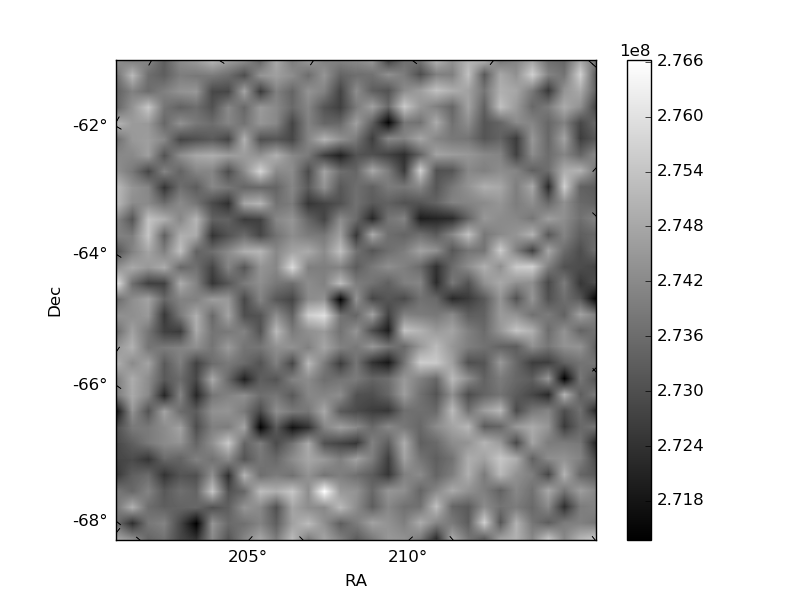
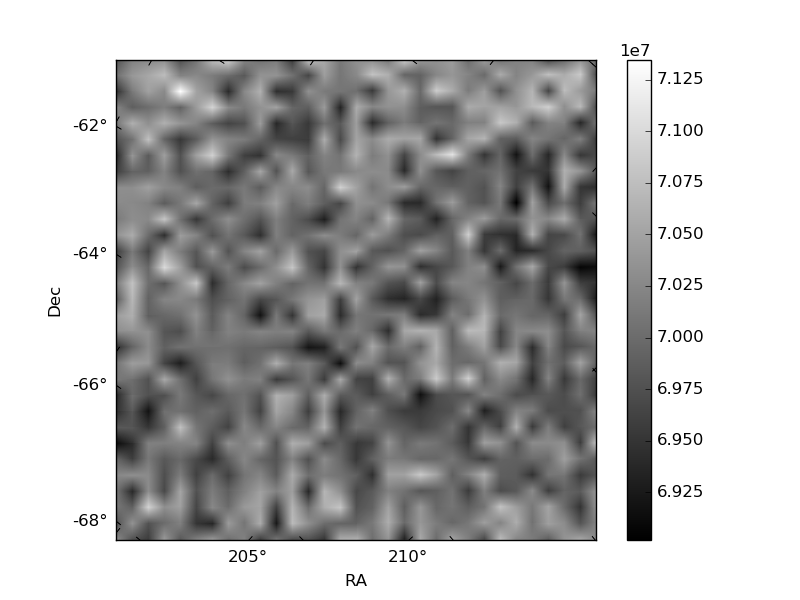
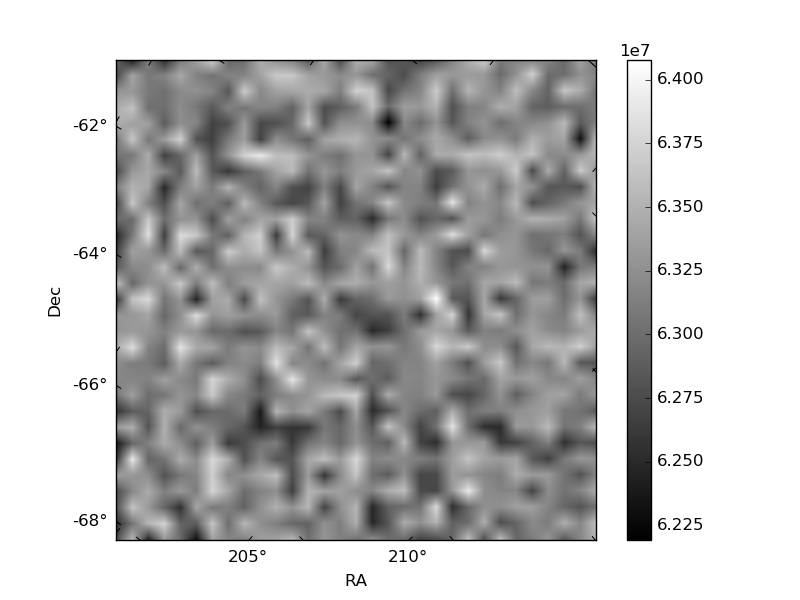
Histogram calculated using DETX and DETY for each event in the final _common_clean file
| Quadrant A | 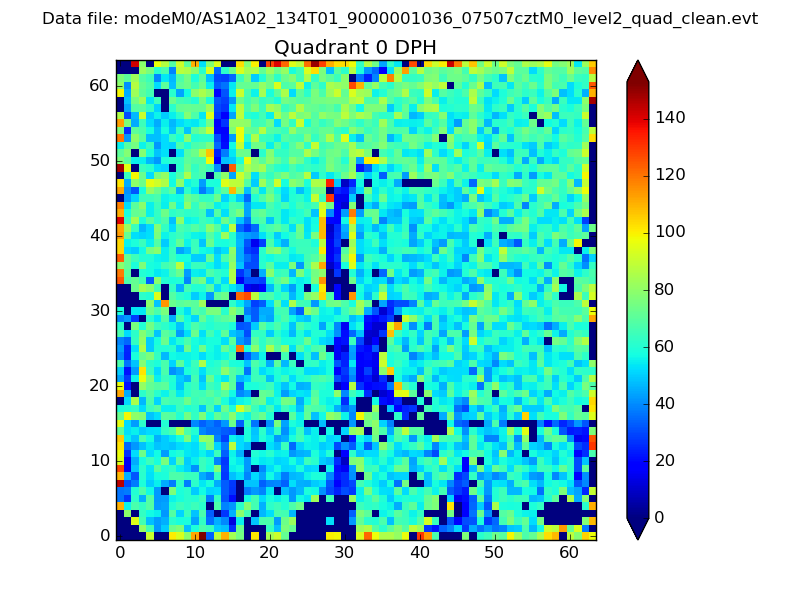 |
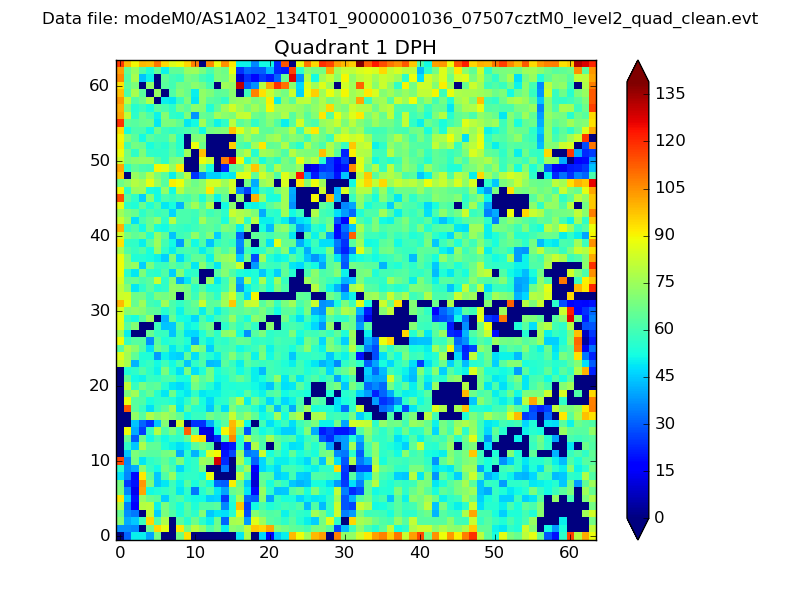 |
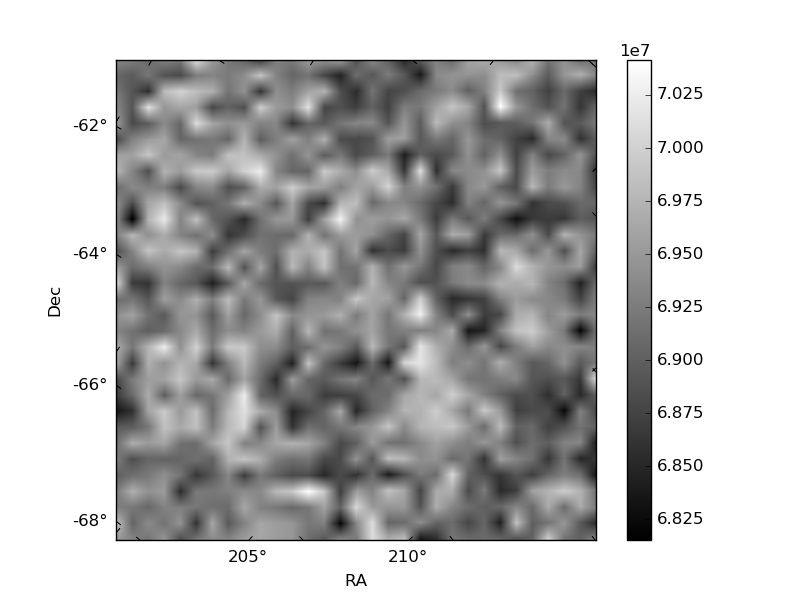
Quadrant B |
|---|---|---|---|
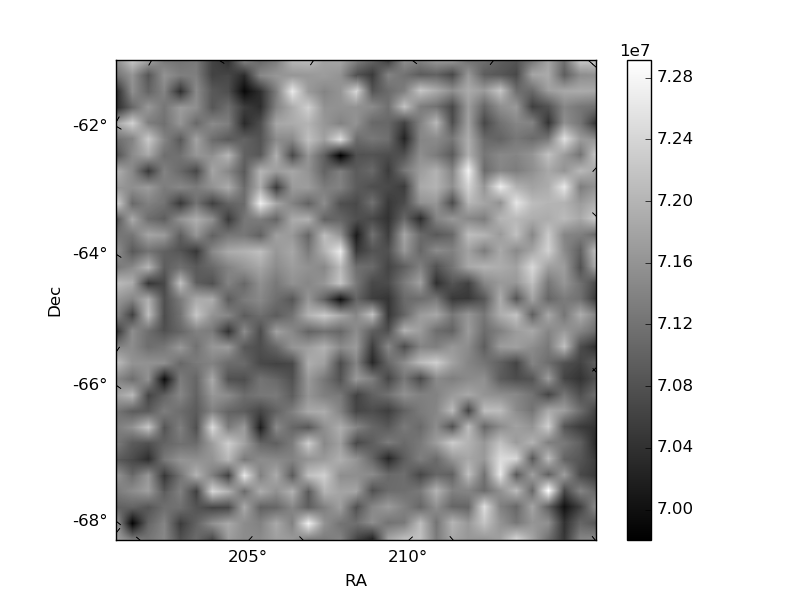
| Quadrant D | 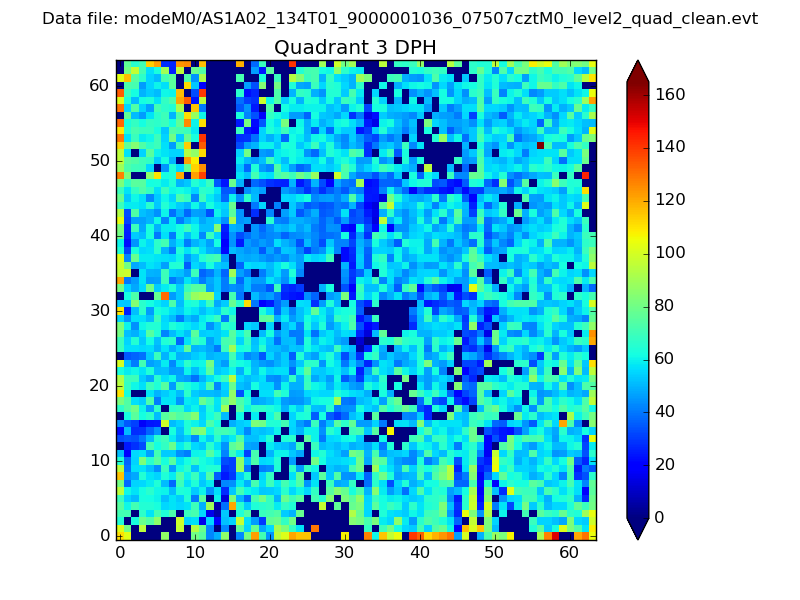 |
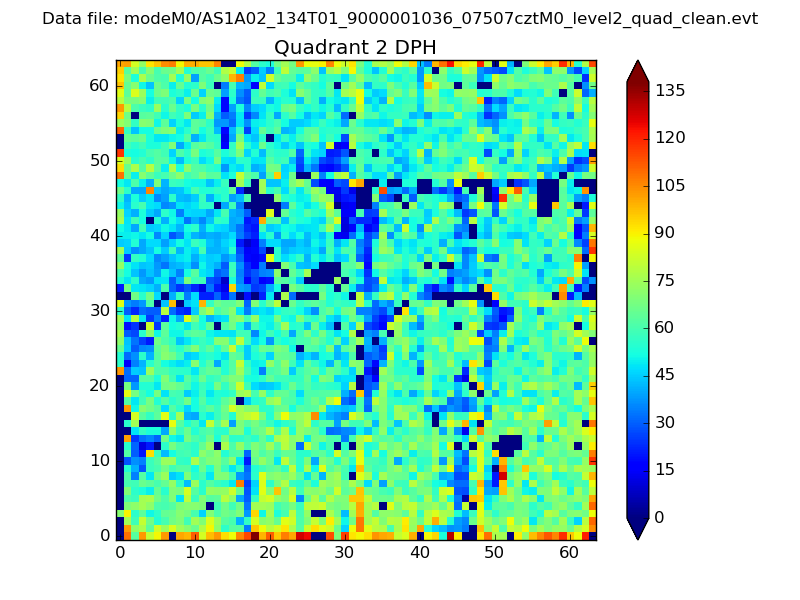 |
Quadrant C |
| Plot type | Count rate plots | Images |
|---|---|---|
| Comparison with Poisson distribution Blue bars denote a histogram of data divided into 1 sec bins. Red curve is a Poisson curve with rate = median count rate of data. |
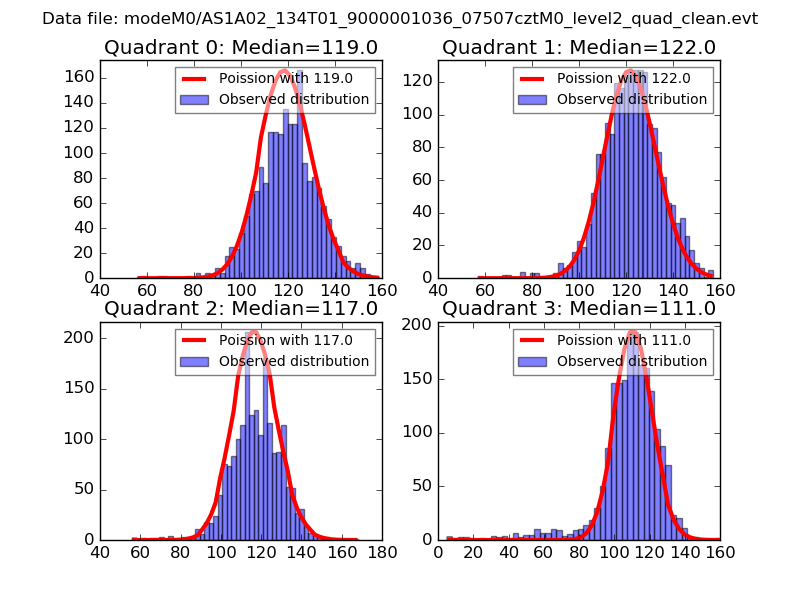 |
 |
| Quadrant-wise count rates Data is divided into 100 sec bins |
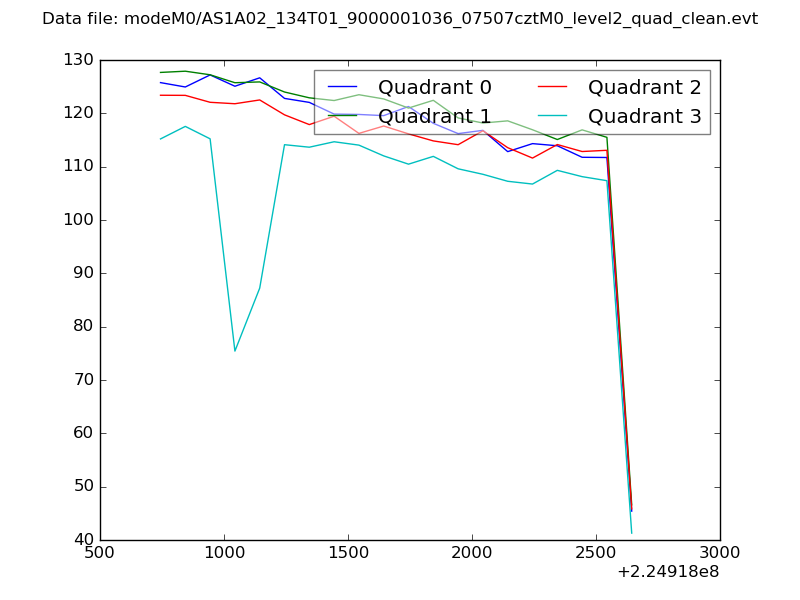 |
|
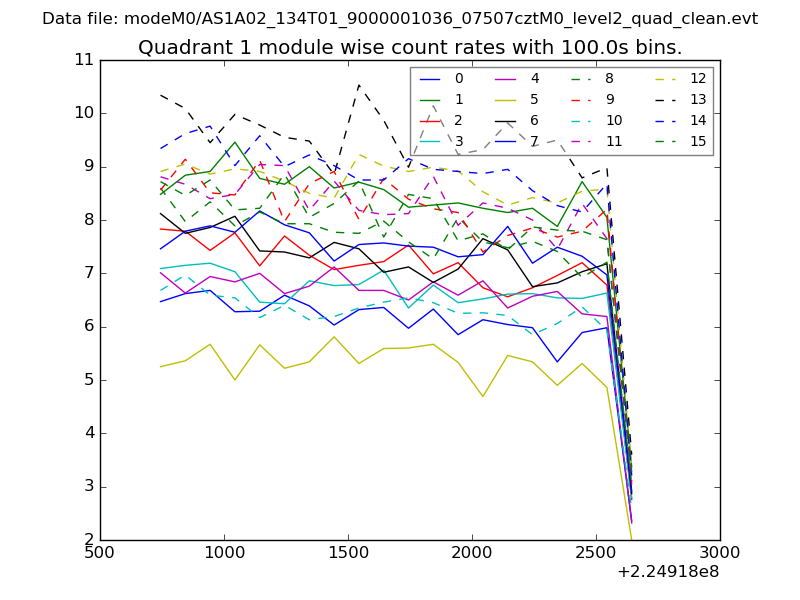
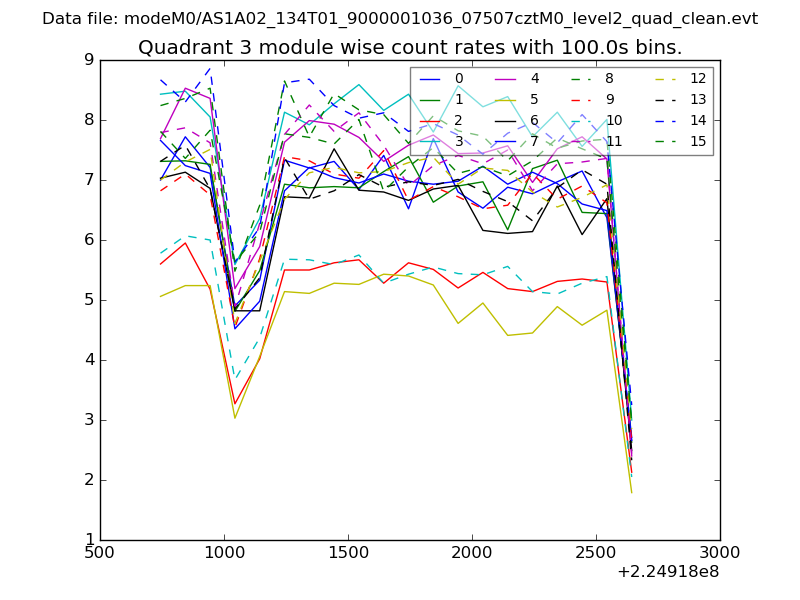
| Module-wise count rates for Quadrant A Data is divided into 100 sec bins |
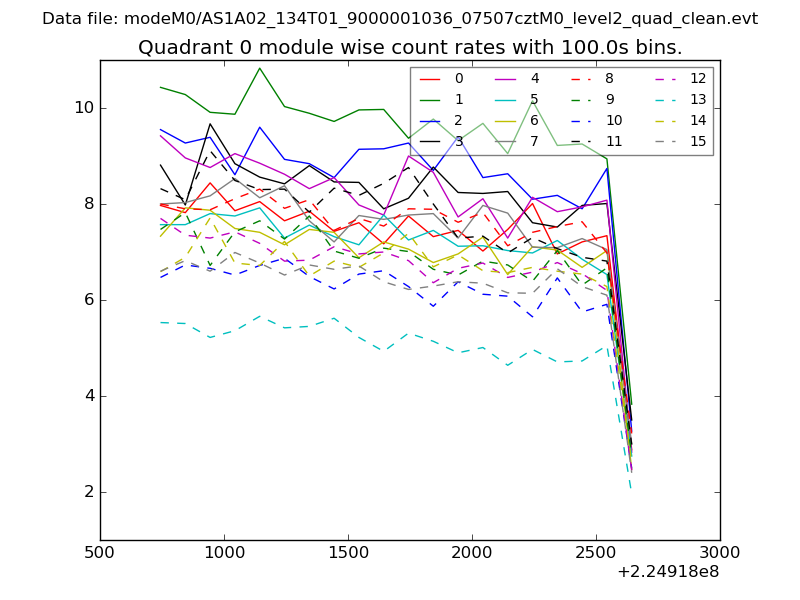 |
 |
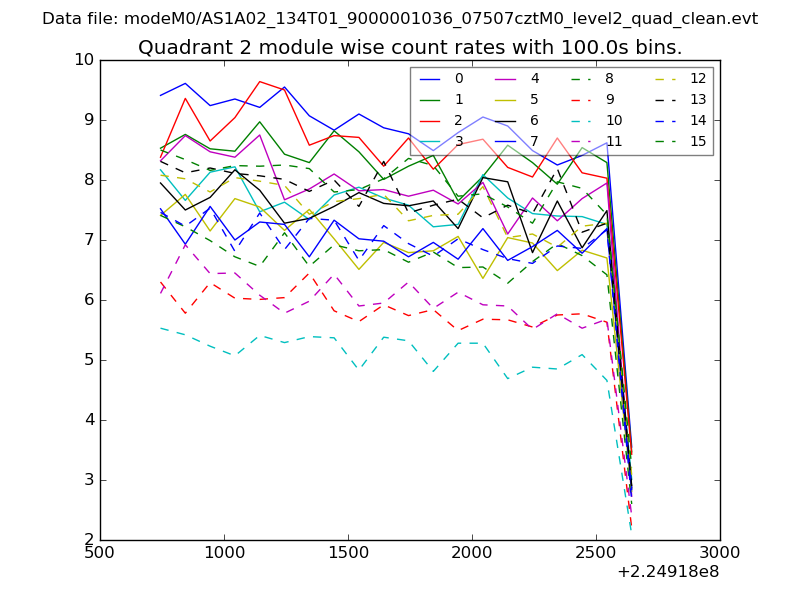
| Module-wise count rates for Quadrant B Data is divided into 100 sec bins |
 |
 |
| Module-wise count rates for Quadrant C Data is divided into 100 sec bins |
 |
 |
| Module-wise count rates for Quadrant D Data is divided into 100 sec bins |
 |
 |
| Parameter | Plot |
|---|---|
| CZT HV Monitor | 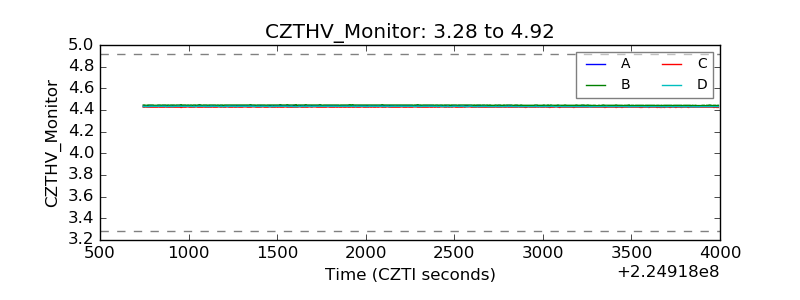 |
| D_VDD | 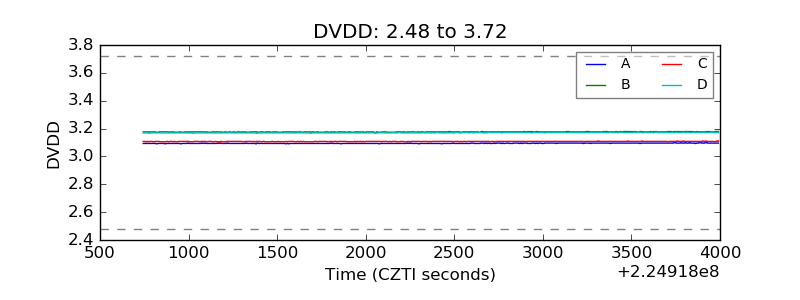 |
| Temperature 1 |  |
| Veto HV Monitor | 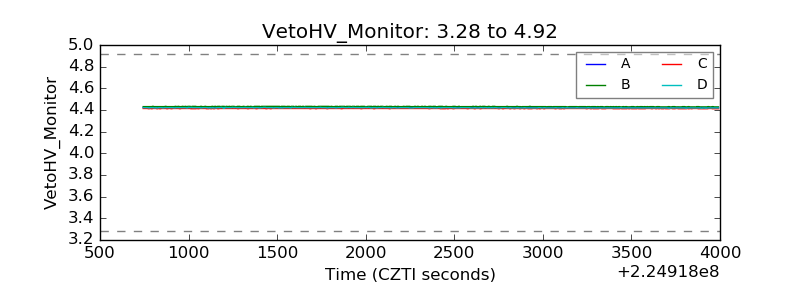 |
| Veto LLD | 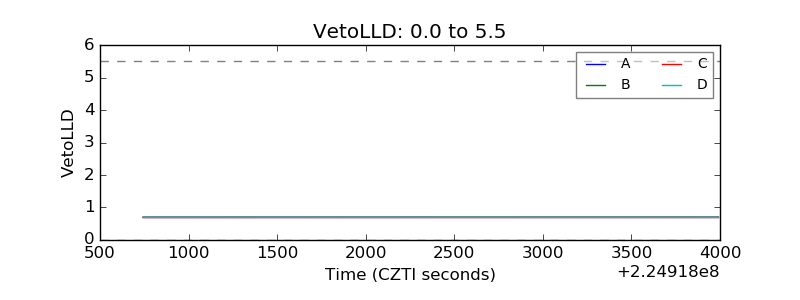 |
| Alpha Counter | 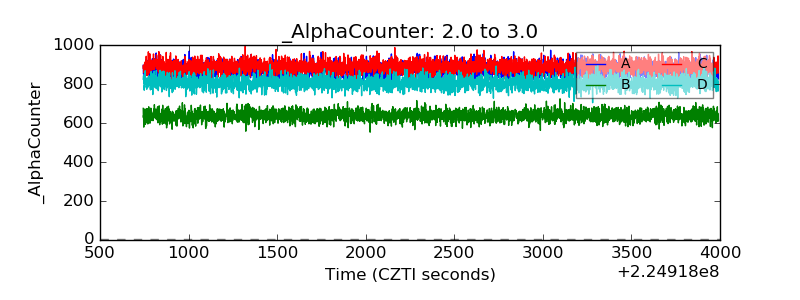 |
| _CPM_Rate | 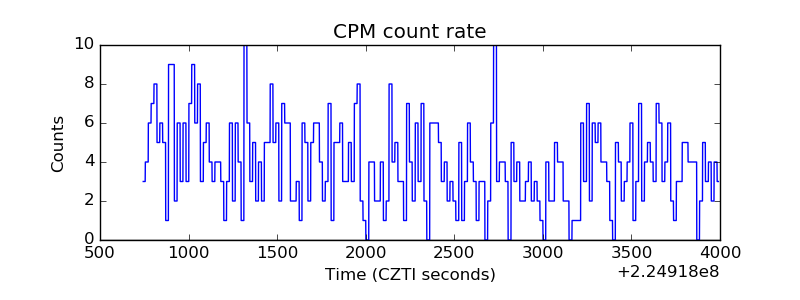 |
| CZT Counter | 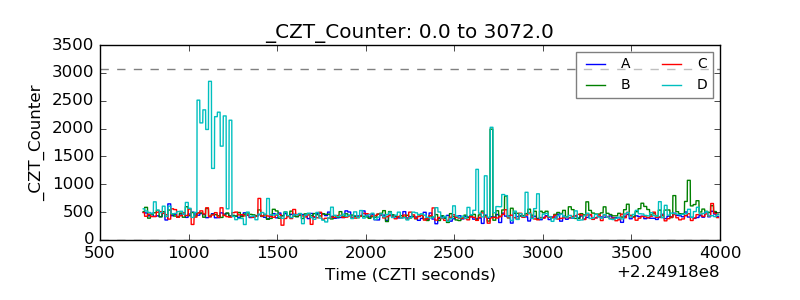 |
| +2.5 Volts monitor | 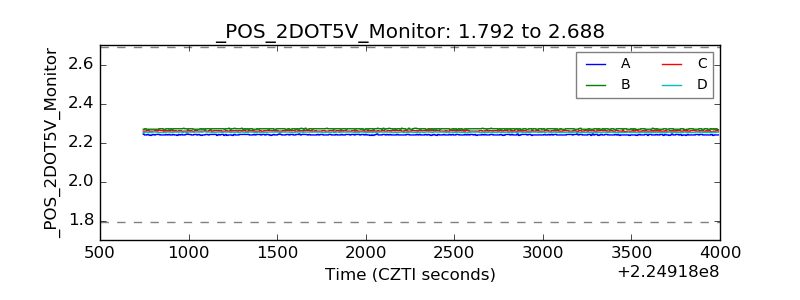 |
| +5 Volts monitor | 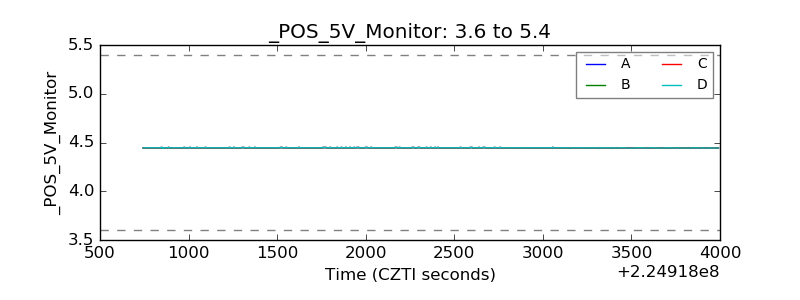 |
| _ROLL_ROT | 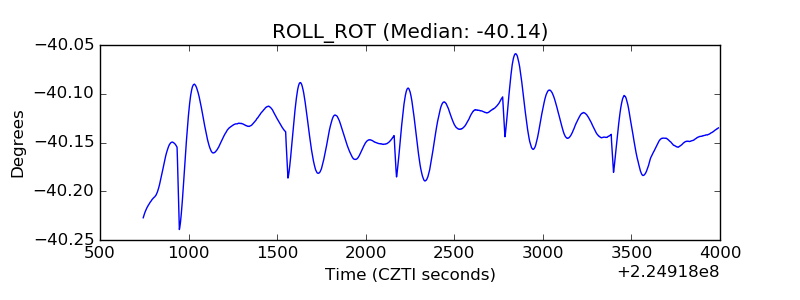 |
| _Roll_DEC |  |
| _Roll_RA | 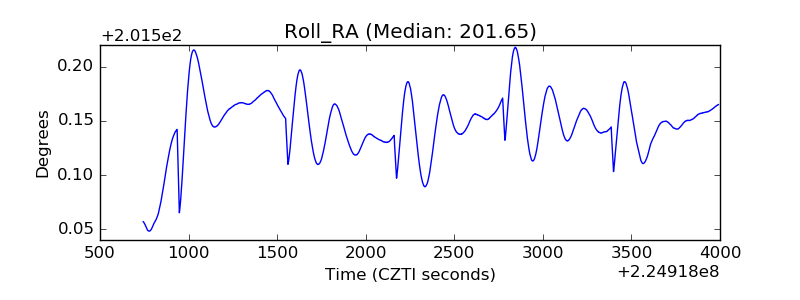 |
| Veto Counter | 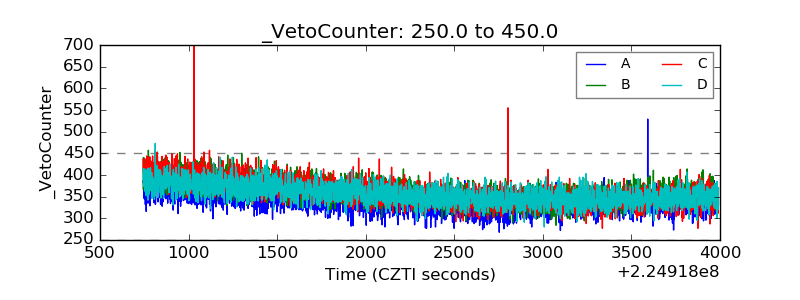 |