| Param | Original file | Final file |
|---|---|---|
| Filename | modeM0/AS1A02_134T01_9000001036_07509cztM0_level2.evt | modeM0/AS1A02_134T01_9000001036_07509cztM0_level2_quad_clean.evt |
| Size (bytes) | 937,339,200 | 201,257,280 |
| Size | 893.9 MB | 191.9 MB |
| Events in quadrant A | 6,544,011 | 1,301,636 |
| Events in quadrant B | 7,042,633 | 1,308,695 |
| Events in quadrant C | 6,897,893 | 1,273,260 |
| Events in quadrant D | 6,937,955 | 1,228,179 |
| Mode SS | |||
|---|---|---|---|
| Quadrant | BADHDUFLAG | Total packets | Discarded packets |
| A | 0 | 292 | 0 |
| B | 0 | 292 | 0 |
| C | 0 | 292 | 0 |
| D | 0 | 292 | 0 |
| Mode M0 | |||
|---|---|---|---|
| Quadrant | BADHDUFLAG | Total packets | Discarded packets |
| A | 0 | 29183 | 4 |
| B | 0 | 29923 | 3 |
| C | 0 | 30267 | 3 |
| D | 0 | 30661 | 3 |
| Mode M9 | |||
|---|---|---|---|
| Quadrant | BADHDUFLAG | Total packets | Discarded packets |
| A | 0 | 29 | 0 |
| B | 0 | 29 | 0 |
| C | 0 | 29 | 0 |
| D | 0 | 29 | 0 |
| Quadrant | Total seconds | Saturated seconds | Saturation percentage |
|---|---|---|---|
| A | 14246 | 162 | 1.137161% |
| B | 14246 | 183 | 1.284571% |
| C | 14246 | 157 | 1.102064% |
| D | 14246 | 197 | 1.382844% |
Noise dominated data is calculated using 1-second bins in cleaned event files. If a bin has >2000 counts, and if more than 50% of those come from <1% of pixels, then it is considered to be noise-dominated and hence unusable.
| Quadrant | # 1 sec bins | Bins with >0 counts | Bins with >2000 counts | High rate bins dominated by noise | Noise dominated (total time) | Noise dominated (detector-on time) | Marked lightcurve |
|---|---|---|---|---|---|---|---|
| A | 17236 | 14246 | 0 | 0 | 0.00% | 0.00% | 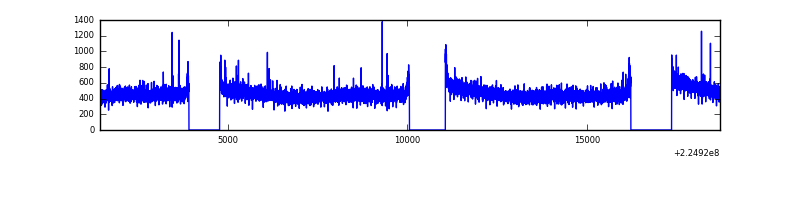 |
| B | 17236 | 14246 | 9 | 9 | 0.05% | 0.06% | 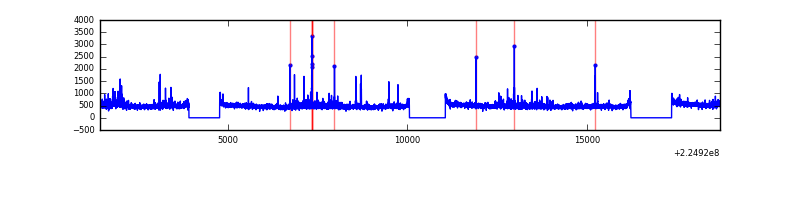 |
| C | 17236 | 14246 | 17 | 17 | 0.10% | 0.12% | 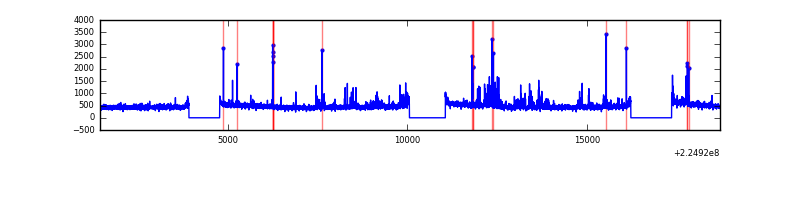 |
| D | 17236 | 14246 | 48 | 48 | 0.28% | 0.34% | 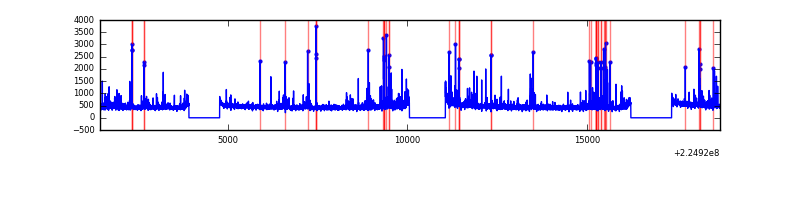 |
Top three noisy pixels from each quadrant. If the there are fewer than three noisy pixels in the level2.evt file, extra rows are filled as -1
| Pixel properties | Quadrant properties | ||||||
|---|---|---|---|---|---|---|---|
| Quadrant | DetID | PixID | Counts | Sigma | Mean | Median | Sigma |
| A | 3 | 1 | 17995 | 48.32 | 1691 | 1658 | 338.1 |
| A | 0 | 226 | 16083 | 42.66 | 1691 | 1658 | 338.1 |
| A | 12 | 194 | 14993 | 39.44 | 1691 | 1658 | 338.1 |
| B | 0 | 214 | 258560 | 810.76 | 1692 | 1649 | 316.9 |
| B | 0 | 229 | 77766 | 240.21 | 1692 | 1649 | 316.9 |
| B | 0 | 219 | 65373 | 201.1 | 1692 | 1649 | 316.9 |
| C | 8 | 229 | 282199 | 750.08 | 1634 | 1640 | 374.0 |
| C | 9 | 68 | 121681 | 320.93 | 1634 | 1640 | 374.0 |
| C | 1 | 16 | 80091 | 209.74 | 1634 | 1640 | 374.0 |
| D | 2 | 152 | 307311 | 771.06 | 1635 | 1582 | 396.5 |
| D | 1 | 52 | 144704 | 360.96 | 1635 | 1582 | 396.5 |
| D | 2 | 14 | 83562 | 206.76 | 1635 | 1582 | 396.5 |
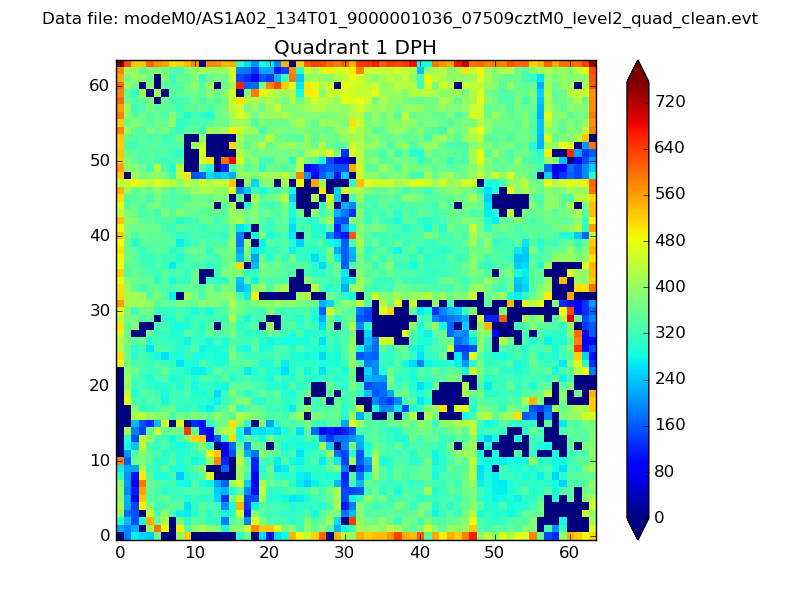
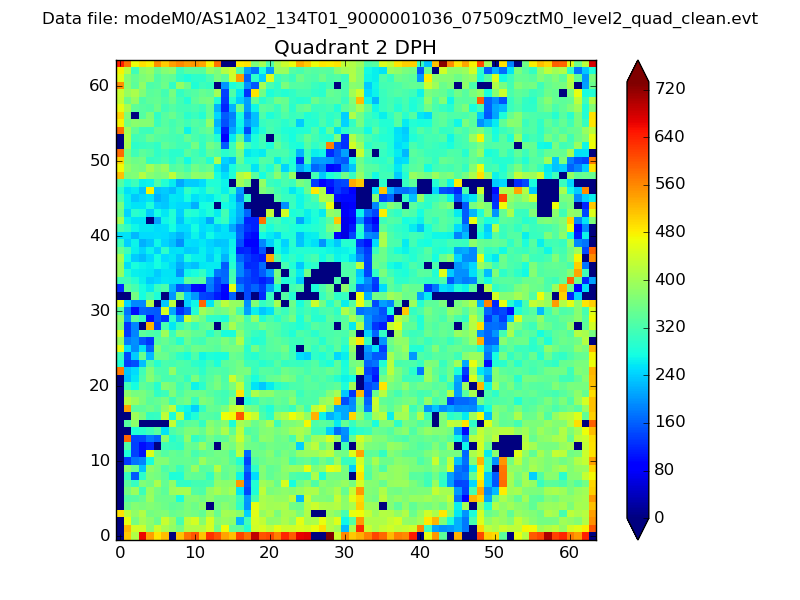
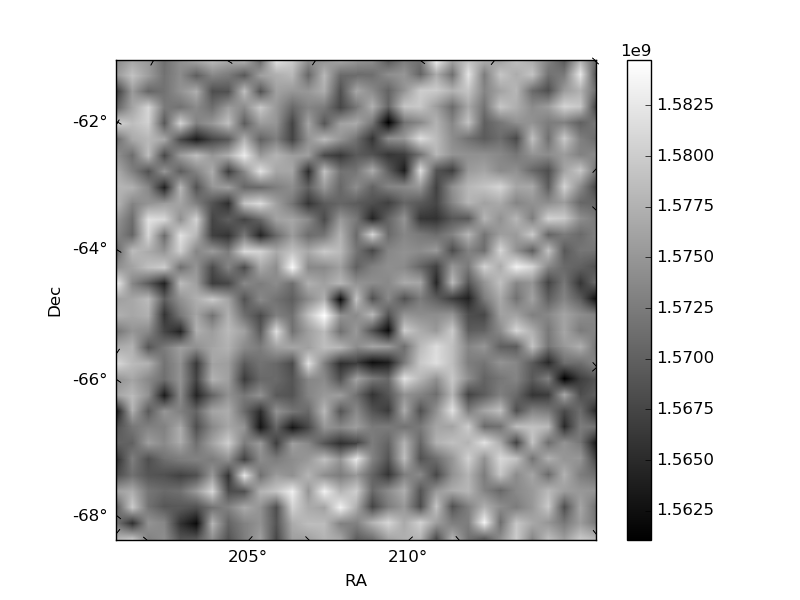
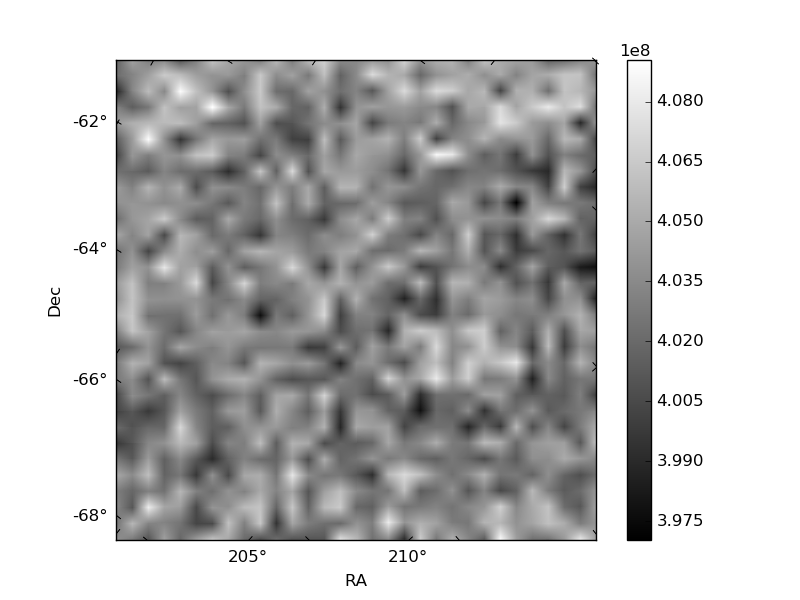
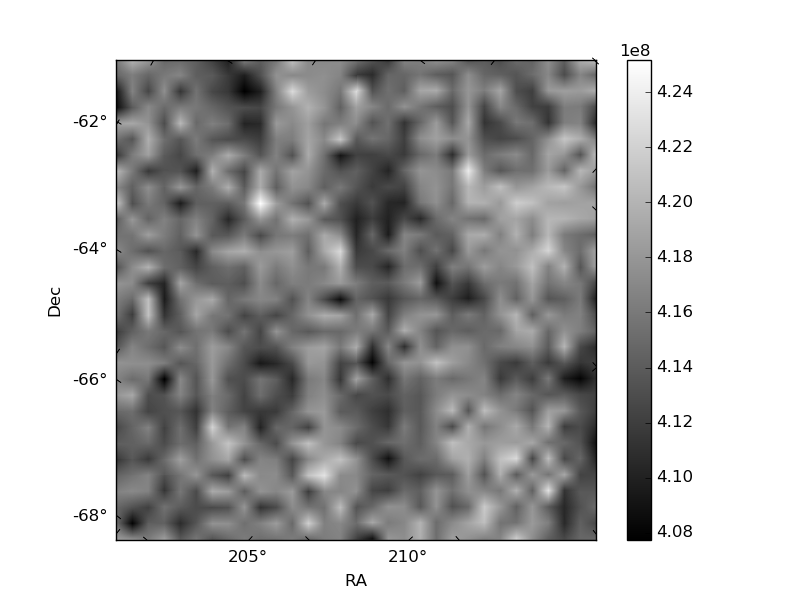
Histogram calculated using DETX and DETY for each event in the final _common_clean file
| Quadrant A |  |
 |
Quadrant B |
|---|---|---|---|
| Quadrant D | 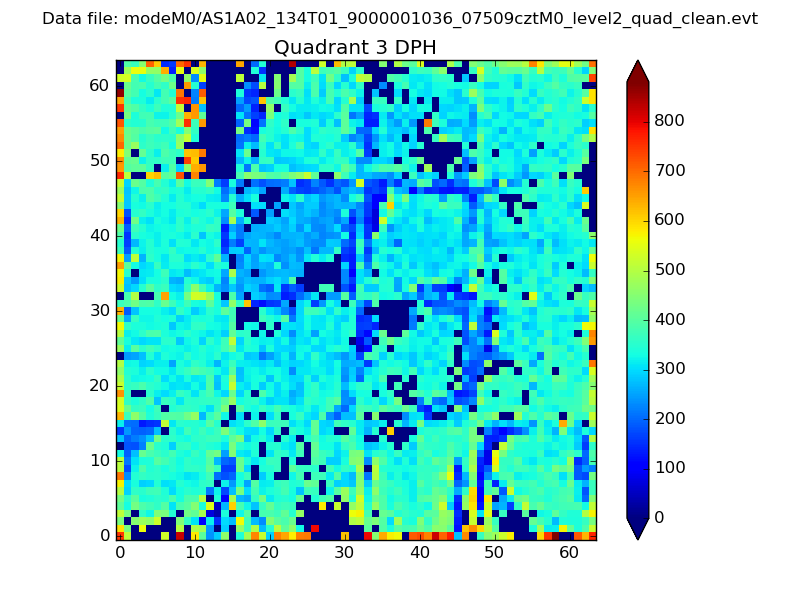 |
 |
Quadrant C |
| Plot type | Count rate plots | Images |
|---|---|---|
| Comparison with Poisson distribution Blue bars denote a histogram of data divided into 1 sec bins. Red curve is a Poisson curve with rate = median count rate of data. |
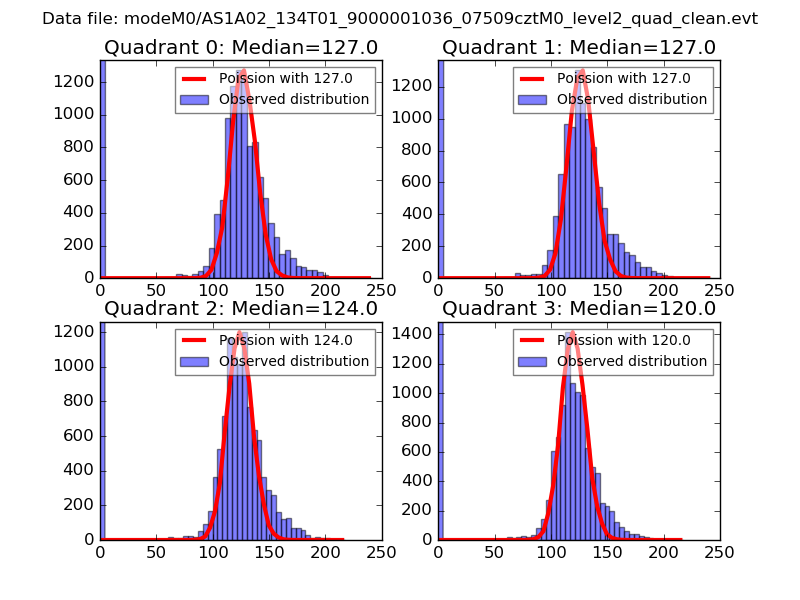 |
 |
| Quadrant-wise count rates Data is divided into 100 sec bins |
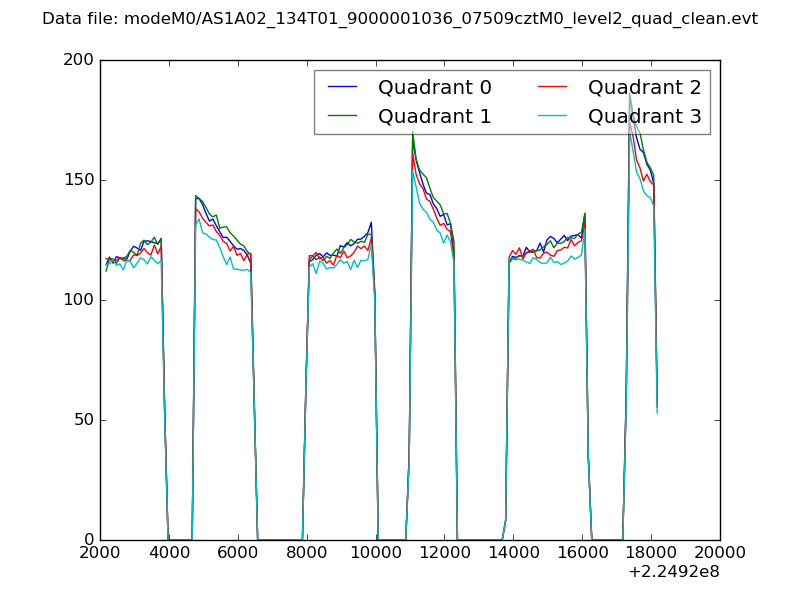 |
|
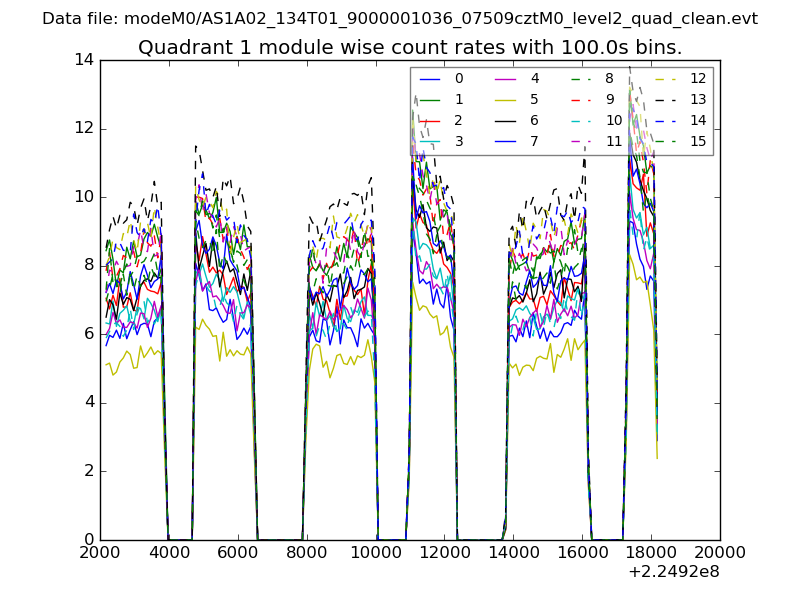
| Module-wise count rates for Quadrant A Data is divided into 100 sec bins |
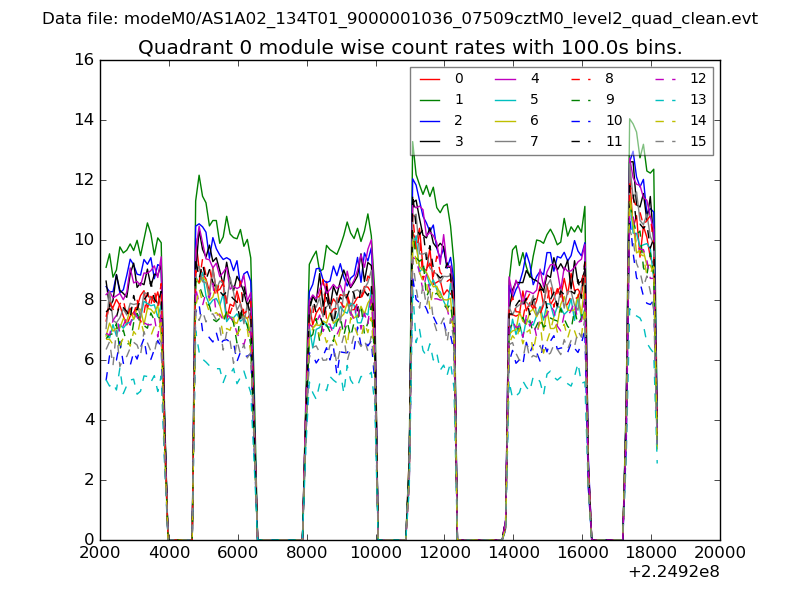 |
 |
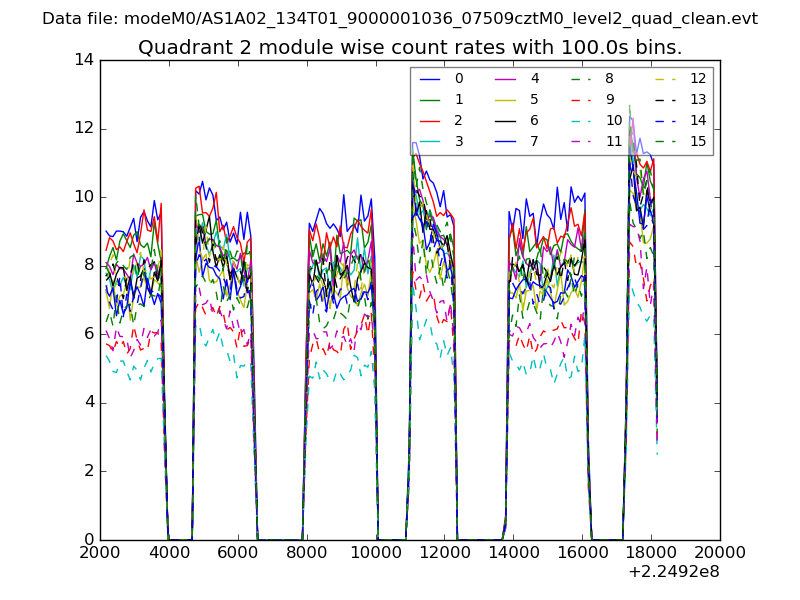
| Module-wise count rates for Quadrant B Data is divided into 100 sec bins |
 |
 |
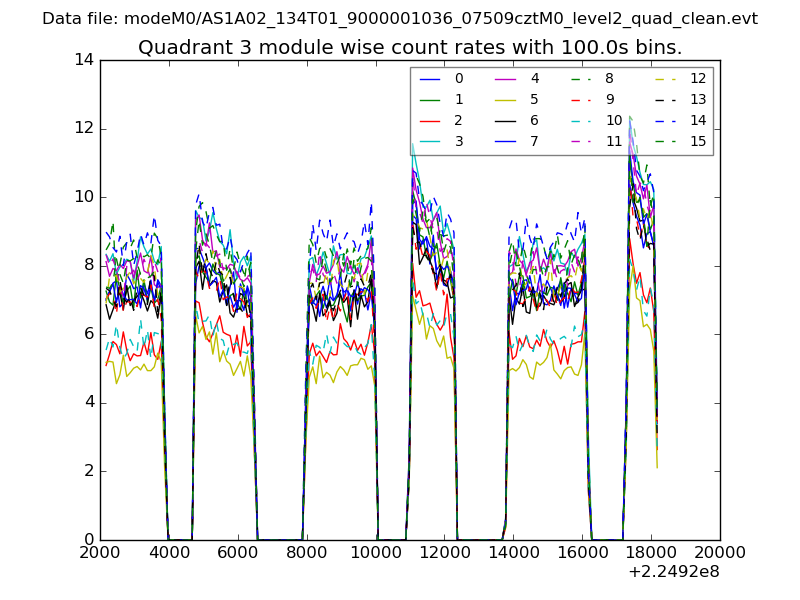
| Module-wise count rates for Quadrant C Data is divided into 100 sec bins |
 |
 |
| Module-wise count rates for Quadrant D Data is divided into 100 sec bins |
 |
 |
| Parameter | Plot |
|---|---|
| CZT HV Monitor | 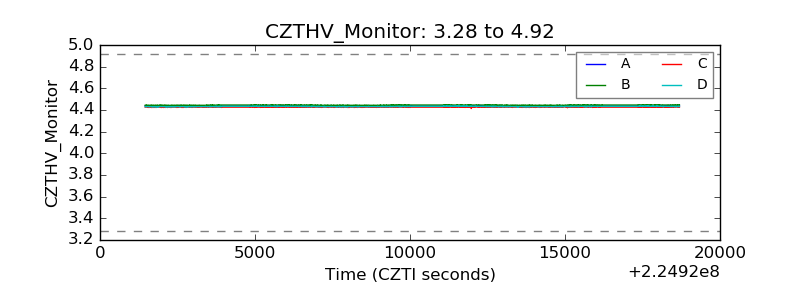 |
| D_VDD | 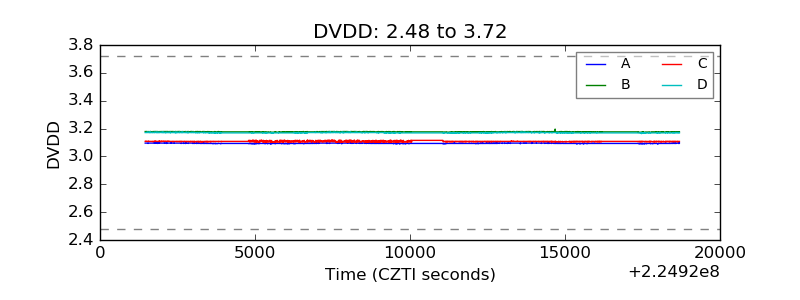 |
| Temperature 1 | 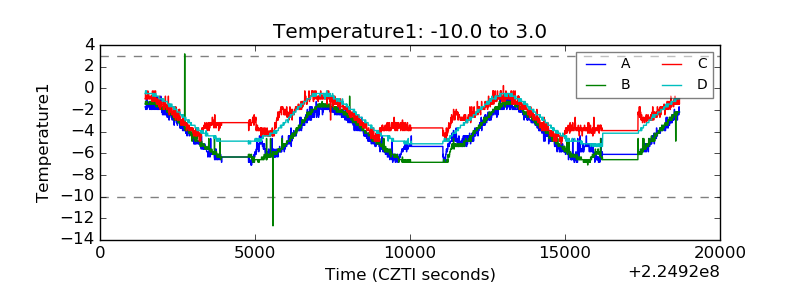 |
| Veto HV Monitor | 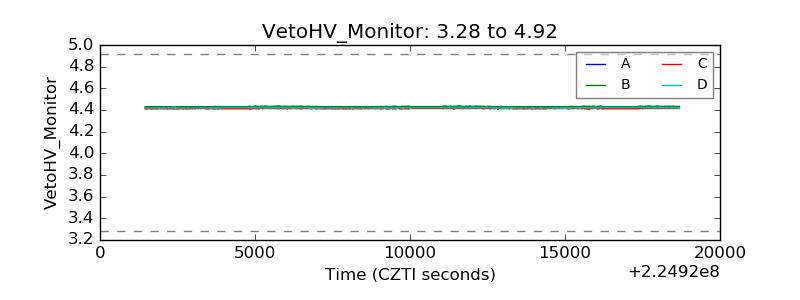 |
| Veto LLD | 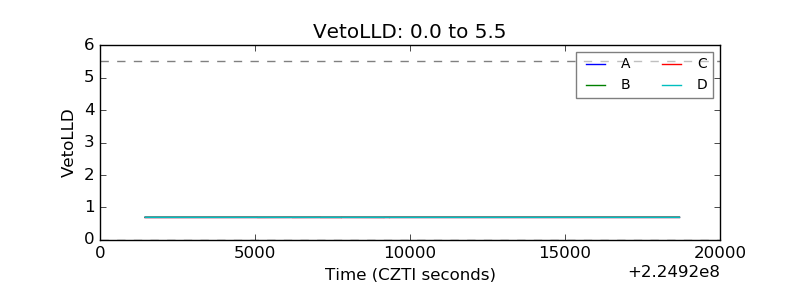 |
| Alpha Counter | 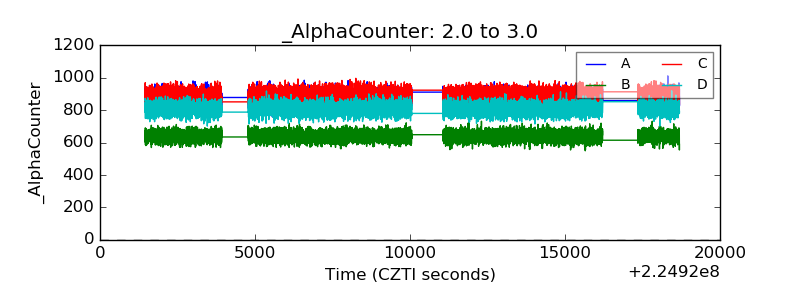 |
| _CPM_Rate | 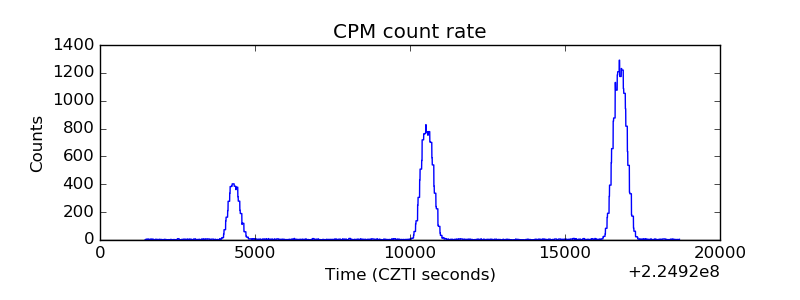 |
| CZT Counter | 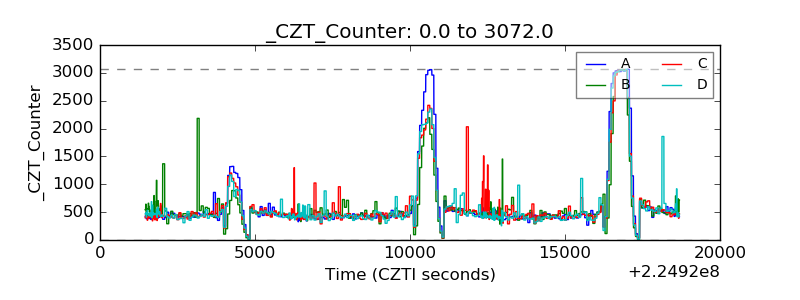 |
| +2.5 Volts monitor |  |
| +5 Volts monitor |  |
| _ROLL_ROT | 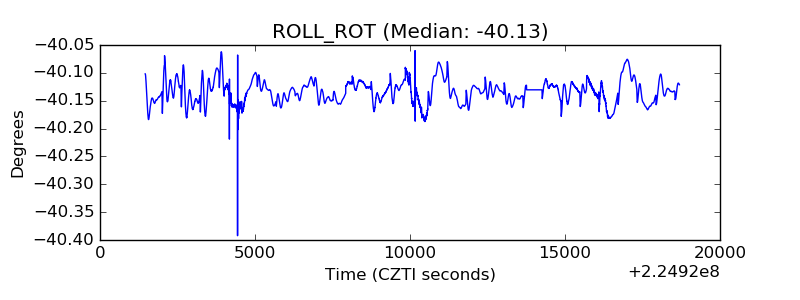 |
| _Roll_DEC | 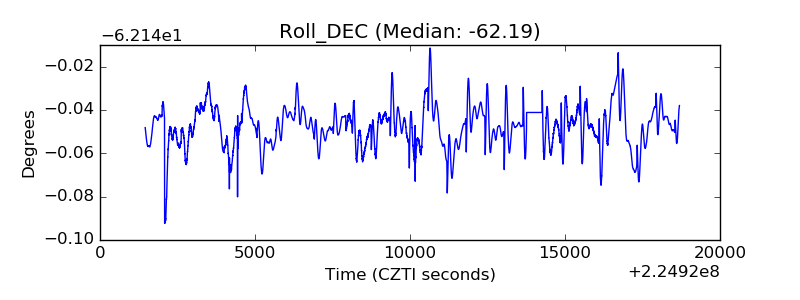 |
| _Roll_RA | 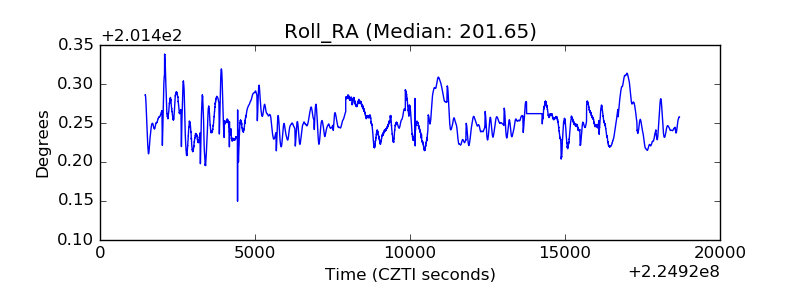 |
| Veto Counter | 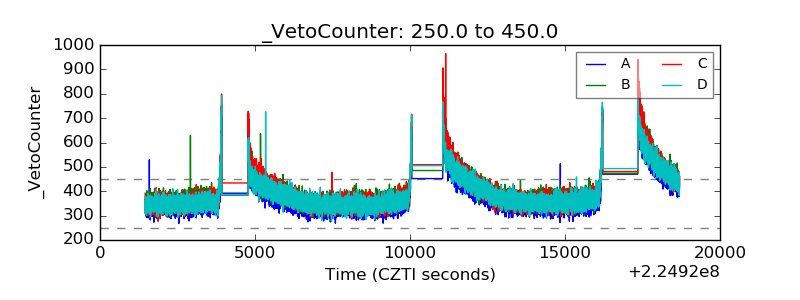 |