| Param | Original file | Final file |
|---|---|---|
| Filename | modeM0/AS1A02_134T01_9000001036_07510cztM0_level2.evt | modeM0/AS1A02_134T01_9000001036_07510cztM0_level2_quad_clean.evt |
| Size (bytes) | 468,360,000 | 83,298,240 |
| Size | 446.7 MB | 79.4 MB |
| Events in quadrant A | 3,152,369 | 529,478 |
| Events in quadrant B | 3,981,569 | 531,030 |
| Events in quadrant C | 3,167,380 | 514,635 |
| Events in quadrant D | 3,442,447 | 494,981 |
| Mode SS | |||
|---|---|---|---|
| Quadrant | BADHDUFLAG | Total packets | Discarded packets |
| A | 0 | 132 | 0 |
| B | 0 | 132 | 0 |
| C | 0 | 132 | 0 |
| D | 0 | 132 | 0 |
| Mode M0 | |||
|---|---|---|---|
| Quadrant | BADHDUFLAG | Total packets | Discarded packets |
| A | 0 | 13627 | 2 |
| B | 0 | 16013 | 1 |
| C | 0 | 13814 | 1 |
| D | 0 | 14498 | 1 |
| Mode M9 | |||
|---|---|---|---|
| Quadrant | BADHDUFLAG | Total packets | Discarded packets |
| A | 0 | 12 | 0 |
| B | 0 | 12 | 0 |
| C | 0 | 12 | 0 |
| D | 0 | 12 | 0 |
| Quadrant | Total seconds | Saturated seconds | Saturation percentage |
|---|---|---|---|
| A | 6485 | 83 | 1.279877% |
| B | 6485 | 160 | 2.467232% |
| C | 6485 | 74 | 1.141095% |
| D | 6485 | 121 | 1.865844% |
Noise dominated data is calculated using 1-second bins in cleaned event files. If a bin has >2000 counts, and if more than 50% of those come from <1% of pixels, then it is considered to be noise-dominated and hence unusable.
| Quadrant | # 1 sec bins | Bins with >0 counts | Bins with >2000 counts | High rate bins dominated by noise | Noise dominated (total time) | Noise dominated (detector-on time) | Marked lightcurve |
|---|---|---|---|---|---|---|---|
| A | 7685 | 6485 | 0 | 0 | 0.00% | 0.00% | 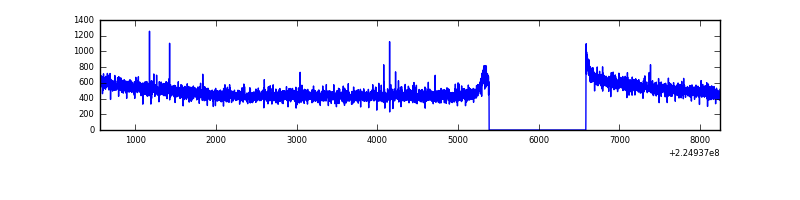 |
| B | 7685 | 6485 | 54 | 54 | 0.70% | 0.83% | 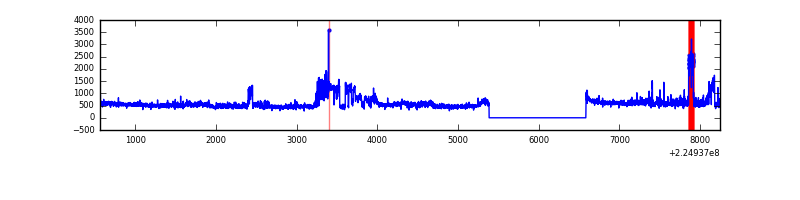 |
| C | 7685 | 6485 | 6 | 6 | 0.08% | 0.09% | 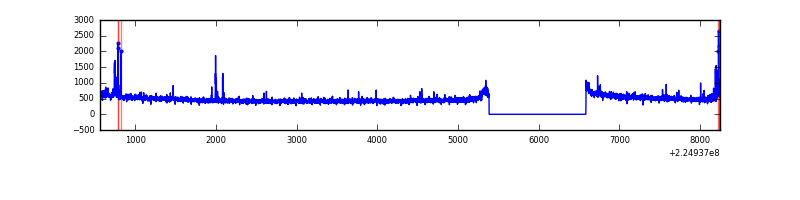 |
| D | 7685 | 6485 | 35 | 35 | 0.46% | 0.54% | 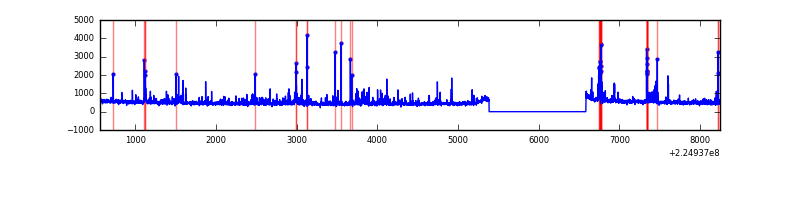 |
Top three noisy pixels from each quadrant. If the there are fewer than three noisy pixels in the level2.evt file, extra rows are filled as -1
| Pixel properties | Quadrant properties | ||||||
|---|---|---|---|---|---|---|---|
| Quadrant | DetID | PixID | Counts | Sigma | Mean | Median | Sigma |
| A | 13 | 14 | 11782 | 68.18 | 814 | 799 | 161.1 |
| A | 0 | 226 | 7912 | 44.15 | 814 | 799 | 161.1 |
| A | 12 | 194 | 7522 | 41.73 | 814 | 799 | 161.1 |
| B | 0 | 187 | 631025 | 4221.6 | 807 | 788 | 149.3 |
| B | 0 | 214 | 122962 | 818.37 | 807 | 788 | 149.3 |
| B | 0 | 219 | 64432 | 426.31 | 807 | 788 | 149.3 |
| C | 1 | 16 | 59723 | 331.87 | 779 | 783 | 177.6 |
| C | 9 | 68 | 46946 | 259.93 | 779 | 783 | 177.6 |
| C | 8 | 229 | 16310 | 87.43 | 779 | 783 | 177.6 |
| D | 2 | 152 | 148630 | 786.43 | 785 | 762 | 188.0 |
| D | 14 | 34 | 101668 | 536.67 | 785 | 762 | 188.0 |
| D | 2 | 136 | 69075 | 363.32 | 785 | 762 | 188.0 |
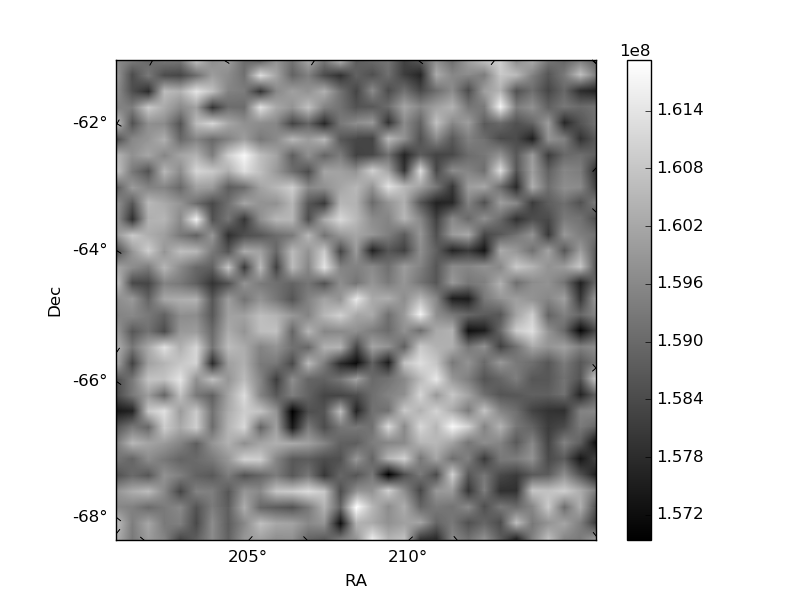
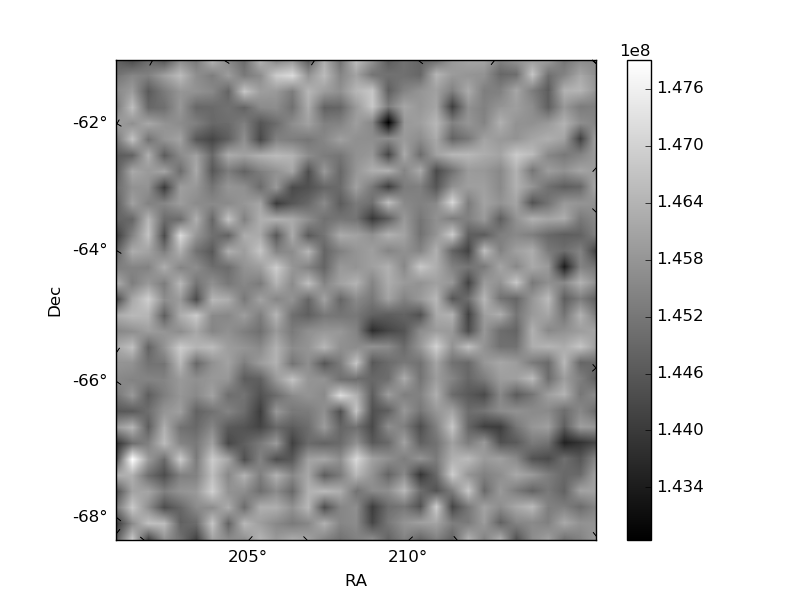
Histogram calculated using DETX and DETY for each event in the final _common_clean file
| Quadrant A | 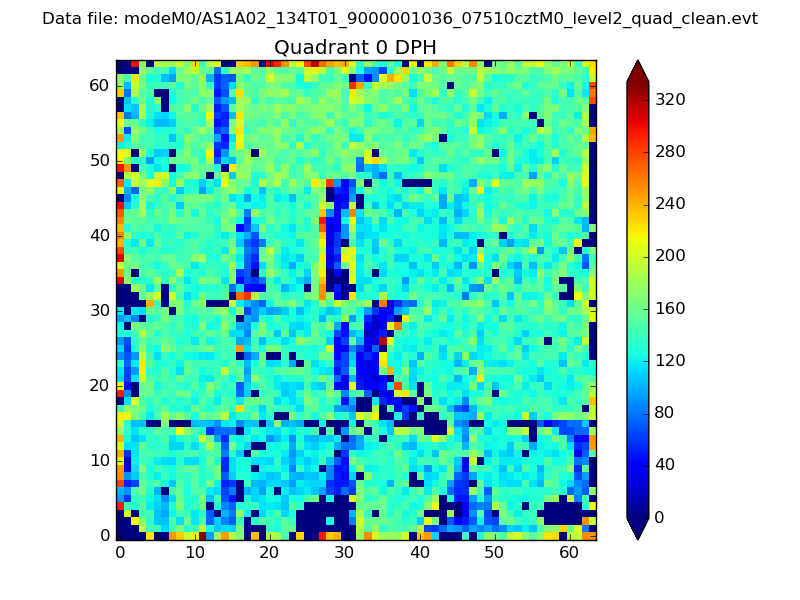 |
 |
Quadrant B |
|---|---|---|---|
| Quadrant D | 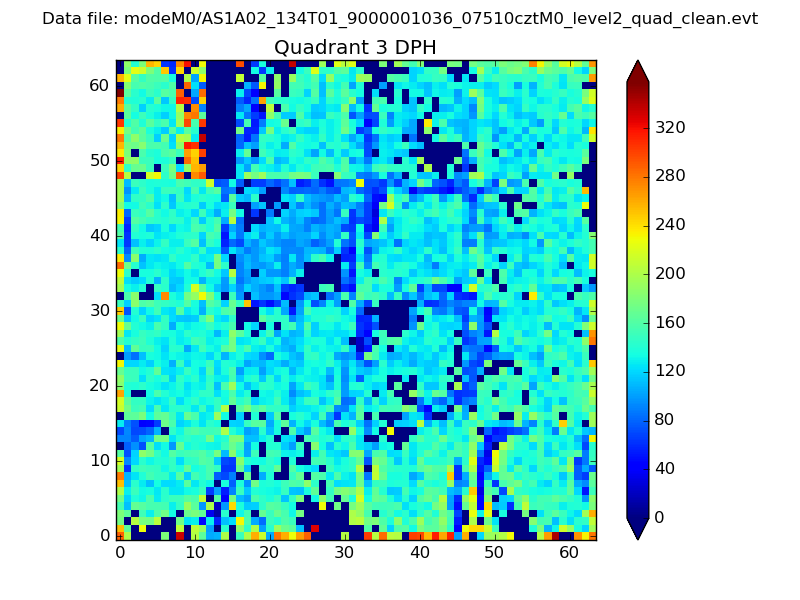 |
 |
Quadrant C |
| Plot type | Count rate plots | Images |
|---|---|---|
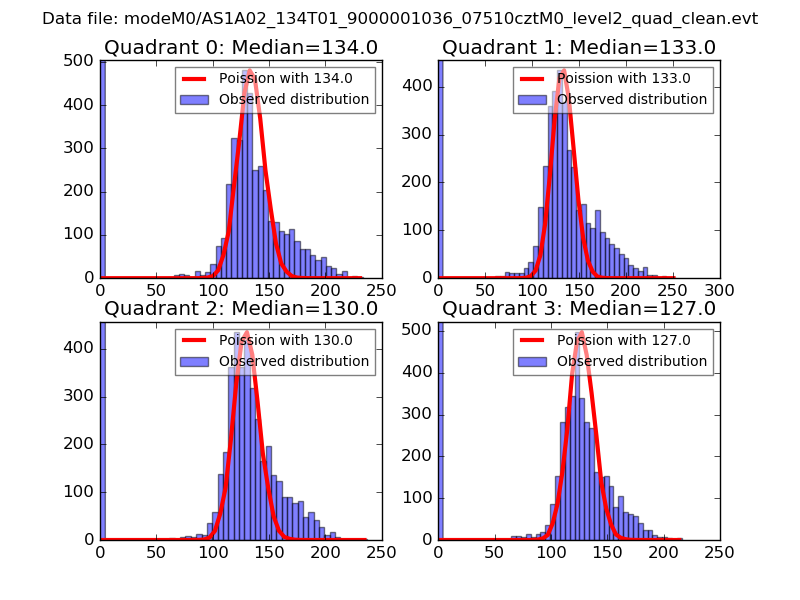
| Comparison with Poisson distribution Blue bars denote a histogram of data divided into 1 sec bins. Red curve is a Poisson curve with rate = median count rate of data. |
 |
 |
| Quadrant-wise count rates Data is divided into 100 sec bins |
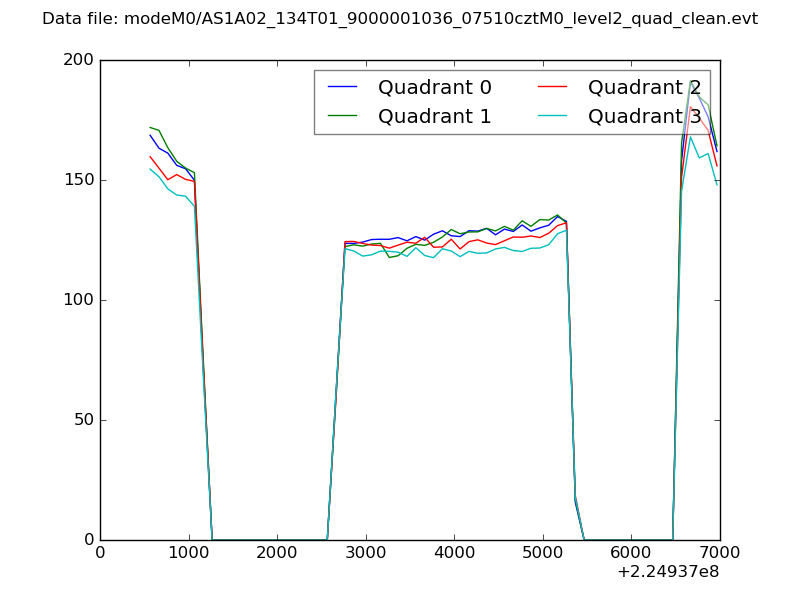 |
|
| Module-wise count rates for Quadrant A Data is divided into 100 sec bins |
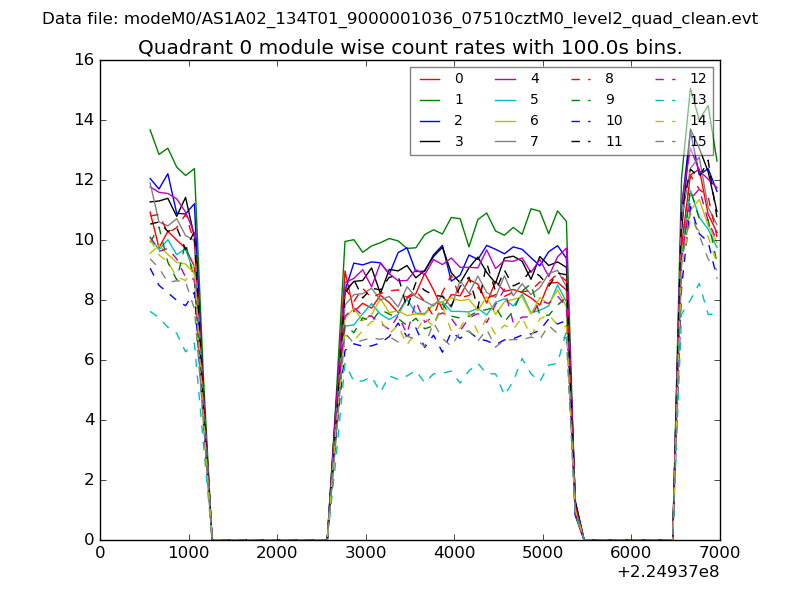 |
 |
| Module-wise count rates for Quadrant B Data is divided into 100 sec bins |
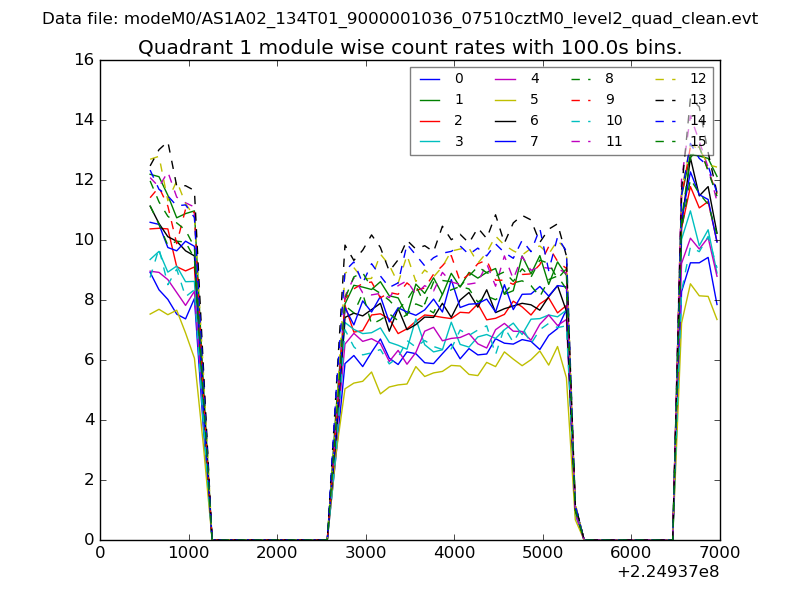 |
 |
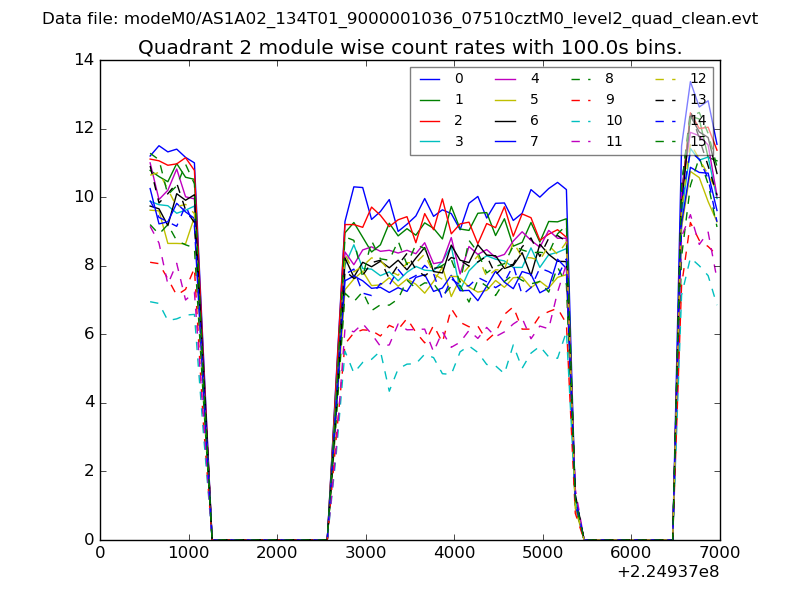
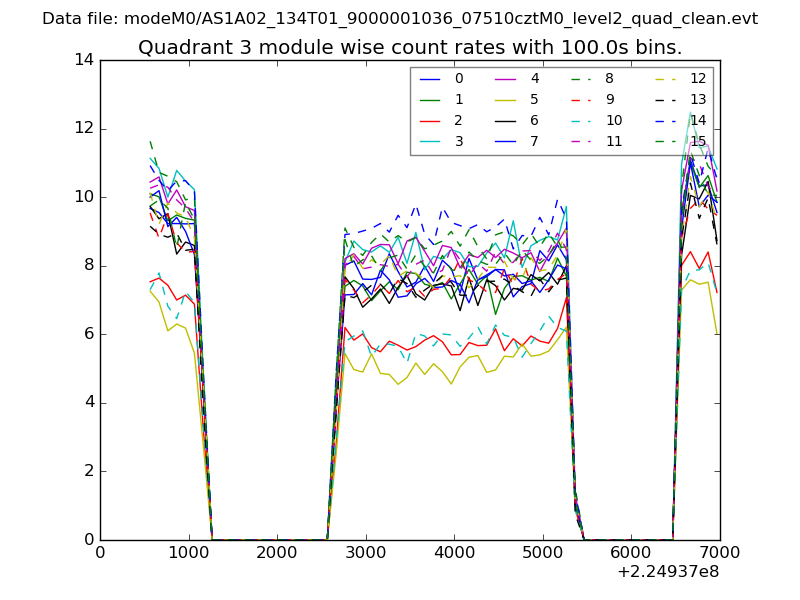
| Module-wise count rates for Quadrant C Data is divided into 100 sec bins |
 |
 |
| Module-wise count rates for Quadrant D Data is divided into 100 sec bins |
 |
 |
| Parameter | Plot |
|---|---|
| CZT HV Monitor | 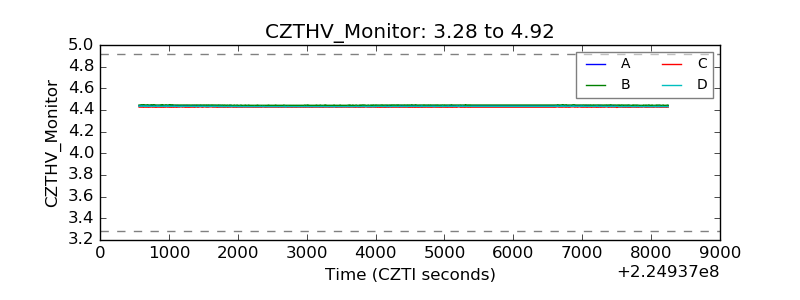 |
| D_VDD | 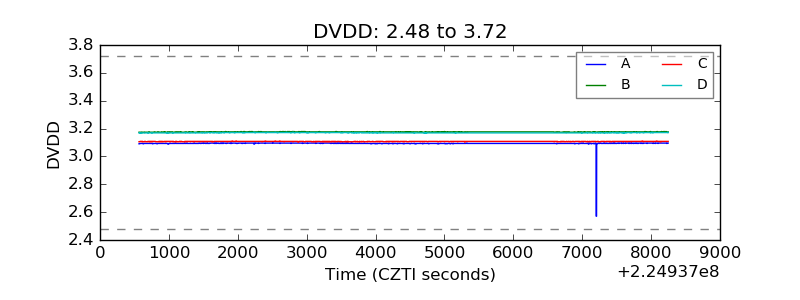 |
| Temperature 1 |  |
| Veto HV Monitor | 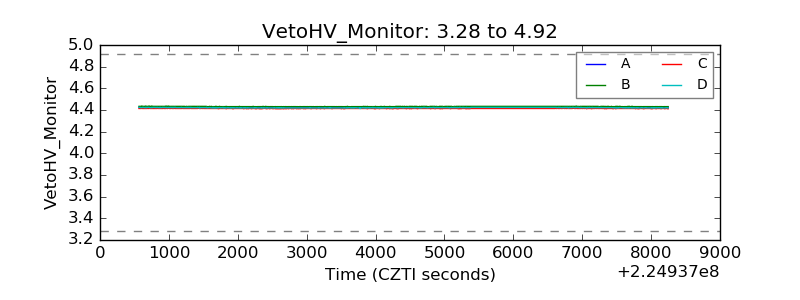 |
| Veto LLD |  |
| Alpha Counter | 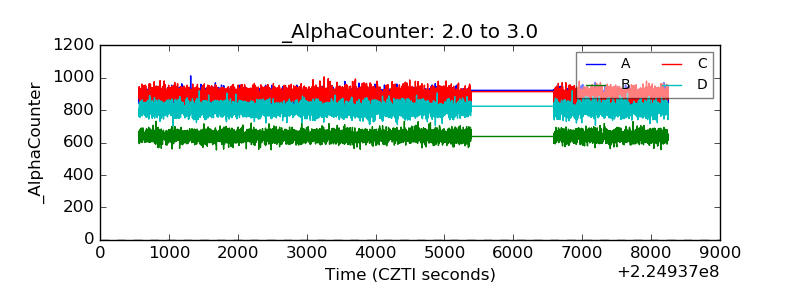 |
| _CPM_Rate | 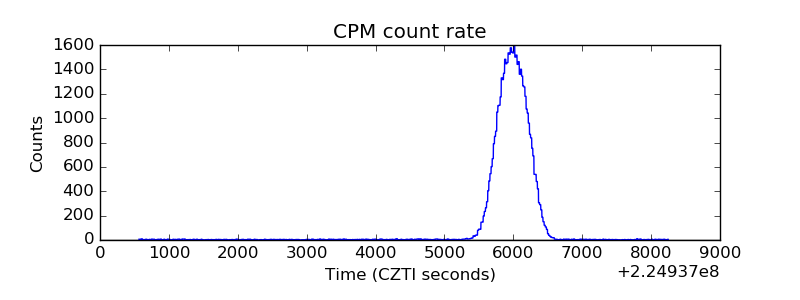 |
| CZT Counter | 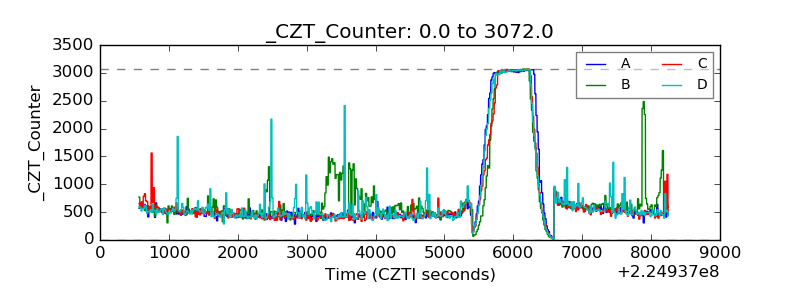 |
| +2.5 Volts monitor |  |
| +5 Volts monitor | 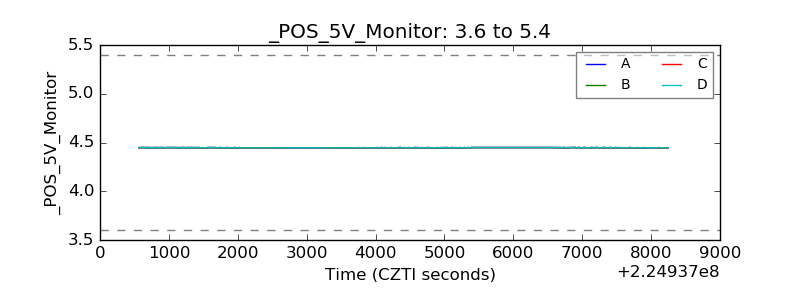 |
| _ROLL_ROT | 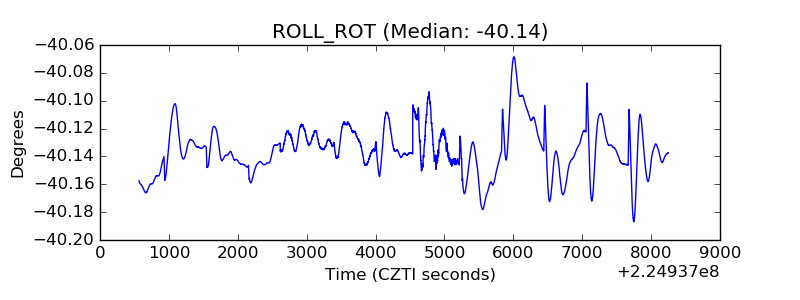 |
| _Roll_DEC | 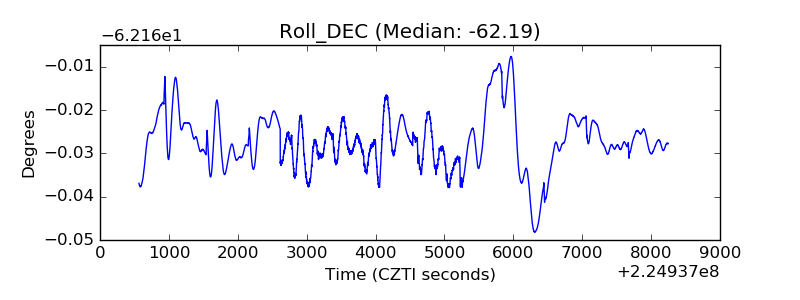 |
| _Roll_RA |  |
| Veto Counter | 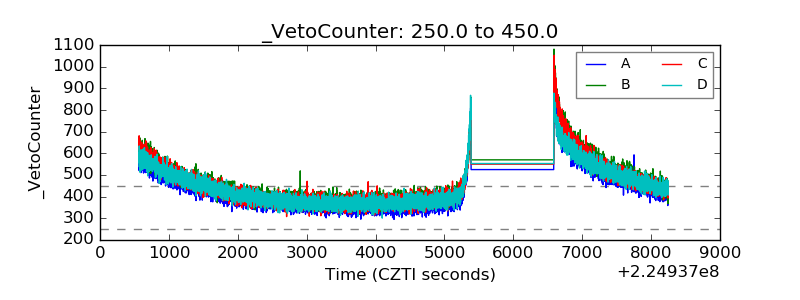 |