| Param | Original file | Final file |
|---|---|---|
| Filename | modeM0/AS1A02_134T01_9000001036_07511cztM0_level2.evt | modeM0/AS1A02_134T01_9000001036_07511cztM0_level2_quad_clean.evt |
| Size (bytes) | 531,892,800 | 77,097,600 |
| Size | 507.3 MB | 73.5 MB |
| Events in quadrant A | 3,241,486 | 487,623 |
| Events in quadrant B | 4,004,609 | 490,040 |
| Events in quadrant C | 5,007,019 | 448,519 |
| Events in quadrant D | 3,413,087 | 453,581 |
| Mode SS | |||
|---|---|---|---|
| Quadrant | BADHDUFLAG | Total packets | Discarded packets |
| A | 0 | 132 | 0 |
| B | 0 | 132 | 0 |
| C | 0 | 132 | 0 |
| D | 0 | 132 | 0 |
| Mode M0 | |||
|---|---|---|---|
| Quadrant | BADHDUFLAG | Total packets | Discarded packets |
| A | 0 | 13882 | 2 |
| B | 0 | 16299 | 1 |
| C | 0 | 19257 | 1 |
| D | 0 | 14584 | 1 |
| Mode M9 | |||
|---|---|---|---|
| Quadrant | BADHDUFLAG | Total packets | Discarded packets |
| A | 0 | 13 | 0 |
| B | 0 | 13 | 0 |
| C | 0 | 13 | 0 |
| D | 0 | 13 | 0 |
| Quadrant | Total seconds | Saturated seconds | Saturation percentage |
|---|---|---|---|
| A | 6518 | 87 | 1.334765% |
| B | 6518 | 223 | 3.421295% |
| C | 6518 | 504 | 7.732433% |
| D | 6518 | 129 | 1.979135% |
Noise dominated data is calculated using 1-second bins in cleaned event files. If a bin has >2000 counts, and if more than 50% of those come from <1% of pixels, then it is considered to be noise-dominated and hence unusable.
| Quadrant | # 1 sec bins | Bins with >0 counts | Bins with >2000 counts | High rate bins dominated by noise | Noise dominated (total time) | Noise dominated (detector-on time) | Marked lightcurve |
|---|---|---|---|---|---|---|---|
| A | 7783 | 6518 | 0 | 0 | 0.00% | 0.00% | 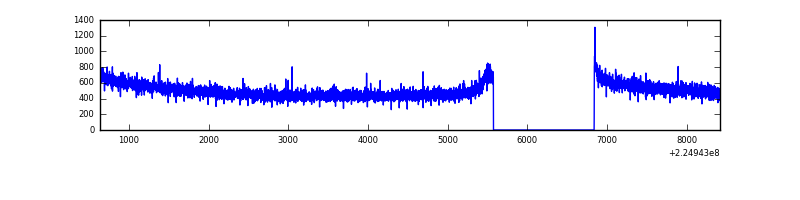 |
| B | 7783 | 6518 | 94 | 94 | 1.21% | 1.44% | 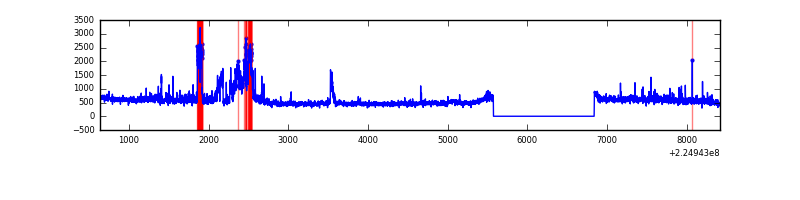 |
| C | 7783 | 6518 | 319 | 319 | 4.10% | 4.89% | 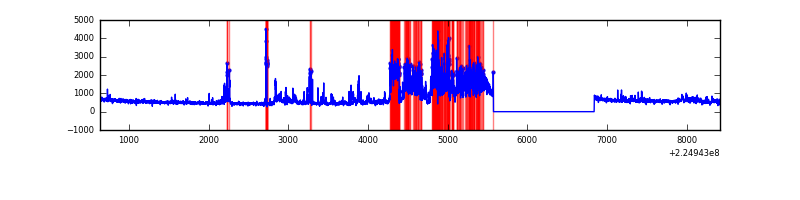 |
| D | 7783 | 6518 | 38 | 38 | 0.49% | 0.58% | 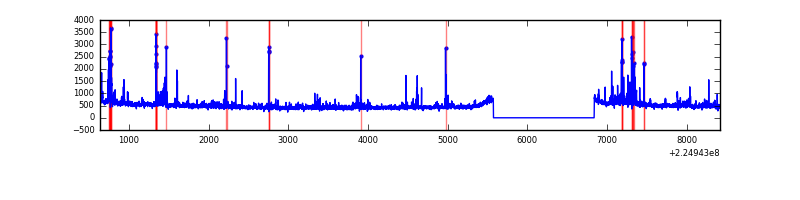 |
Top three noisy pixels from each quadrant. If the there are fewer than three noisy pixels in the level2.evt file, extra rows are filled as -1
| Pixel properties | Quadrant properties | ||||||
|---|---|---|---|---|---|---|---|
| Quadrant | DetID | PixID | Counts | Sigma | Mean | Median | Sigma |
| A | 13 | 14 | 11396 | 63.3 | 838 | 822 | 167.1 |
| A | 0 | 226 | 8033 | 43.17 | 838 | 822 | 167.1 |
| A | 12 | 194 | 7653 | 40.89 | 838 | 822 | 167.1 |
| B | 0 | 187 | 514500 | 3360.69 | 833 | 816 | 152.9 |
| B | 0 | 214 | 185383 | 1207.5 | 833 | 816 | 152.9 |
| B | 0 | 219 | 57305 | 369.57 | 833 | 816 | 152.9 |
| C | 9 | 68 | 1775658 | 9950.17 | 785 | 788 | 178.4 |
| C | 1 | 16 | 113722 | 633.12 | 785 | 788 | 178.4 |
| C | 8 | 229 | 48911 | 269.78 | 785 | 788 | 178.4 |
| D | 2 | 152 | 124574 | 636.06 | 806 | 782 | 194.6 |
| D | 1 | 52 | 68141 | 346.1 | 806 | 782 | 194.6 |
| D | 2 | 14 | 64717 | 328.51 | 806 | 782 | 194.6 |
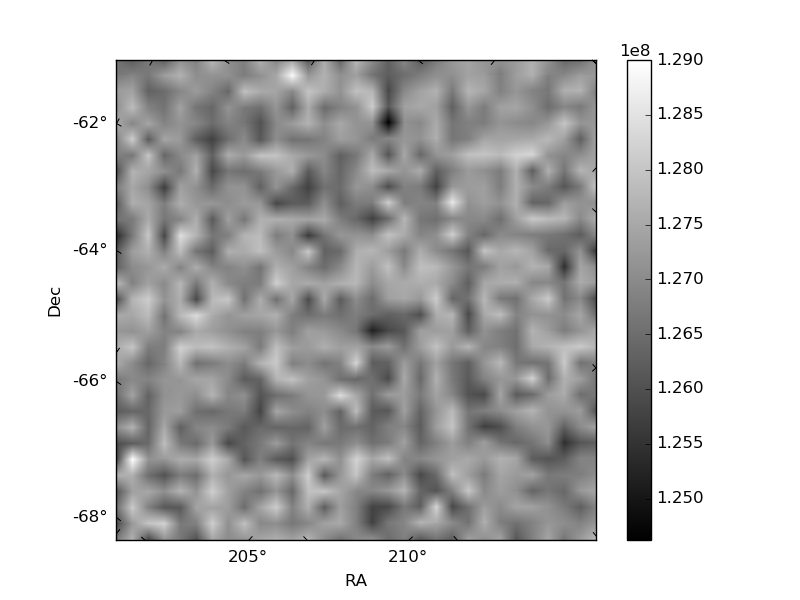
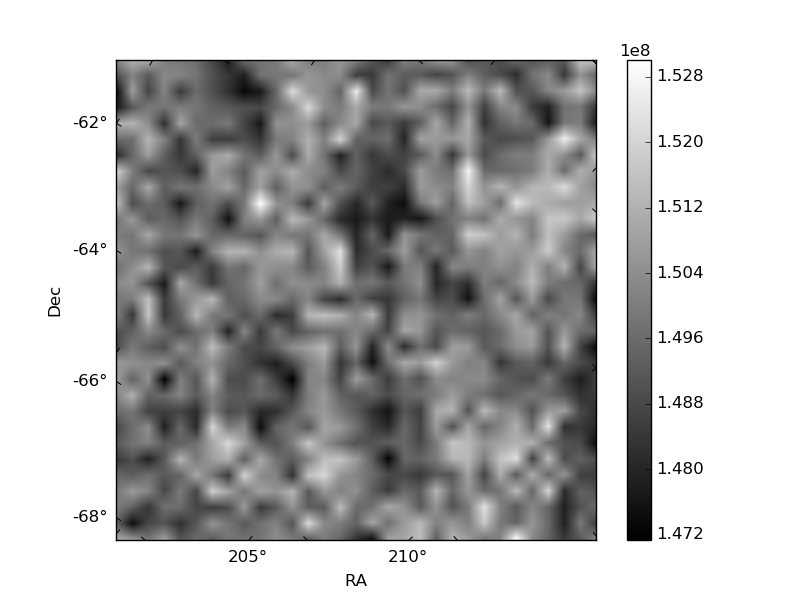
Histogram calculated using DETX and DETY for each event in the final _common_clean file
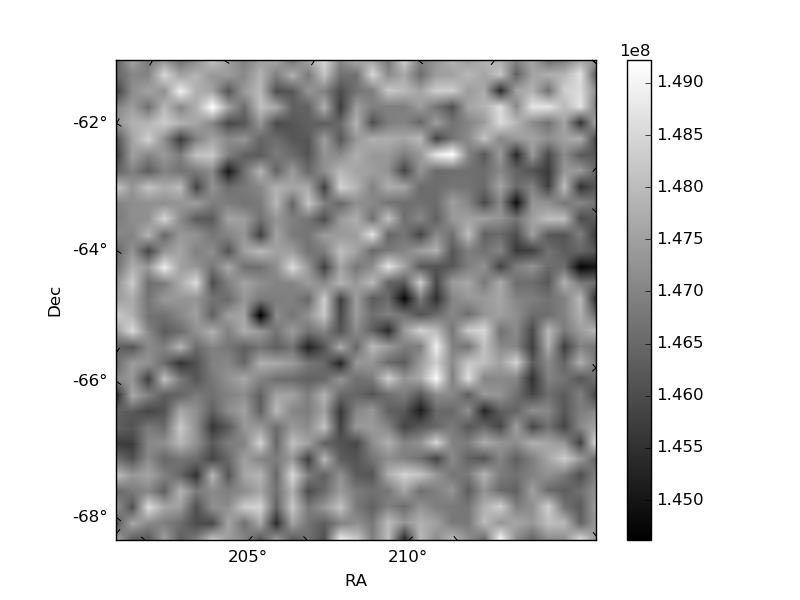
| Quadrant A |  |
 |
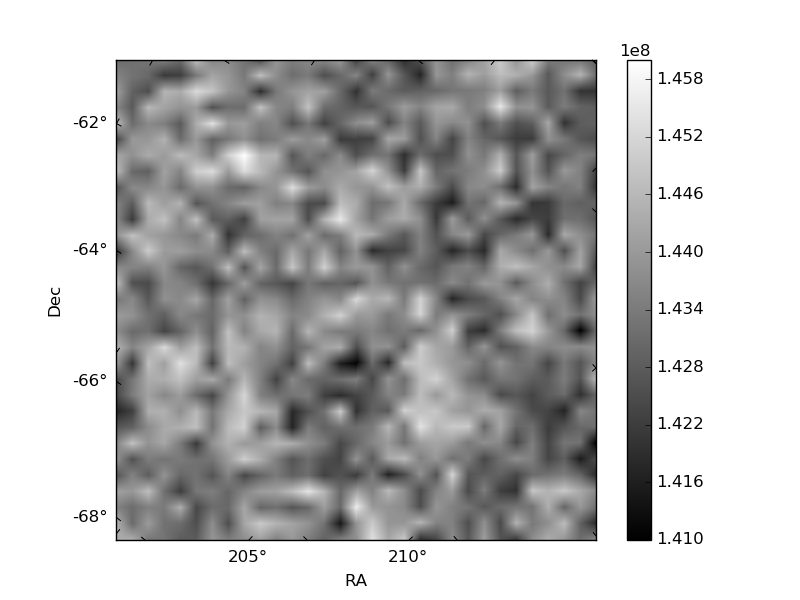
Quadrant B |
|---|---|---|---|
| Quadrant D | 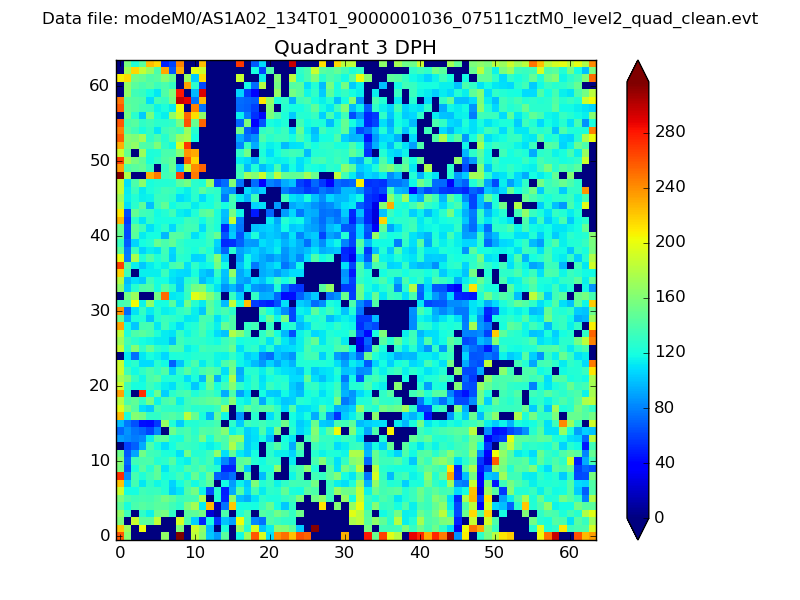 |
 |
Quadrant C |
| Plot type | Count rate plots | Images |
|---|---|---|
| Comparison with Poisson distribution Blue bars denote a histogram of data divided into 1 sec bins. Red curve is a Poisson curve with rate = median count rate of data. |
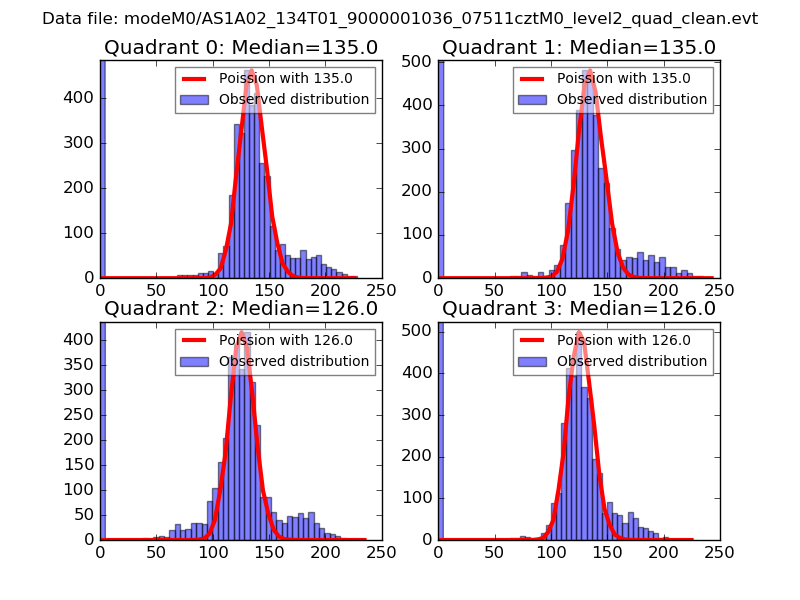 |
 |
| Quadrant-wise count rates Data is divided into 100 sec bins |
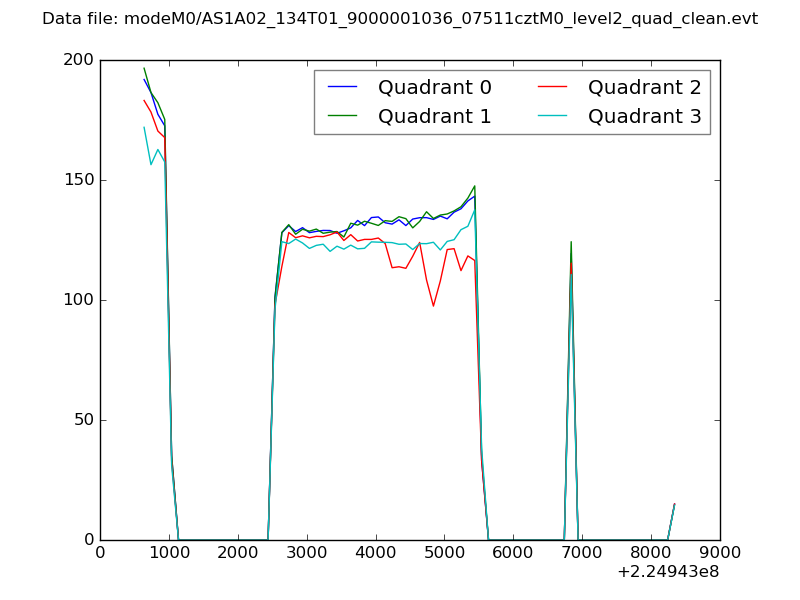 |
|
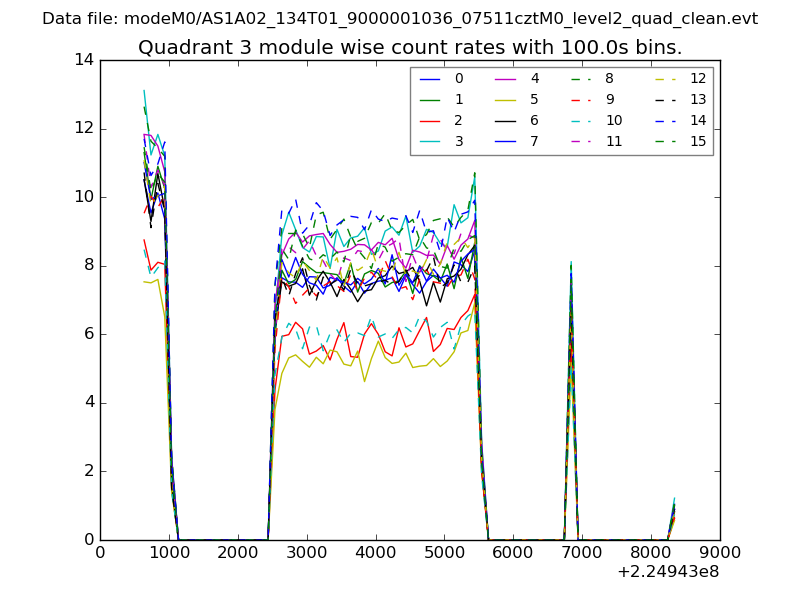
| Module-wise count rates for Quadrant A Data is divided into 100 sec bins |
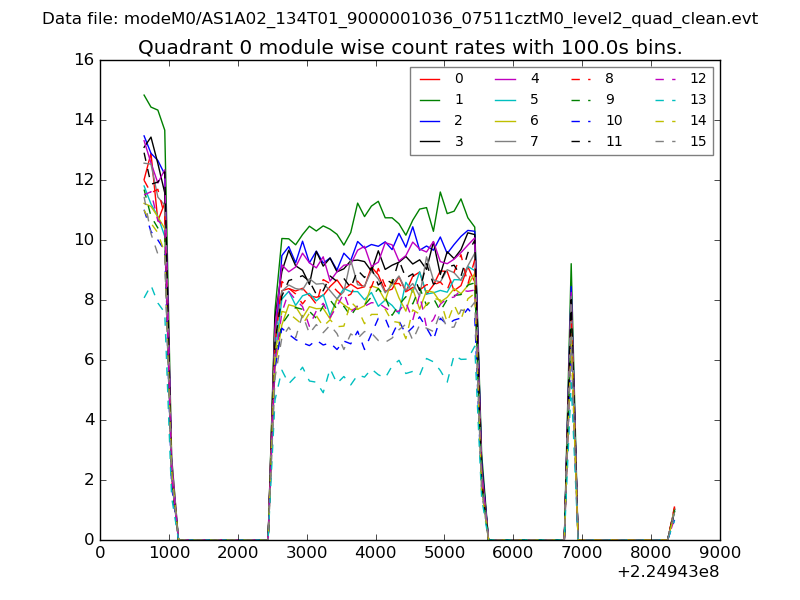 |
 |
| Module-wise count rates for Quadrant B Data is divided into 100 sec bins |
 |
 |
| Module-wise count rates for Quadrant C Data is divided into 100 sec bins |
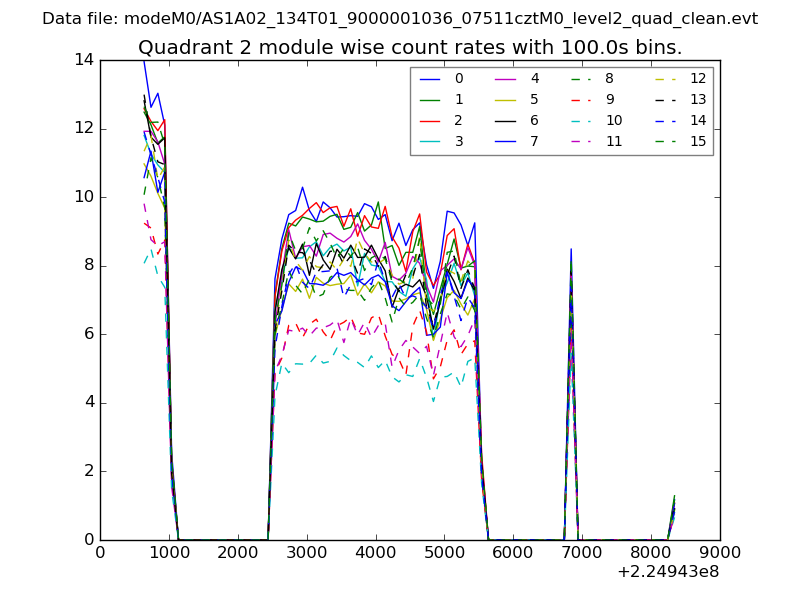 |
 |
| Module-wise count rates for Quadrant D Data is divided into 100 sec bins |
 |
 |
| Parameter | Plot |
|---|---|
| CZT HV Monitor |  |
| D_VDD | 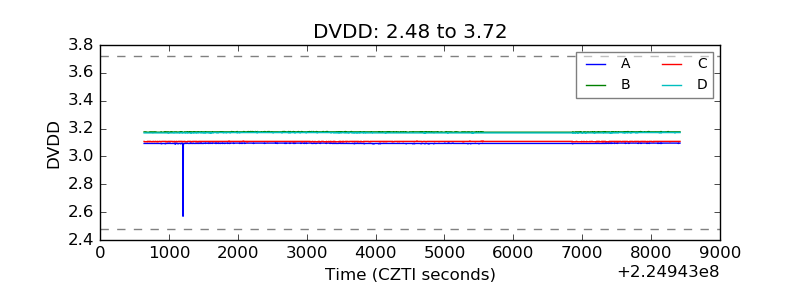 |
| Temperature 1 | 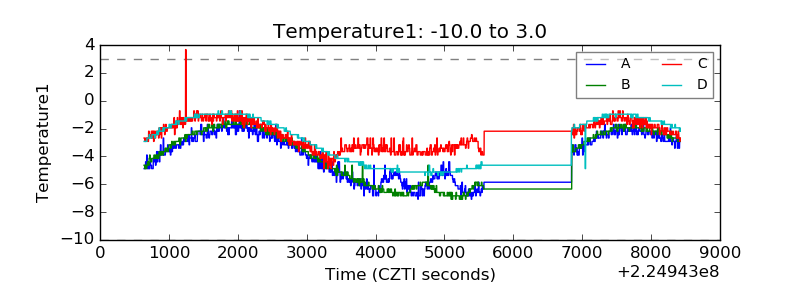 |
| Veto HV Monitor | 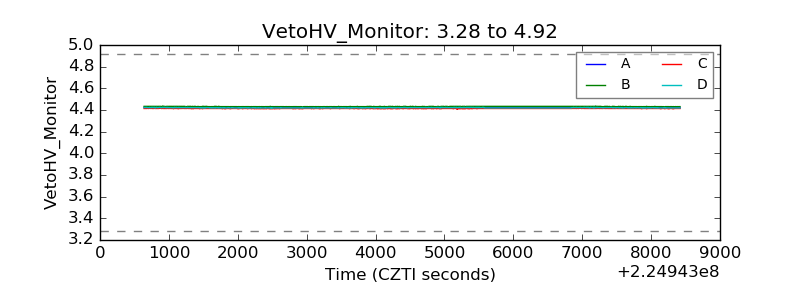 |
| Veto LLD | 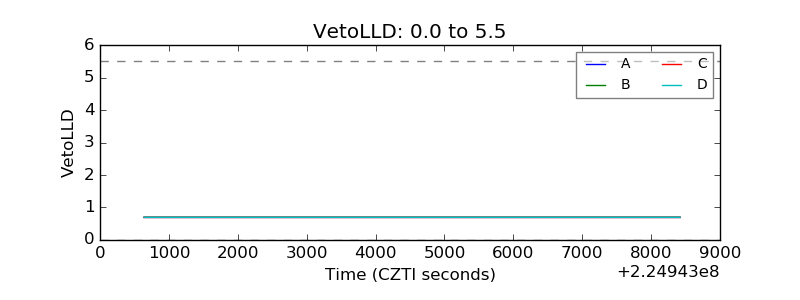 |
| Alpha Counter | 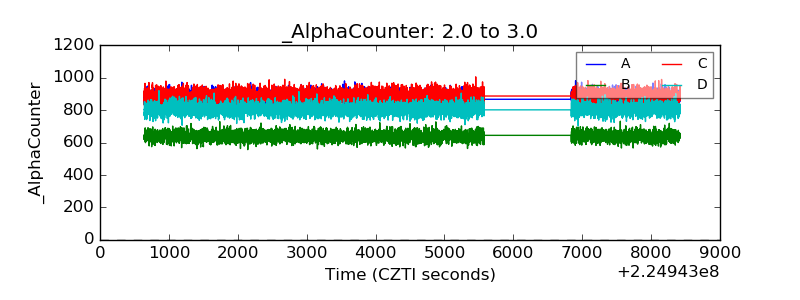 |
| _CPM_Rate | 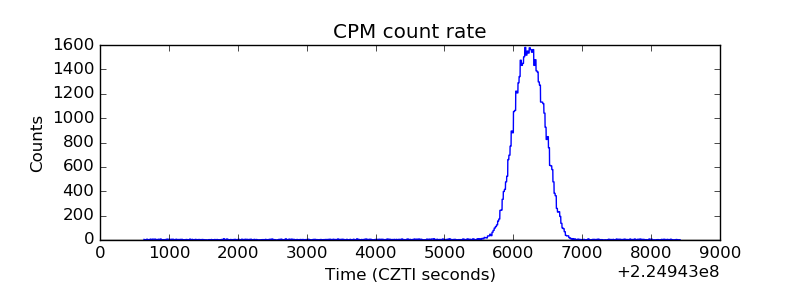 |
| CZT Counter | 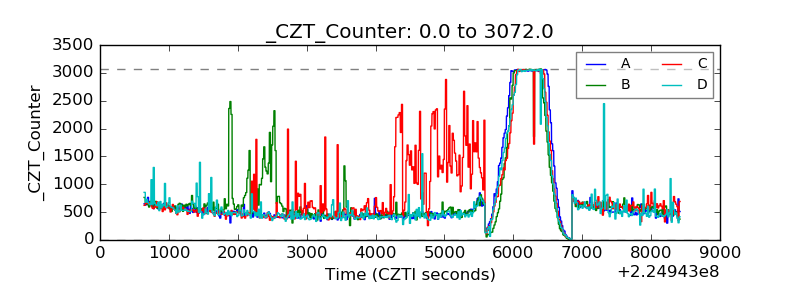 |
| +2.5 Volts monitor |  |
| +5 Volts monitor | 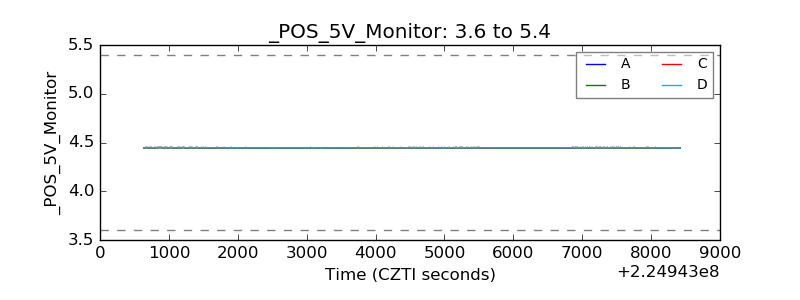 |
| _ROLL_ROT | 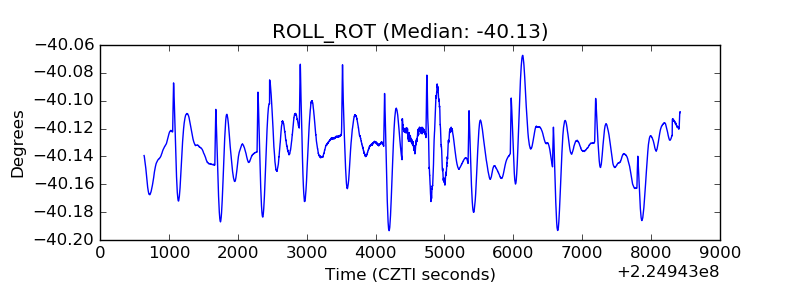 |
| _Roll_DEC | 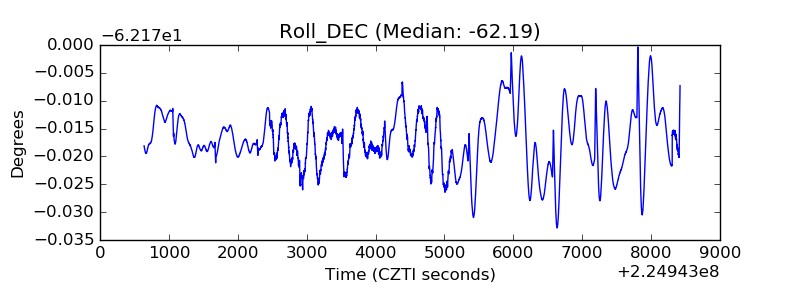 |
| _Roll_RA | 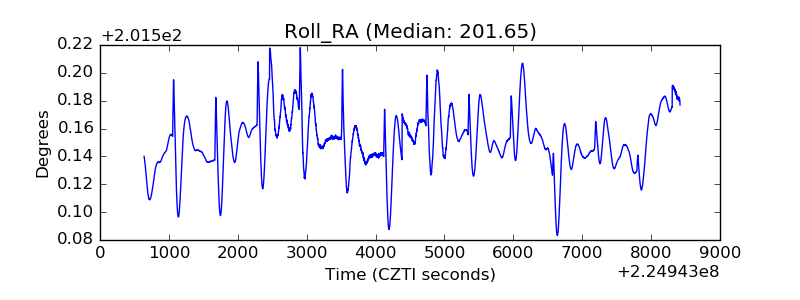 |
| Veto Counter | 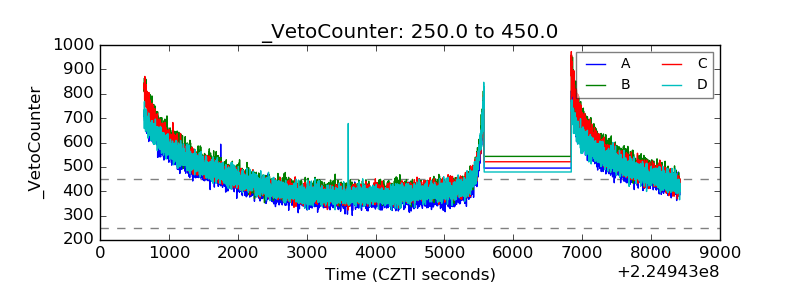 |