| Param | Original file | Final file |
|---|---|---|
| Filename | modeM0/AS1A02_134T01_9000001036_07512cztM0_level2.evt | modeM0/AS1A02_134T01_9000001036_07512cztM0_level2_quad_clean.evt |
| Size (bytes) | 466,024,320 | 79,793,280 |
| Size | 444.4 MB | 76.1 MB |
| Events in quadrant A | 3,169,693 | 503,822 |
| Events in quadrant B | 3,338,764 | 507,674 |
| Events in quadrant C | 3,712,698 | 485,853 |
| Events in quadrant D | 3,455,123 | 469,645 |
| Mode SS | |||
|---|---|---|---|
| Quadrant | BADHDUFLAG | Total packets | Discarded packets |
| A | 0 | 132 | 0 |
| B | 0 | 132 | 0 |
| C | 0 | 132 | 0 |
| D | 0 | 132 | 0 |
| Mode M0 | |||
|---|---|---|---|
| Quadrant | BADHDUFLAG | Total packets | Discarded packets |
| A | 0 | 13563 | 3 |
| B | 0 | 14203 | 2 |
| C | 0 | 15309 | 2 |
| D | 0 | 14704 | 2 |
| Mode M9 | |||
|---|---|---|---|
| Quadrant | BADHDUFLAG | Total packets | Discarded packets |
| A | 0 | 14 | 0 |
| B | 0 | 14 | 0 |
| C | 0 | 14 | 0 |
| D | 0 | 15 | 0 |
| Quadrant | Total seconds | Saturated seconds | Saturation percentage |
|---|---|---|---|
| A | 6435 | 101 | 1.569542% |
| B | 6435 | 104 | 1.616162% |
| C | 6435 | 77 | 1.196581% |
| D | 6435 | 161 | 2.501943% |
Noise dominated data is calculated using 1-second bins in cleaned event files. If a bin has >2000 counts, and if more than 50% of those come from <1% of pixels, then it is considered to be noise-dominated and hence unusable.
| Quadrant | # 1 sec bins | Bins with >0 counts | Bins with >2000 counts | High rate bins dominated by noise | Noise dominated (total time) | Noise dominated (detector-on time) | Marked lightcurve |
|---|---|---|---|---|---|---|---|
| A | 7695 | 6435 | 0 | 0 | 0.00% | 0.00% | 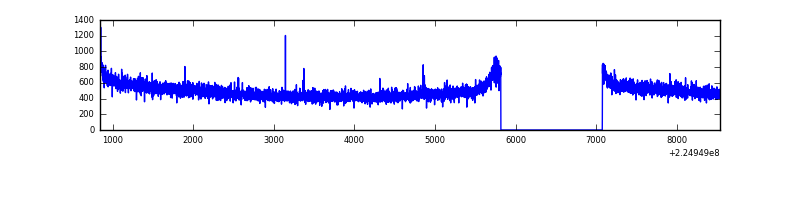 |
| B | 7695 | 6435 | 1 | 1 | 0.01% | 0.02% | 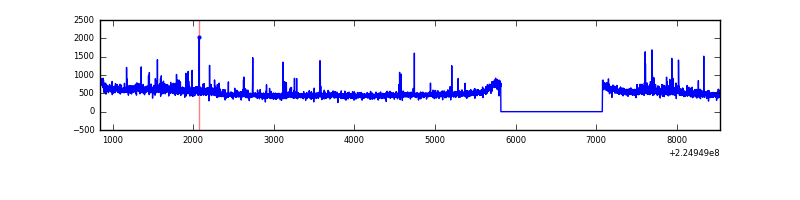 |
| C | 7695 | 6436 | 0 | 0 | 0.00% | 0.00% | 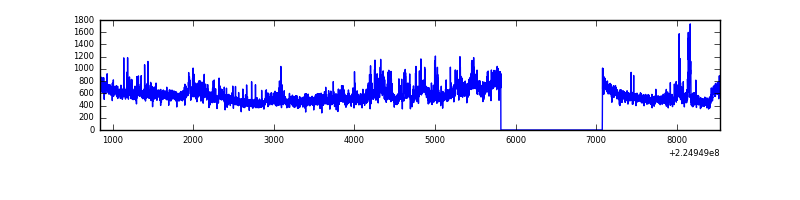 |
| D | 7695 | 6435 | 74 | 74 | 0.96% | 1.15% | 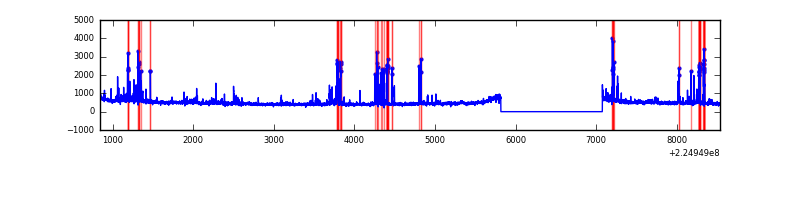 |
Top three noisy pixels from each quadrant. If the there are fewer than three noisy pixels in the level2.evt file, extra rows are filled as -1
| Pixel properties | Quadrant properties | ||||||
|---|---|---|---|---|---|---|---|
| Quadrant | DetID | PixID | Counts | Sigma | Mean | Median | Sigma |
| A | 13 | 14 | 15483 | 89.81 | 818 | 802 | 163.5 |
| A | 3 | 1 | 8397 | 46.46 | 818 | 802 | 163.5 |
| A | 0 | 226 | 7982 | 43.92 | 818 | 802 | 163.5 |
| B | 0 | 214 | 136269 | 894.1 | 818 | 802 | 151.5 |
| B | 4 | 81 | 15605 | 97.7 | 818 | 802 | 151.5 |
| B | 12 | 111 | 14171 | 88.24 | 818 | 802 | 151.5 |
| C | 9 | 68 | 620131 | 3508.16 | 782 | 783 | 176.5 |
| C | 8 | 229 | 34738 | 192.33 | 782 | 783 | 176.5 |
| C | 13 | 61 | 6095 | 30.09 | 782 | 783 | 176.5 |
| D | 2 | 152 | 157881 | 829.03 | 782 | 757 | 189.5 |
| D | 2 | 14 | 124115 | 650.87 | 782 | 757 | 189.5 |
| D | 1 | 52 | 95854 | 501.76 | 782 | 757 | 189.5 |
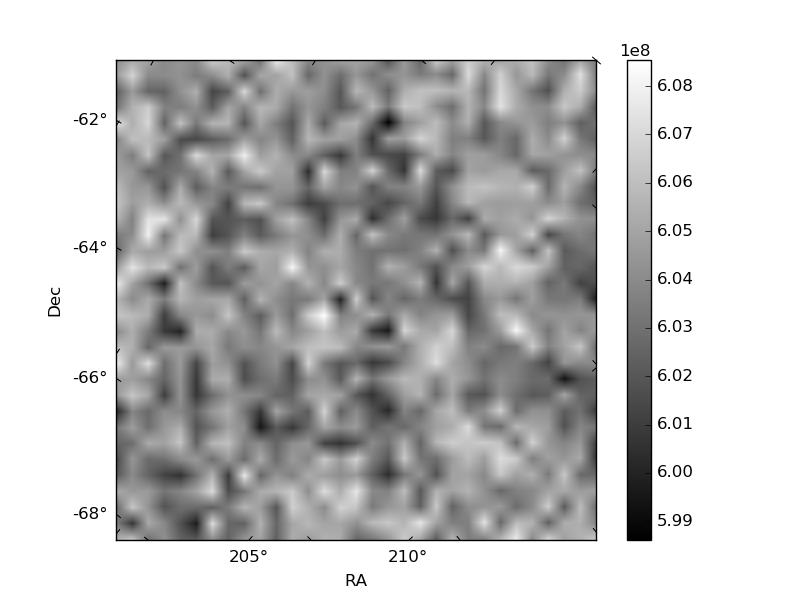
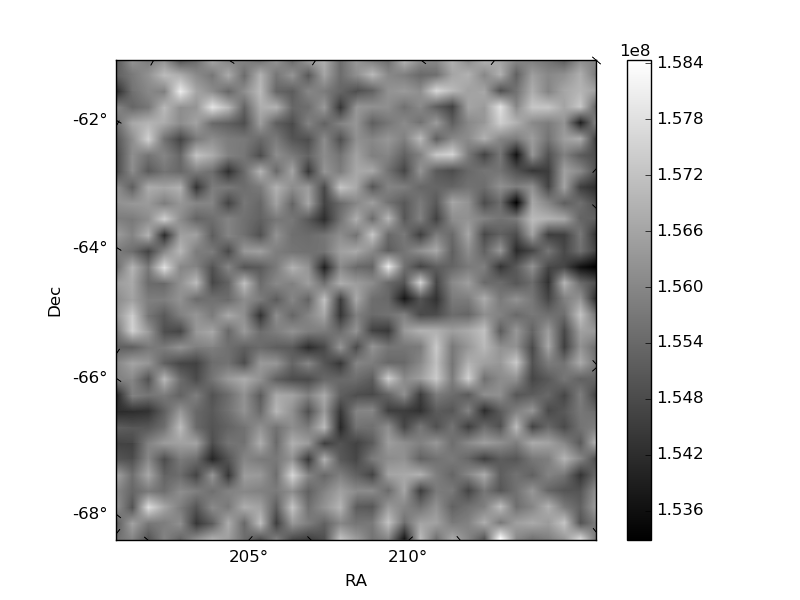
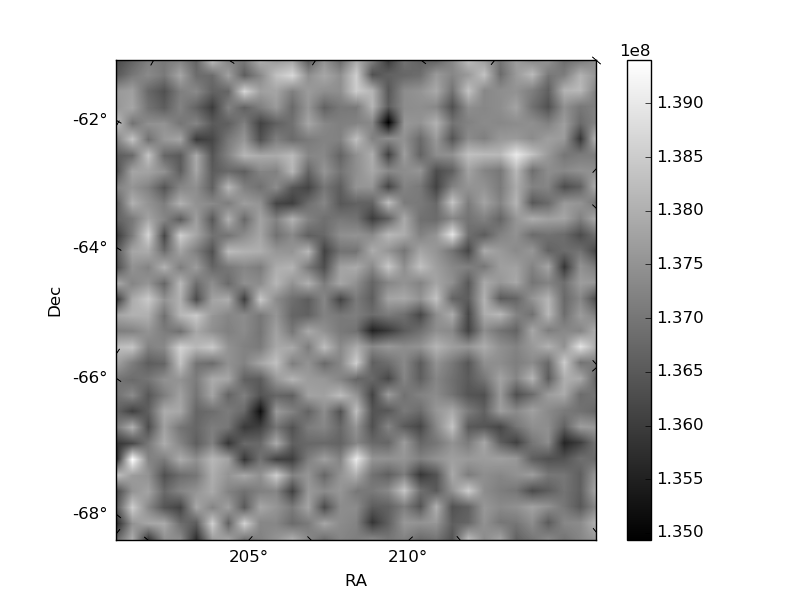
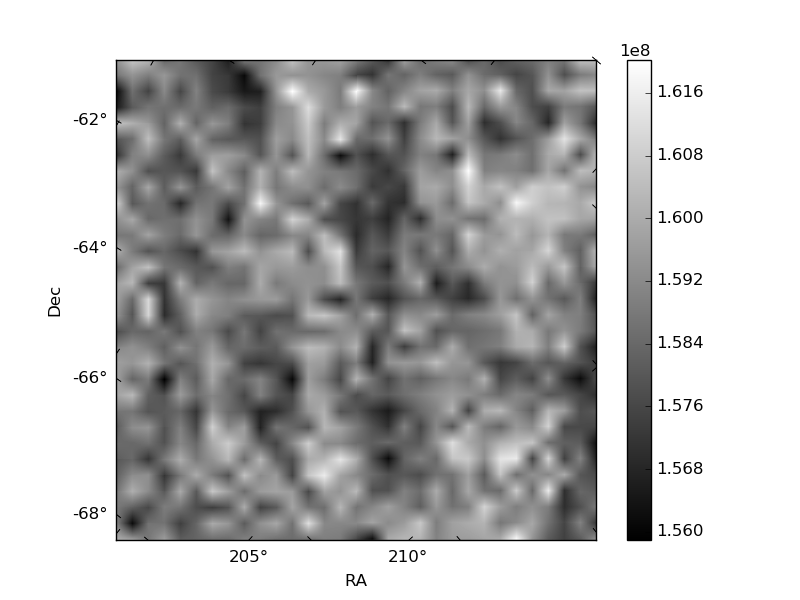
Histogram calculated using DETX and DETY for each event in the final _common_clean file
| Quadrant A | 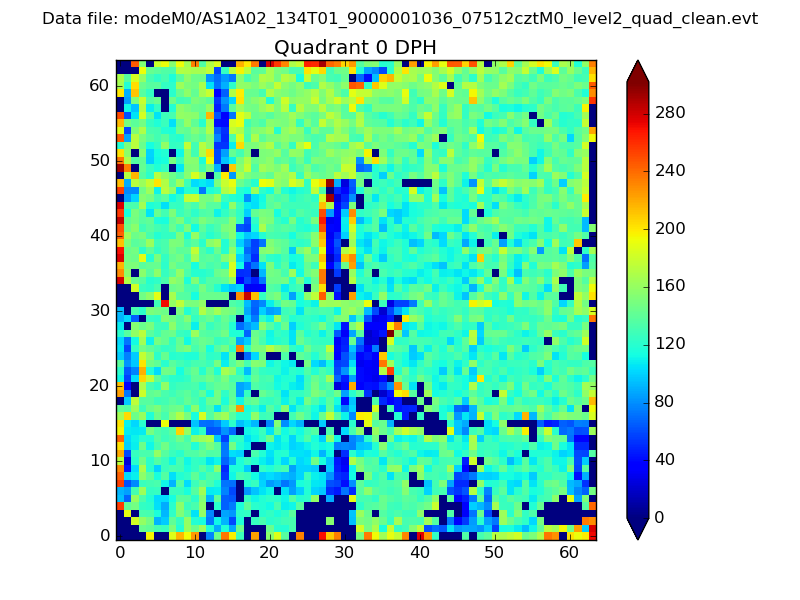 |
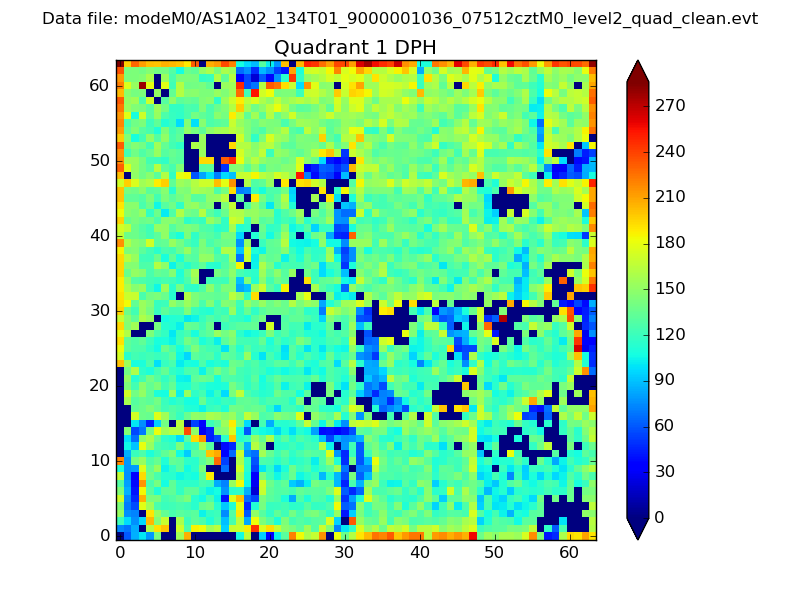 |
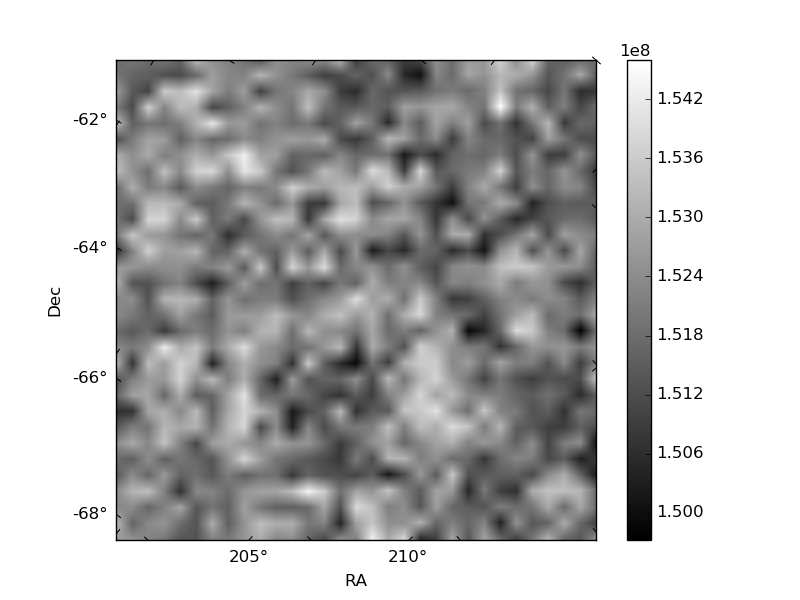
Quadrant B |
|---|---|---|---|
| Quadrant D | 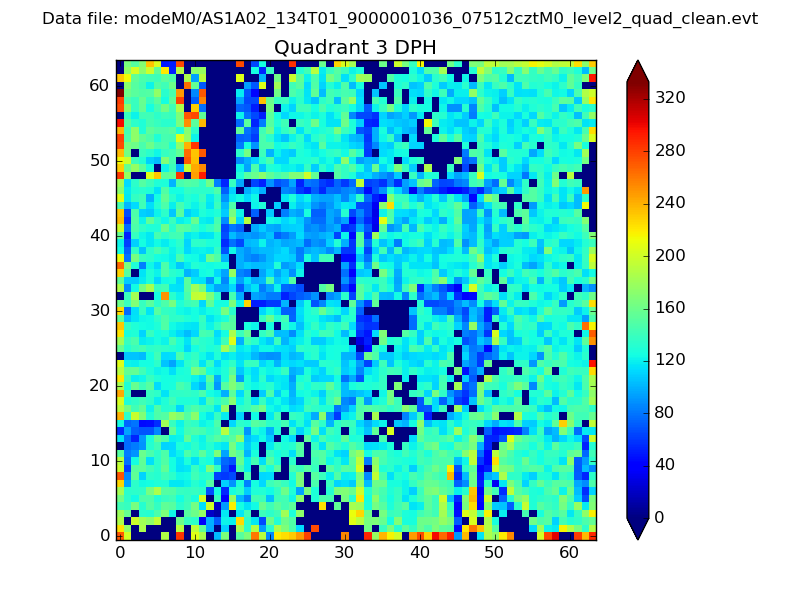 |
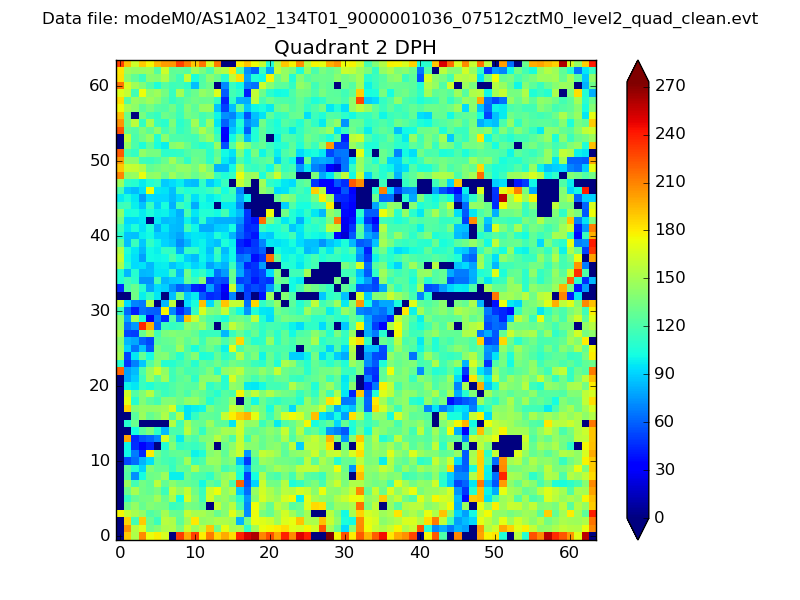 |
Quadrant C |
| Plot type | Count rate plots | Images |
|---|---|---|
| Comparison with Poisson distribution Blue bars denote a histogram of data divided into 1 sec bins. Red curve is a Poisson curve with rate = median count rate of data. |
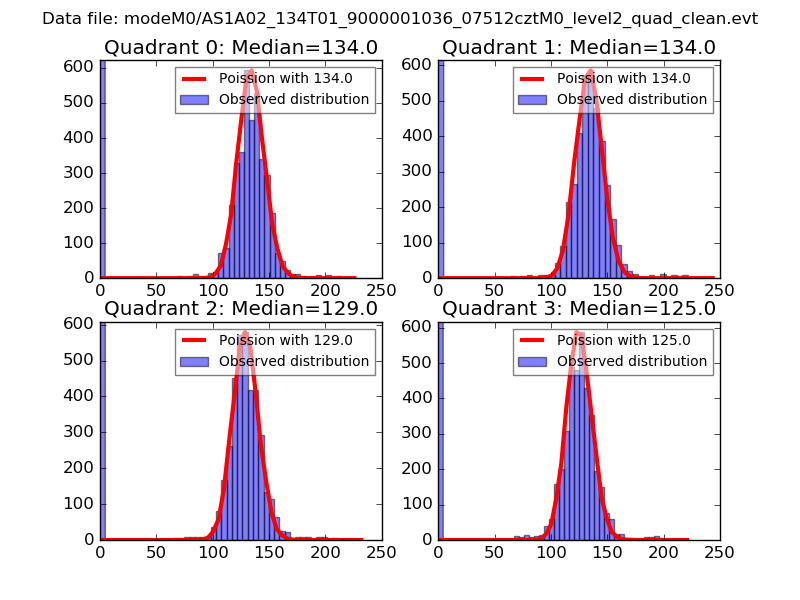 |
 |
| Quadrant-wise count rates Data is divided into 100 sec bins |
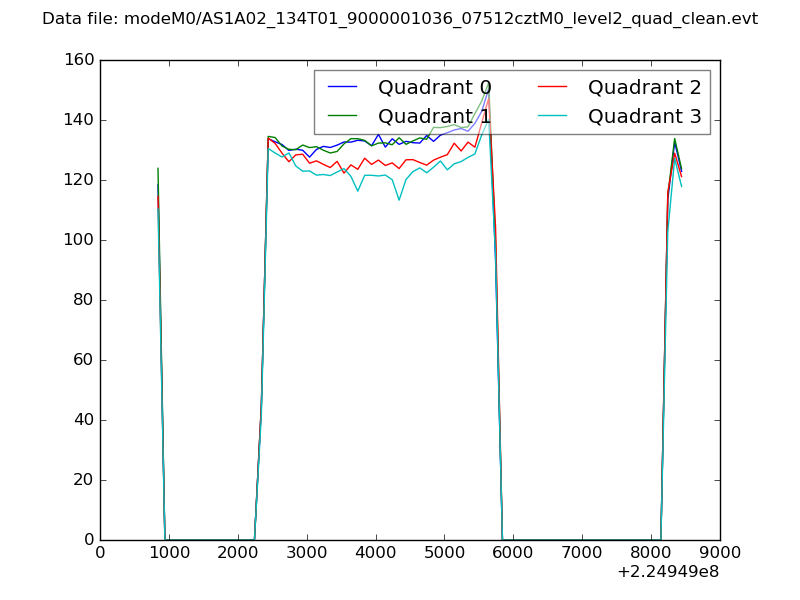 |
|
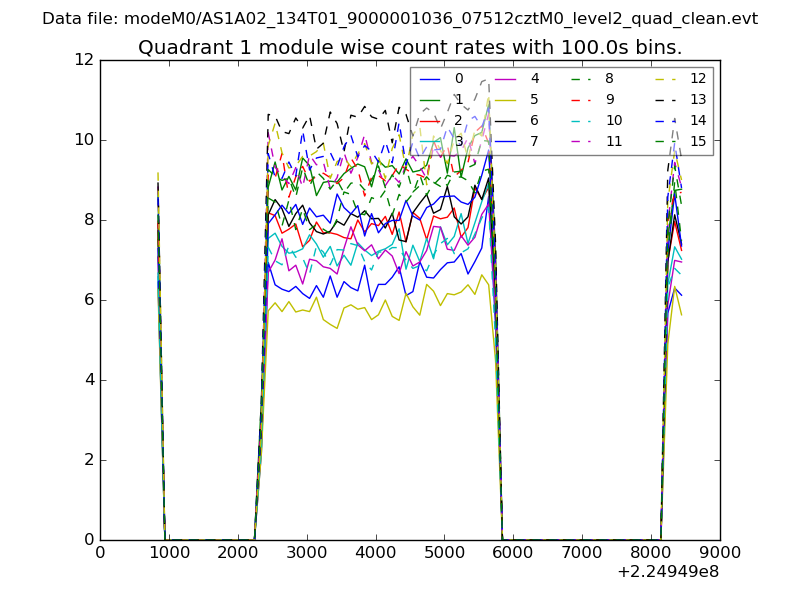
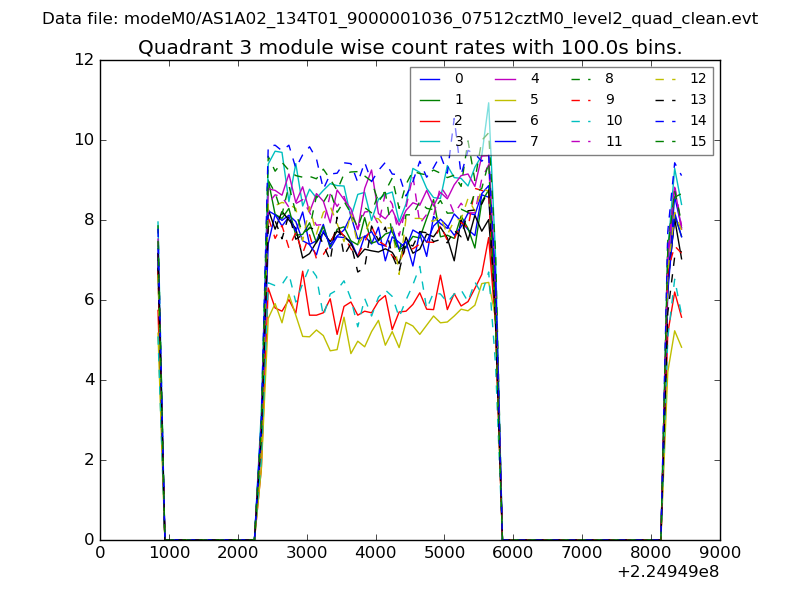
| Module-wise count rates for Quadrant A Data is divided into 100 sec bins |
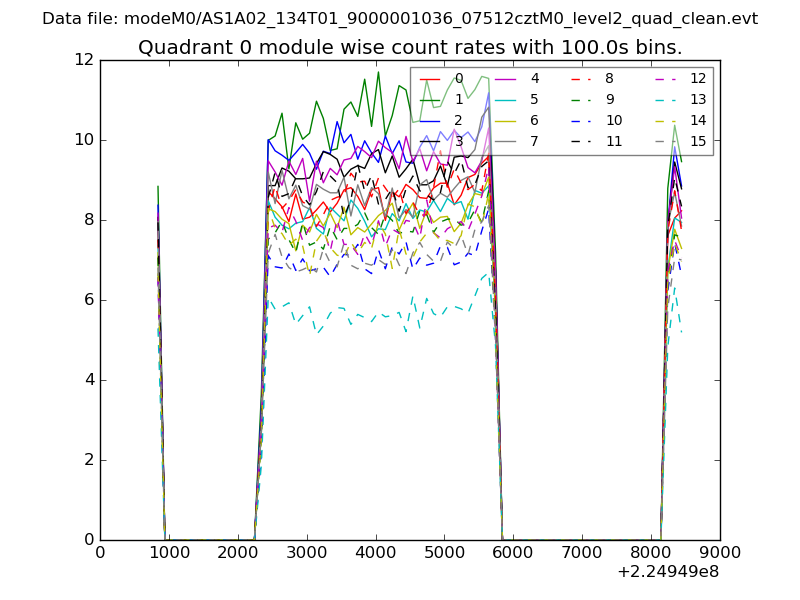 |
 |
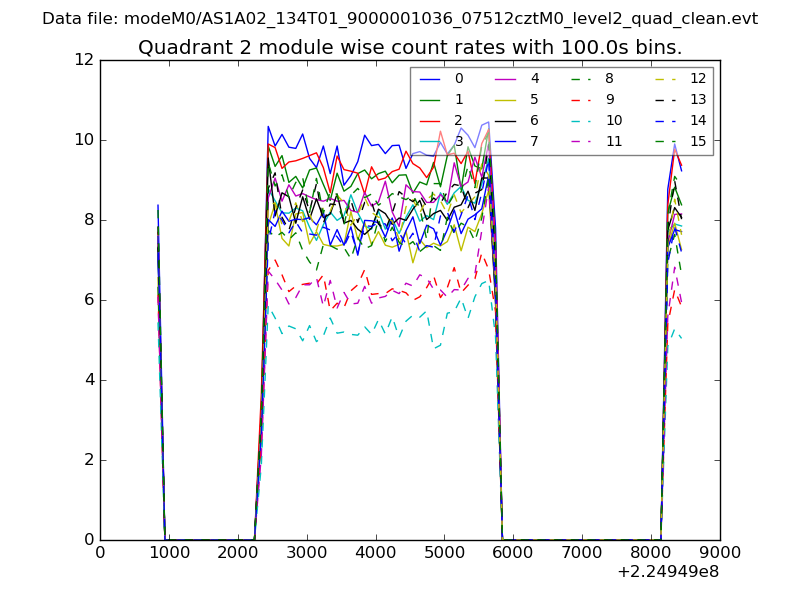
| Module-wise count rates for Quadrant B Data is divided into 100 sec bins |
 |
 |
| Module-wise count rates for Quadrant C Data is divided into 100 sec bins |
 |
 |
| Module-wise count rates for Quadrant D Data is divided into 100 sec bins |
 |
 |
| Parameter | Plot |
|---|---|
| CZT HV Monitor | 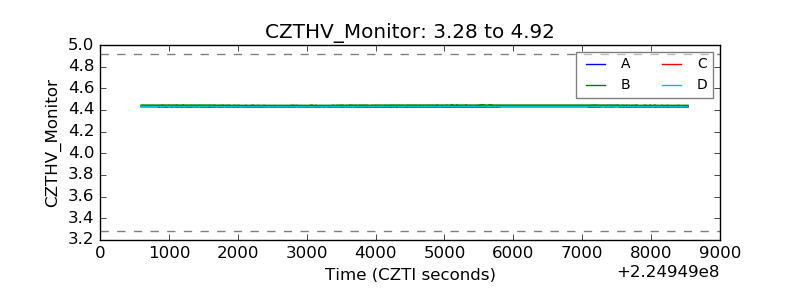 |
| D_VDD | 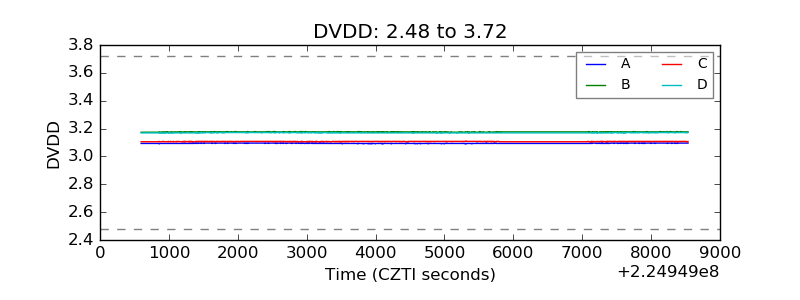 |
| Temperature 1 | 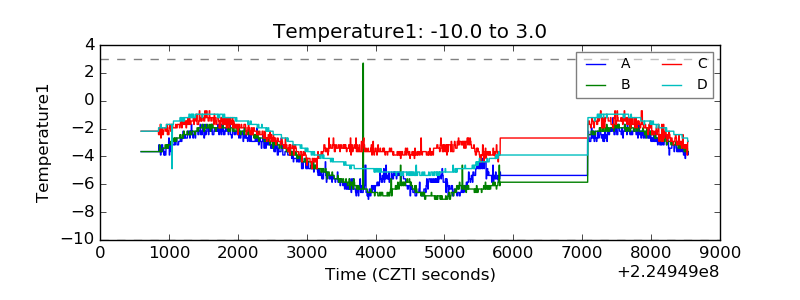 |
| Veto HV Monitor | 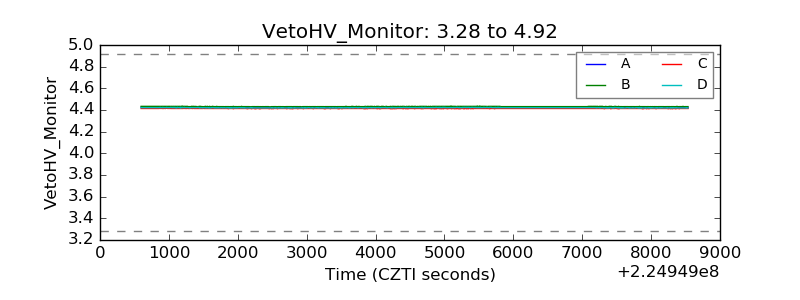 |
| Veto LLD | 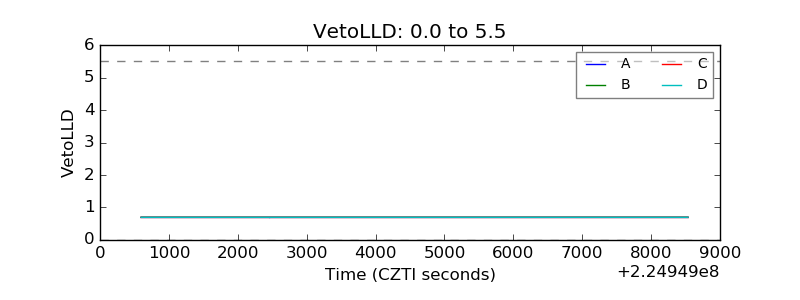 |
| Alpha Counter | 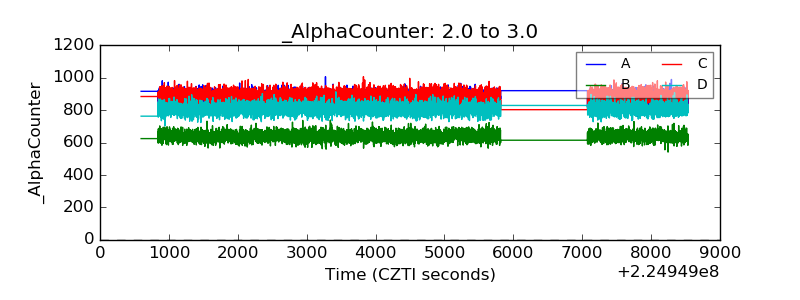 |
| _CPM_Rate | 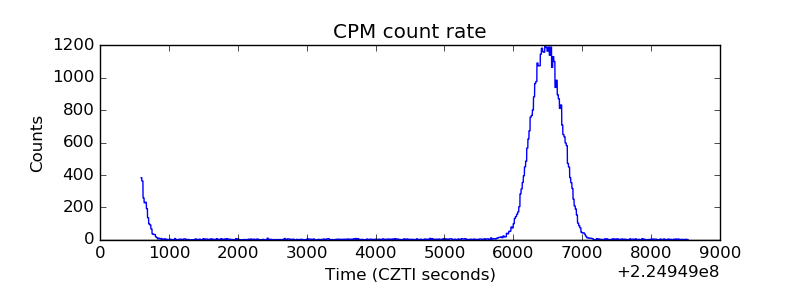 |
| CZT Counter | 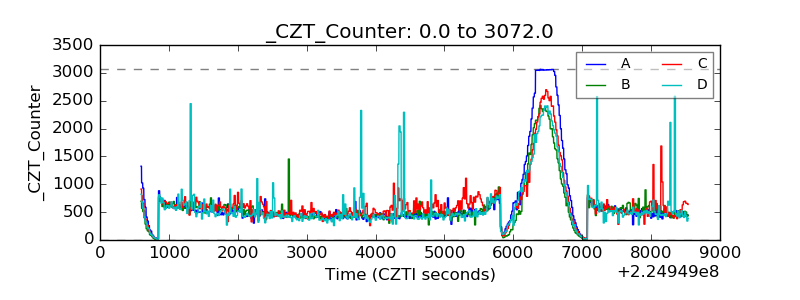 |
| +2.5 Volts monitor | 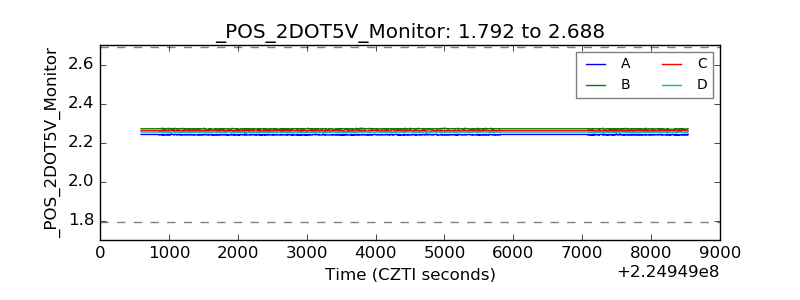 |
| +5 Volts monitor |  |
| _ROLL_ROT | 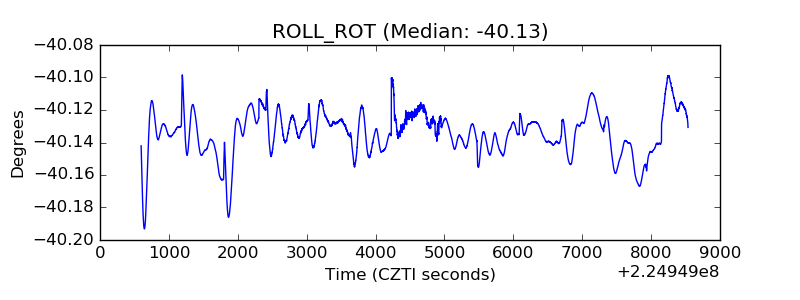 |
| _Roll_DEC | 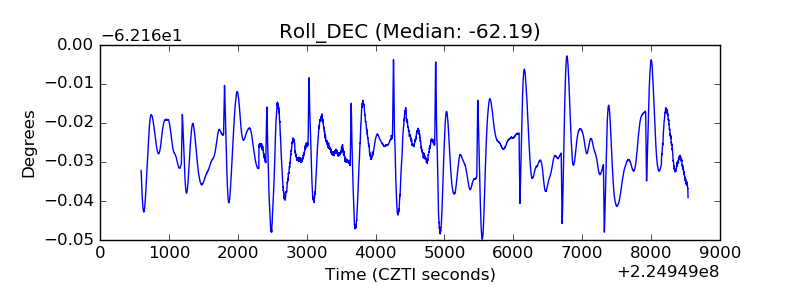 |
| _Roll_RA | 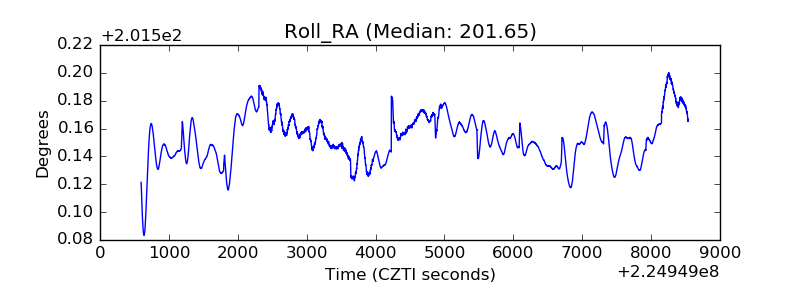 |
| Veto Counter | 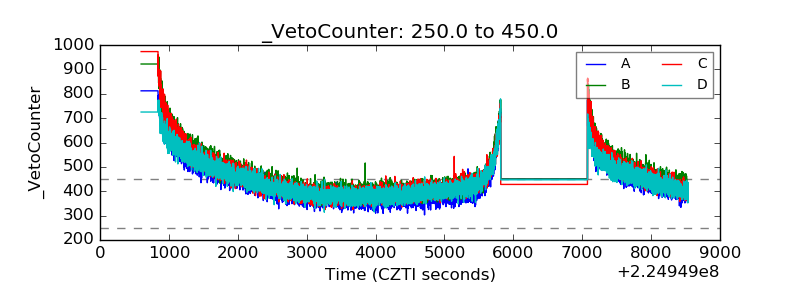 |