| Param | Original file | Final file |
|---|---|---|
| Filename | modeM0/AS1A02_134T01_9000001036_07513cztM0_level2.evt | modeM0/AS1A02_134T01_9000001036_07513cztM0_level2_quad_clean.evt |
| Size (bytes) | 490,213,440 | 90,679,680 |
| Size | 467.5 MB | 86.5 MB |
| Events in quadrant A | 3,081,568 | 590,649 |
| Events in quadrant B | 3,195,714 | 596,501 |
| Events in quadrant C | 3,960,856 | 571,243 |
| Events in quadrant D | 4,167,040 | 534,670 |
| Mode SS | |||
|---|---|---|---|
| Quadrant | BADHDUFLAG | Total packets | Discarded packets |
| A | 0 | 132 | 0 |
| B | 0 | 132 | 0 |
| C | 0 | 132 | 0 |
| D | 0 | 132 | 0 |
| Mode M0 | |||
|---|---|---|---|
| Quadrant | BADHDUFLAG | Total packets | Discarded packets |
| A | 0 | 13446 | 3 |
| B | 0 | 13770 | 2 |
| C | 0 | 16166 | 2 |
| D | 0 | 16950 | 2 |
| Mode M9 | |||
|---|---|---|---|
| Quadrant | BADHDUFLAG | Total packets | Discarded packets |
| A | 0 | 16 | 0 |
| B | 0 | 16 | 0 |
| C | 0 | 16 | 0 |
| D | 0 | 17 | 0 |
| Quadrant | Total seconds | Saturated seconds | Saturation percentage |
|---|---|---|---|
| A | 6493 | 90 | 1.386108% |
| B | 6493 | 94 | 1.447713% |
| C | 6493 | 69 | 1.062683% |
| D | 6493 | 491 | 7.561990% |
Noise dominated data is calculated using 1-second bins in cleaned event files. If a bin has >2000 counts, and if more than 50% of those come from <1% of pixels, then it is considered to be noise-dominated and hence unusable.
| Quadrant | # 1 sec bins | Bins with >0 counts | Bins with >2000 counts | High rate bins dominated by noise | Noise dominated (total time) | Noise dominated (detector-on time) | Marked lightcurve |
|---|---|---|---|---|---|---|---|
| A | 7679 | 6494 | 0 | 0 | 0.00% | 0.00% | 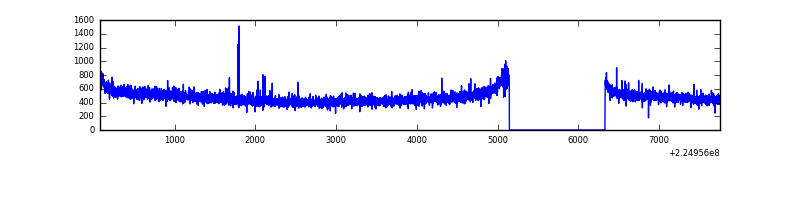 |
| B | 7679 | 6495 | 0 | 0 | 0.00% | 0.00% | 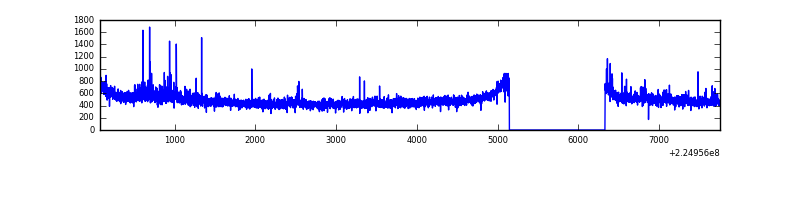 |
| C | 7679 | 6495 | 2 | 2 | 0.03% | 0.03% | 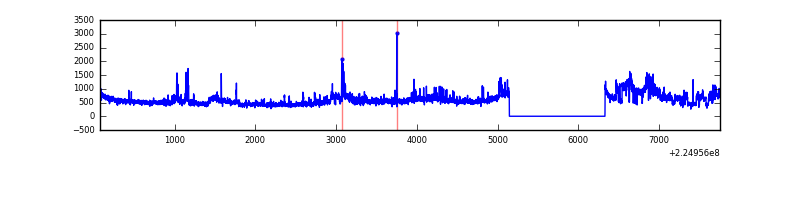 |
| D | 7679 | 6494 | 277 | 277 | 3.61% | 4.27% | 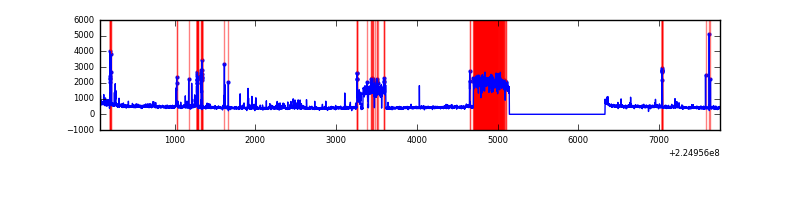 |
Top three noisy pixels from each quadrant. If the there are fewer than three noisy pixels in the level2.evt file, extra rows are filled as -1
| Pixel properties | Quadrant properties | ||||||
|---|---|---|---|---|---|---|---|
| Quadrant | DetID | PixID | Counts | Sigma | Mean | Median | Sigma |
| A | 13 | 14 | 16135 | 96.26 | 794 | 776 | 159.6 |
| A | 3 | 1 | 8095 | 45.87 | 794 | 776 | 159.6 |
| A | 0 | 226 | 7688 | 43.32 | 794 | 776 | 159.6 |
| B | 0 | 214 | 90651 | 608.34 | 797 | 779 | 147.7 |
| B | 0 | 219 | 17169 | 110.94 | 797 | 779 | 147.7 |
| B | 12 | 111 | 14227 | 91.03 | 797 | 779 | 147.7 |
| C | 9 | 68 | 953562 | 5502.21 | 761 | 764 | 173.2 |
| C | 8 | 229 | 21301 | 118.6 | 761 | 764 | 173.2 |
| C | 12 | 4 | 10273 | 54.91 | 761 | 764 | 173.2 |
| D | 1 | 20 | 1022389 | 5684.42 | 741 | 719 | 179.7 |
| D | 2 | 152 | 74473 | 410.36 | 741 | 719 | 179.7 |
| D | 2 | 14 | 71991 | 396.55 | 741 | 719 | 179.7 |
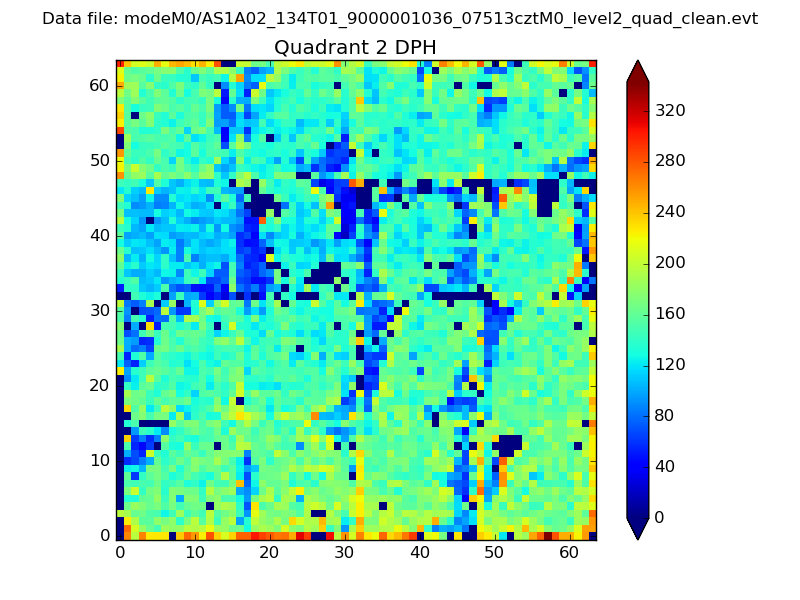
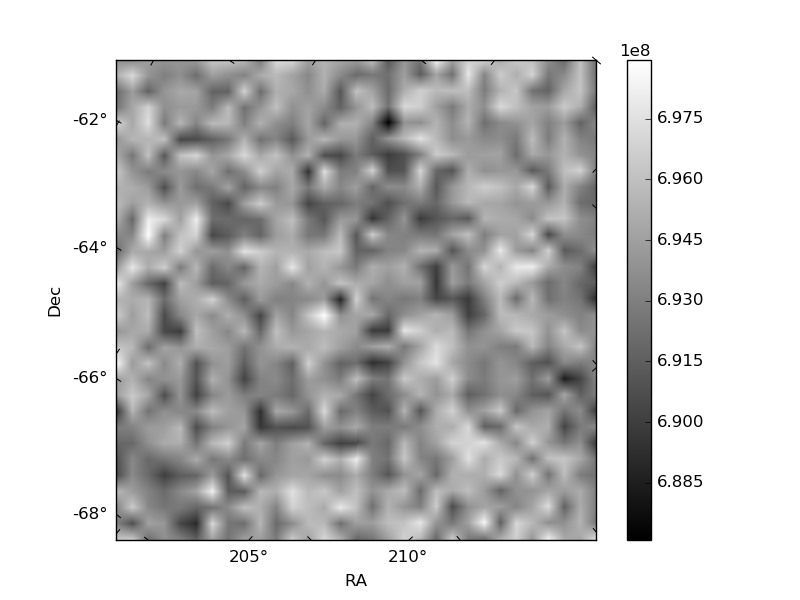
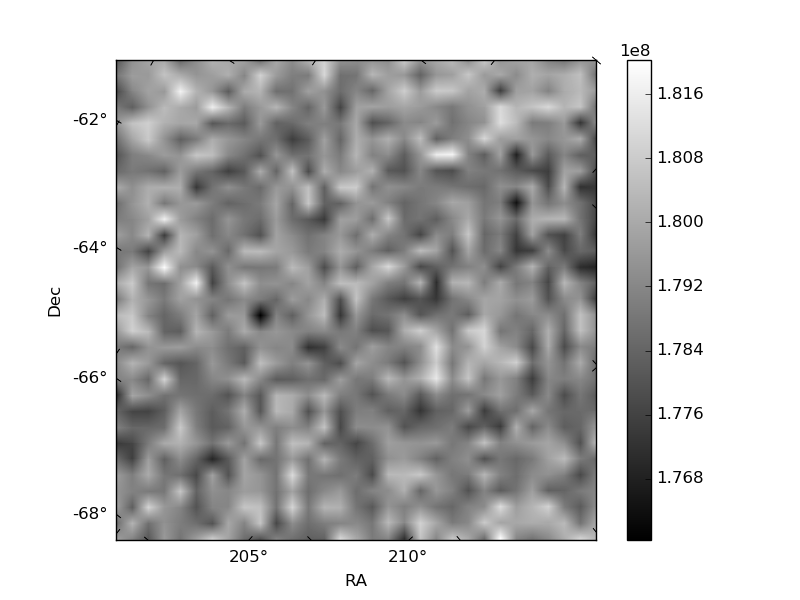
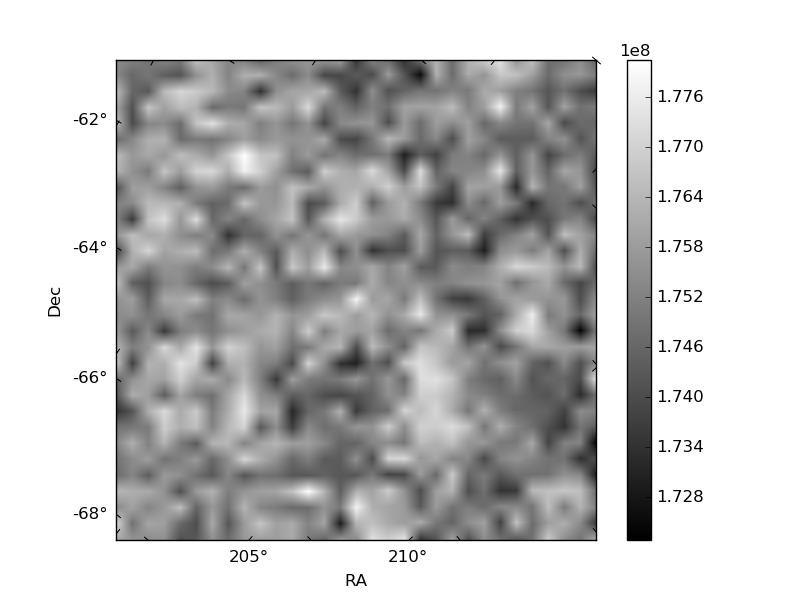
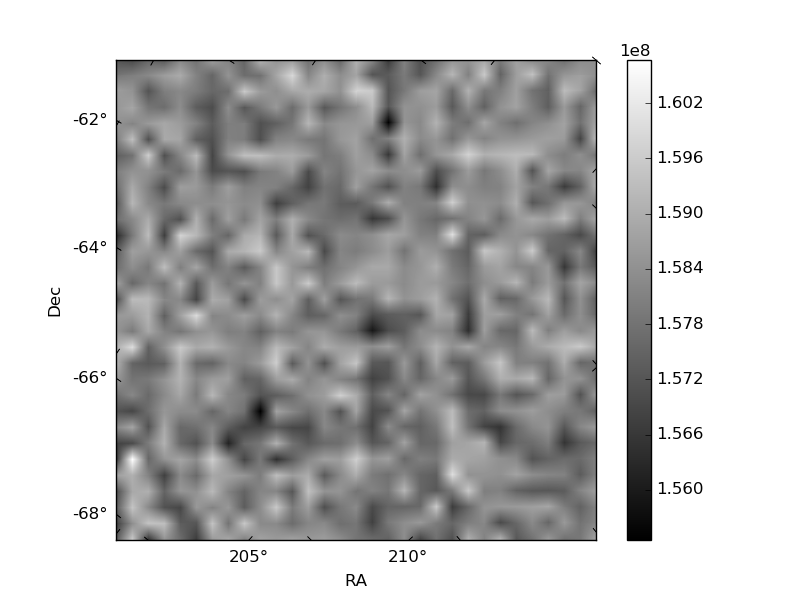
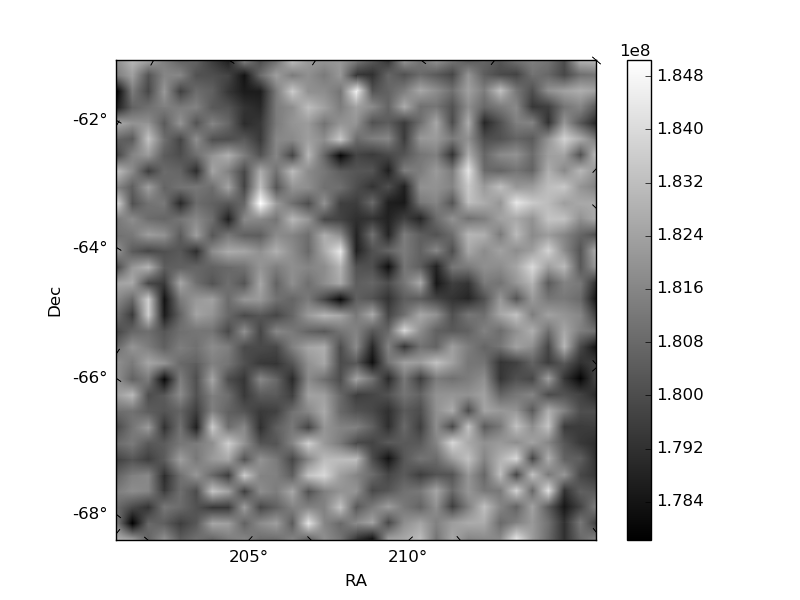
Histogram calculated using DETX and DETY for each event in the final _common_clean file
| Quadrant A | 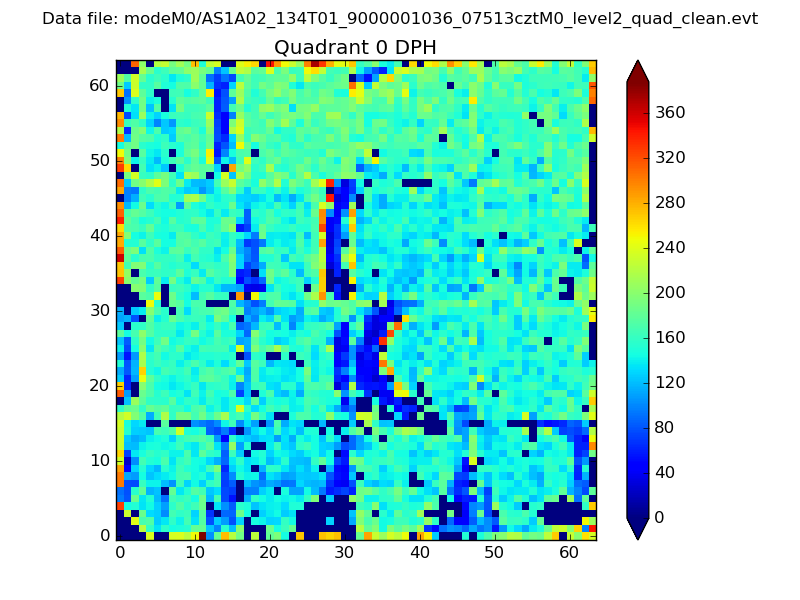 |
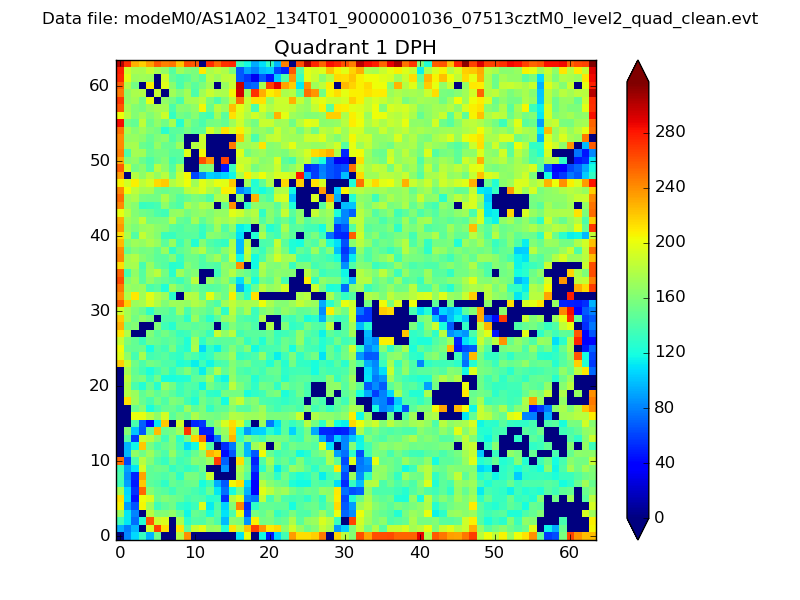 |
Quadrant B |
|---|---|---|---|
| Quadrant D | 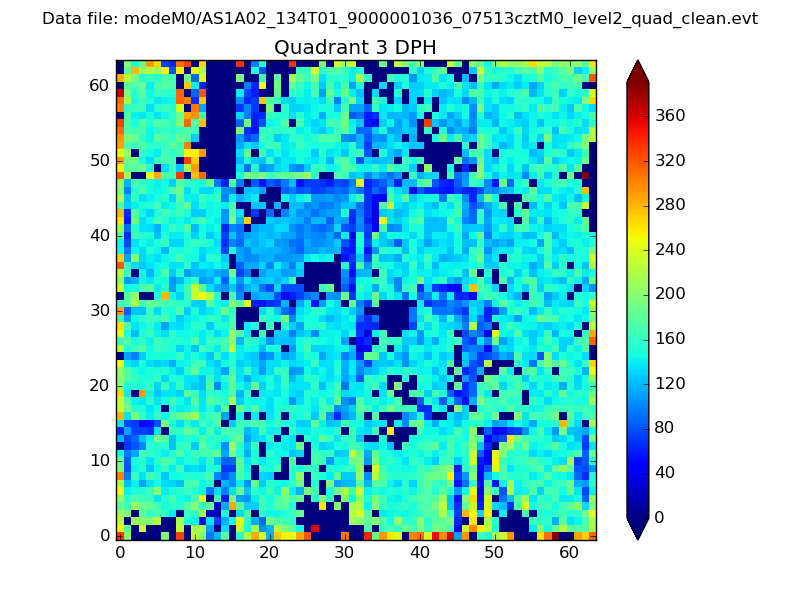 |
 |
Quadrant C |
| Plot type | Count rate plots | Images |
|---|---|---|
| Comparison with Poisson distribution Blue bars denote a histogram of data divided into 1 sec bins. Red curve is a Poisson curve with rate = median count rate of data. |
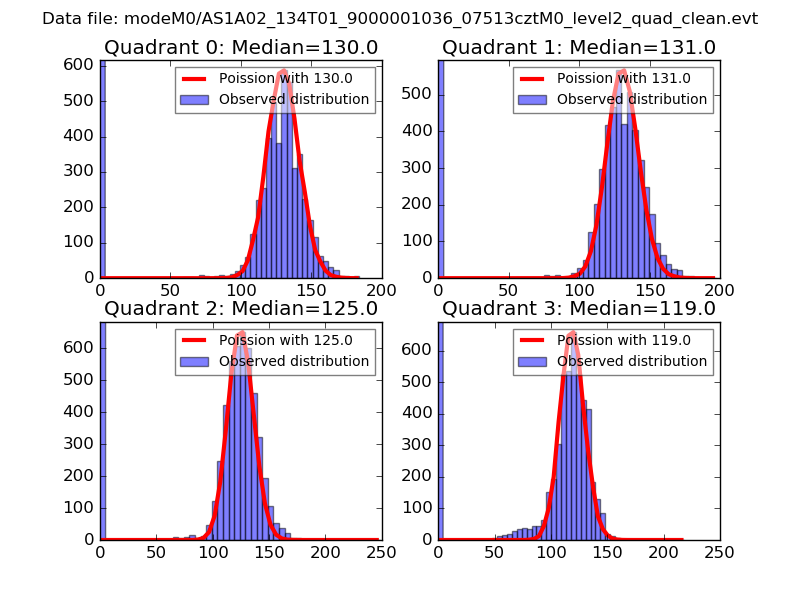 |
 |
| Quadrant-wise count rates Data is divided into 100 sec bins |
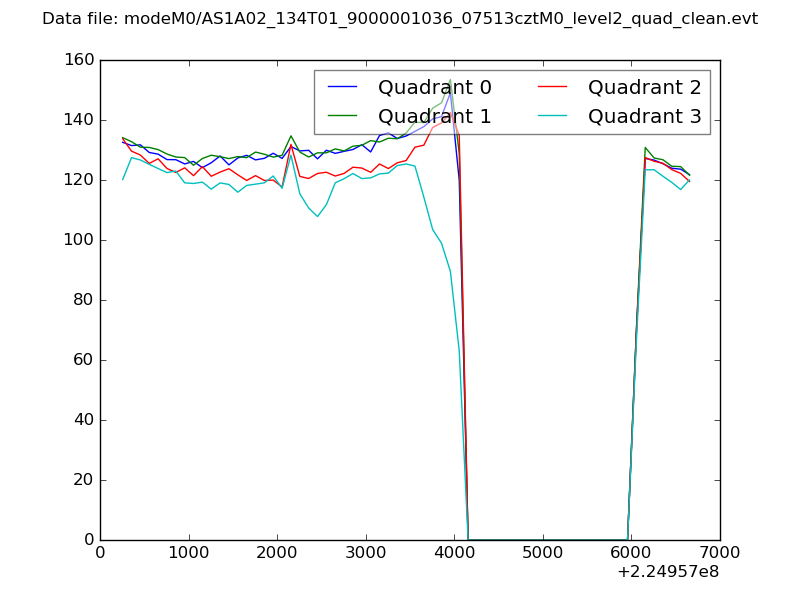 |
|
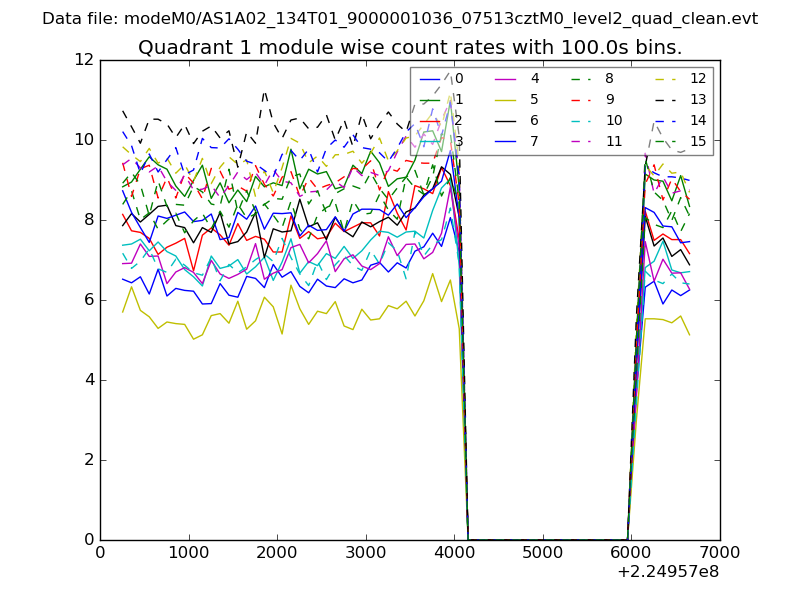
| Module-wise count rates for Quadrant A Data is divided into 100 sec bins |
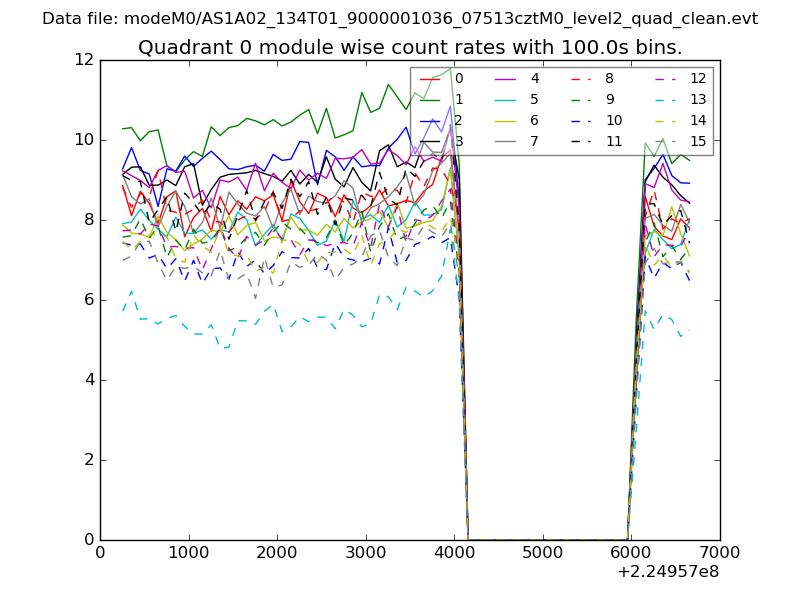 |
 |
| Module-wise count rates for Quadrant B Data is divided into 100 sec bins |
 |
 |
| Module-wise count rates for Quadrant C Data is divided into 100 sec bins |
 |
 |
| Module-wise count rates for Quadrant D Data is divided into 100 sec bins |
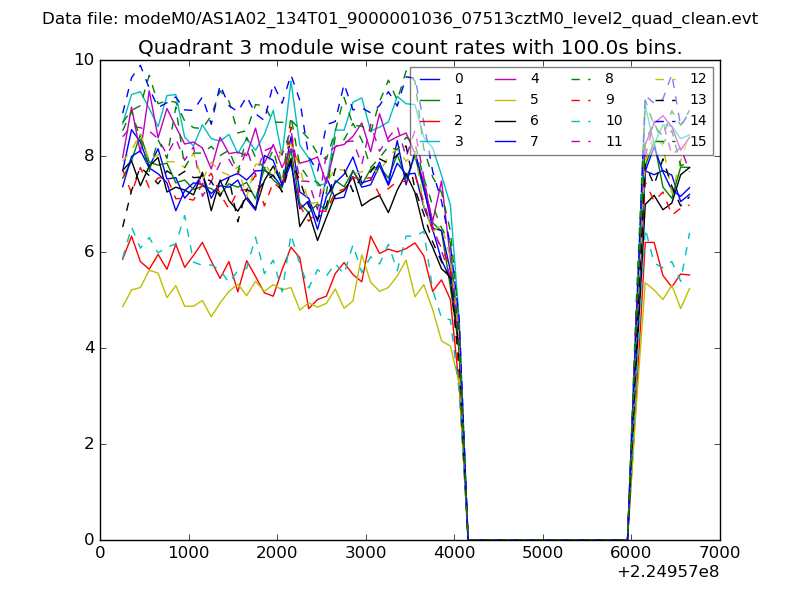 |
 |
| Parameter | Plot |
|---|---|
| CZT HV Monitor | 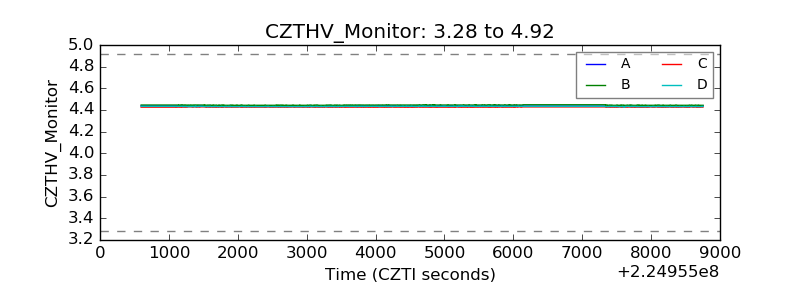 |
| D_VDD | 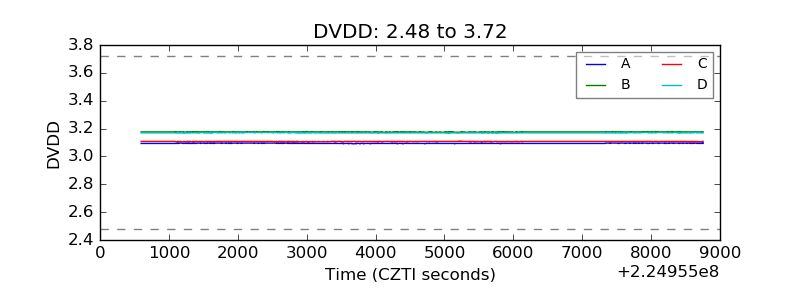 |
| Temperature 1 | 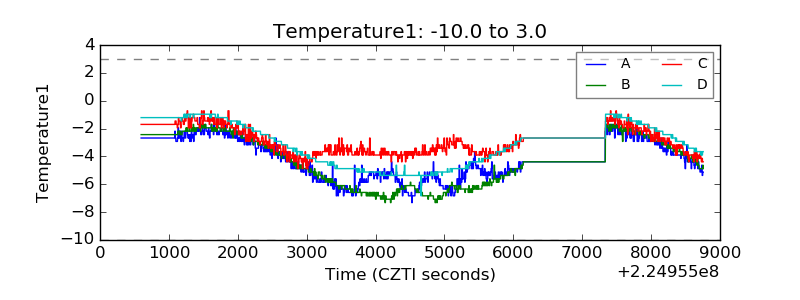 |
| Veto HV Monitor | 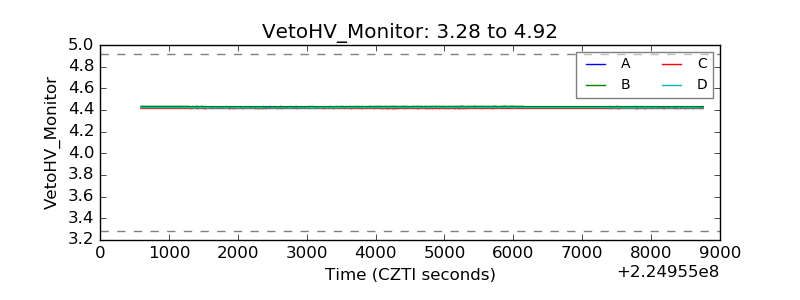 |
| Veto LLD | 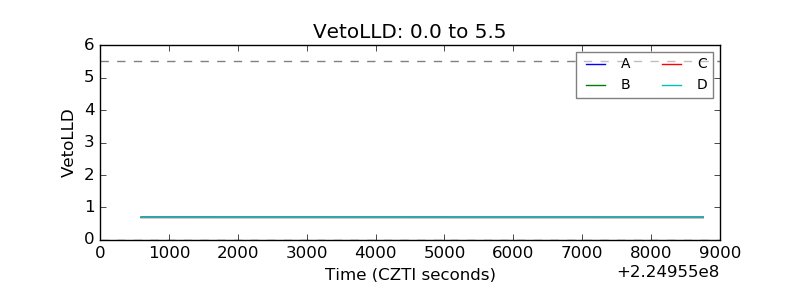 |
| Alpha Counter | 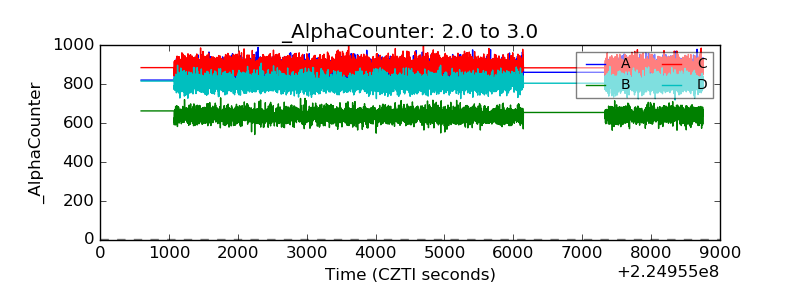 |
| _CPM_Rate | 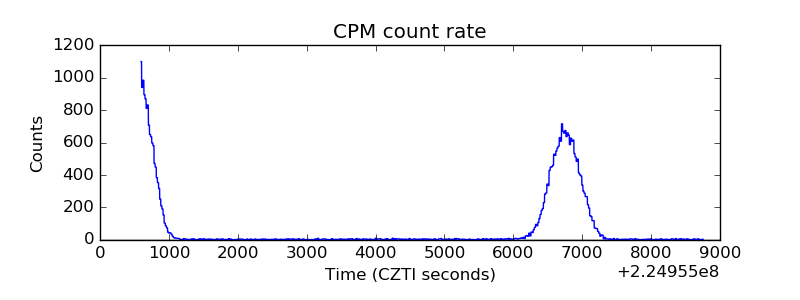 |
| CZT Counter |  |
| +2.5 Volts monitor |  |
| +5 Volts monitor | 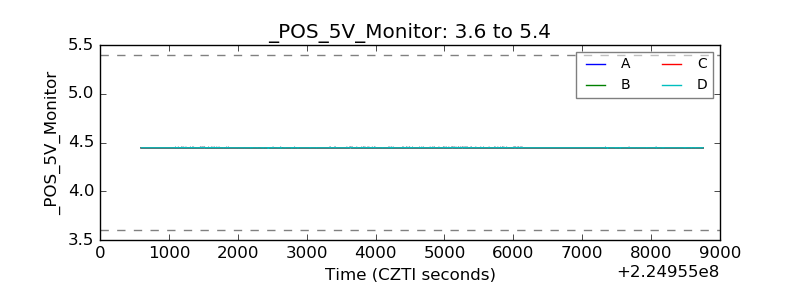 |
| _ROLL_ROT | 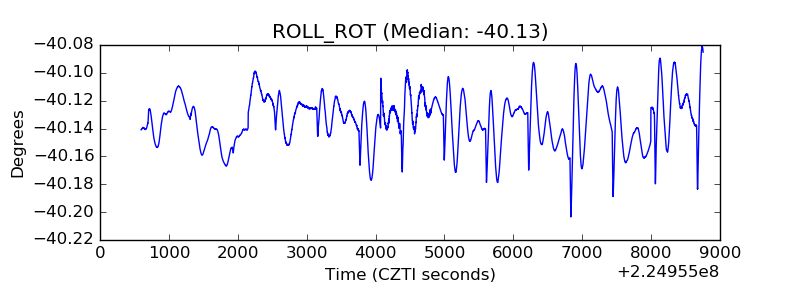 |
| _Roll_DEC | 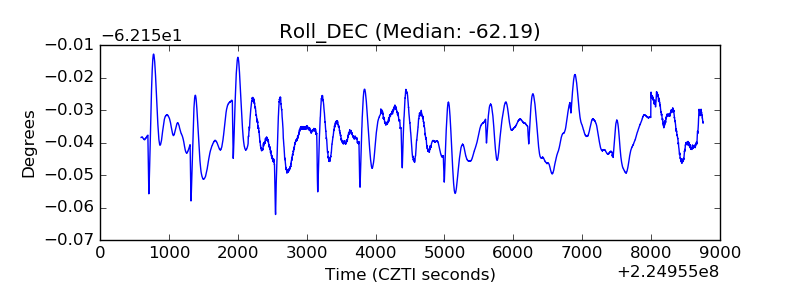 |
| _Roll_RA | 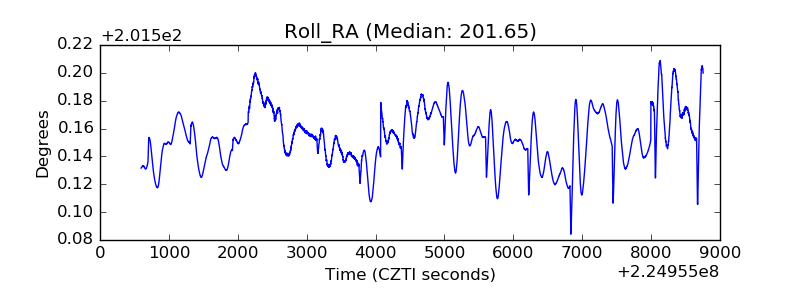 |
| Veto Counter | 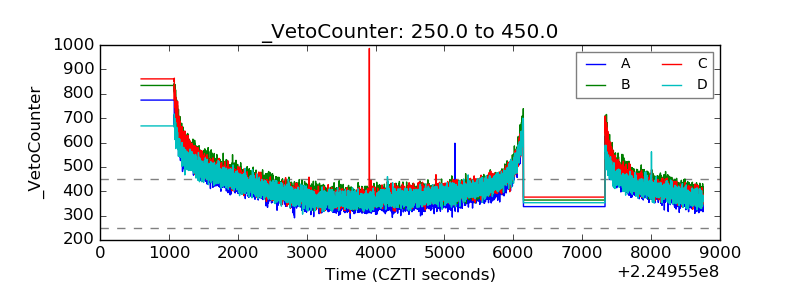 |