| Param | Original file | Final file |
|---|---|---|
| Filename | modeM0/AS1A02_134T01_9000001036_07515cztM0_level2.evt | modeM0/AS1A02_134T01_9000001036_07515cztM0_level2_quad_clean.evt |
| Size (bytes) | 490,631,040 | 106,666,560 |
| Size | 467.9 MB | 101.7 MB |
| Events in quadrant A | 3,282,081 | 696,638 |
| Events in quadrant B | 3,451,919 | 702,354 |
| Events in quadrant C | 3,751,619 | 677,763 |
| Events in quadrant D | 3,881,630 | 649,965 |
| Mode SS | |||
|---|---|---|---|
| Quadrant | BADHDUFLAG | Total packets | Discarded packets |
| A | 0 | 150 | 0 |
| B | 0 | 150 | 0 |
| C | 0 | 150 | 0 |
| D | 0 | 150 | 0 |
| Mode M0 | |||
|---|---|---|---|
| Quadrant | BADHDUFLAG | Total packets | Discarded packets |
| A | 0 | 14846 | 3 |
| B | 0 | 15132 | 2 |
| C | 0 | 16196 | 2 |
| D | 0 | 16711 | 2 |
| Mode M9 | |||
|---|---|---|---|
| Quadrant | BADHDUFLAG | Total packets | Discarded packets |
| A | 0 | 15 | 0 |
| B | 0 | 15 | 0 |
| C | 0 | 15 | 0 |
| D | 0 | 15 | 0 |
| Quadrant | Total seconds | Saturated seconds | Saturation percentage |
|---|---|---|---|
| A | 7231 | 40 | 0.553174% |
| B | 7231 | 65 | 0.898907% |
| C | 7231 | 37 | 0.511686% |
| D | 7231 | 92 | 1.272300% |
Noise dominated data is calculated using 1-second bins in cleaned event files. If a bin has >2000 counts, and if more than 50% of those come from <1% of pixels, then it is considered to be noise-dominated and hence unusable.
| Quadrant | # 1 sec bins | Bins with >0 counts | Bins with >2000 counts | High rate bins dominated by noise | Noise dominated (total time) | Noise dominated (detector-on time) | Marked lightcurve |
|---|---|---|---|---|---|---|---|
| A | 8766 | 7233 | 0 | 0 | 0.00% | 0.00% | 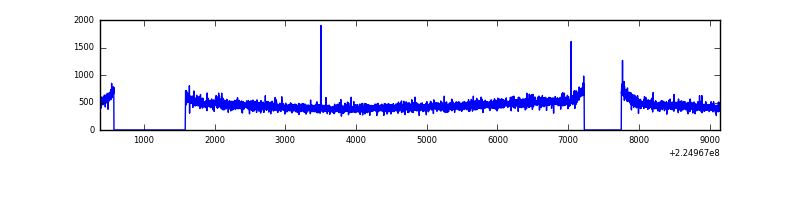 |
| B | 8766 | 7233 | 0 | 0 | 0.00% | 0.00% | 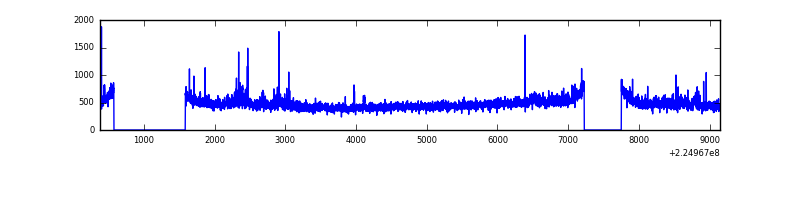 |
| C | 8766 | 7233 | 14 | 14 | 0.16% | 0.19% | 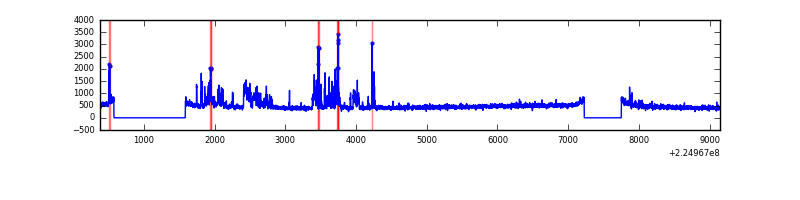 |
| D | 8766 | 7233 | 59 | 59 | 0.67% | 0.82% | 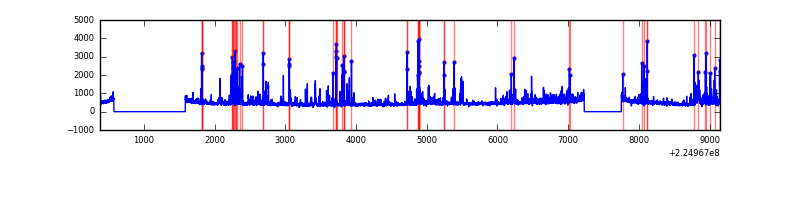 |
Top three noisy pixels from each quadrant. If the there are fewer than three noisy pixels in the level2.evt file, extra rows are filled as -1
| Pixel properties | Quadrant properties | ||||||
|---|---|---|---|---|---|---|---|
| Quadrant | DetID | PixID | Counts | Sigma | Mean | Median | Sigma |
| A | 13 | 14 | 9589 | 50.85 | 846 | 828 | 172.3 |
| A | 13 | 251 | 9008 | 47.48 | 846 | 828 | 172.3 |
| A | 0 | 226 | 8095 | 42.18 | 846 | 828 | 172.3 |
| B | 0 | 214 | 79340 | 487.31 | 853 | 832 | 161.1 |
| B | 0 | 219 | 32371 | 195.77 | 853 | 832 | 161.1 |
| B | 12 | 111 | 15827 | 93.08 | 853 | 832 | 161.1 |
| C | 9 | 68 | 386100 | 2046.15 | 815 | 817 | 188.3 |
| C | 1 | 16 | 151955 | 802.66 | 815 | 817 | 188.3 |
| C | 8 | 229 | 28830 | 148.77 | 815 | 817 | 188.3 |
| D | 2 | 152 | 468229 | 2357.84 | 811 | 784 | 198.3 |
| D | 12 | 233 | 104362 | 522.46 | 811 | 784 | 198.3 |
| D | 2 | 136 | 100671 | 503.84 | 811 | 784 | 198.3 |
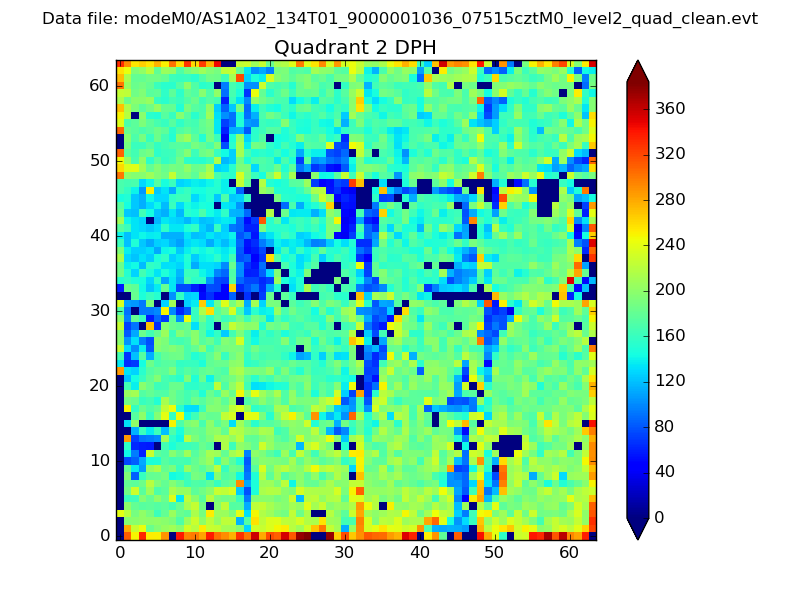
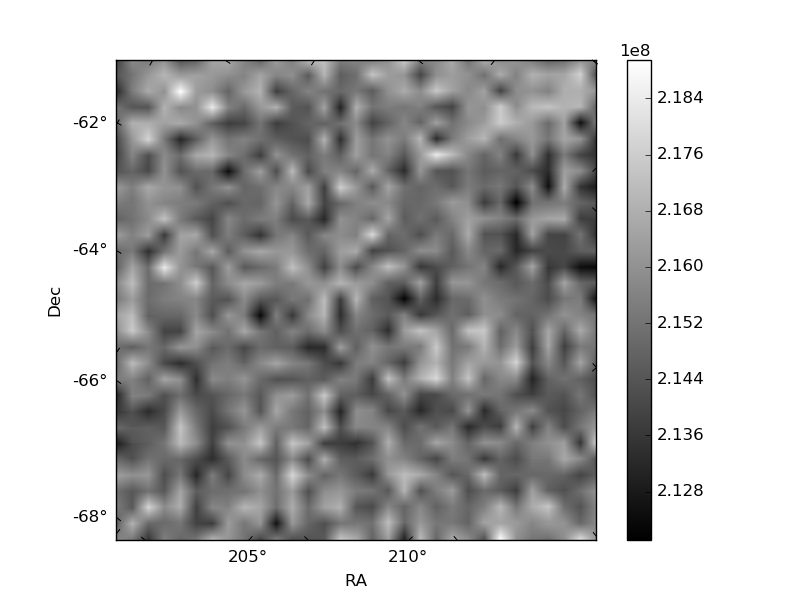
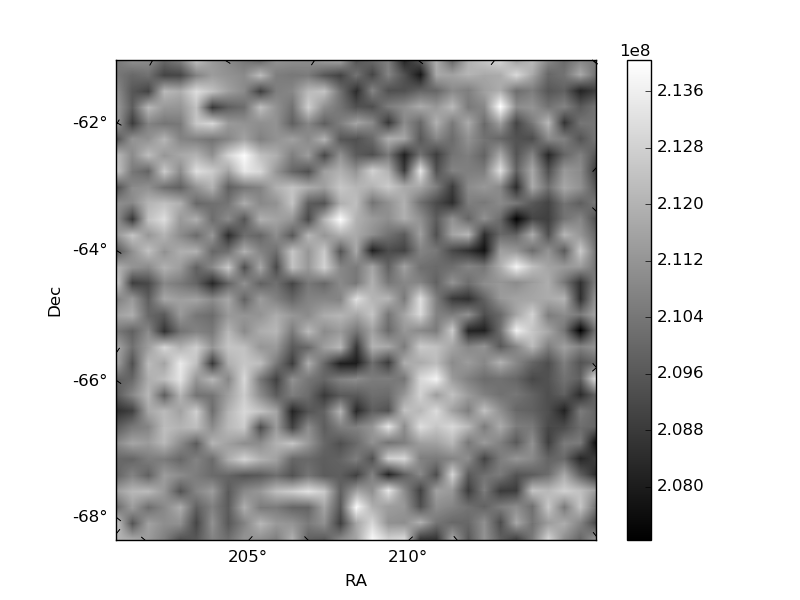
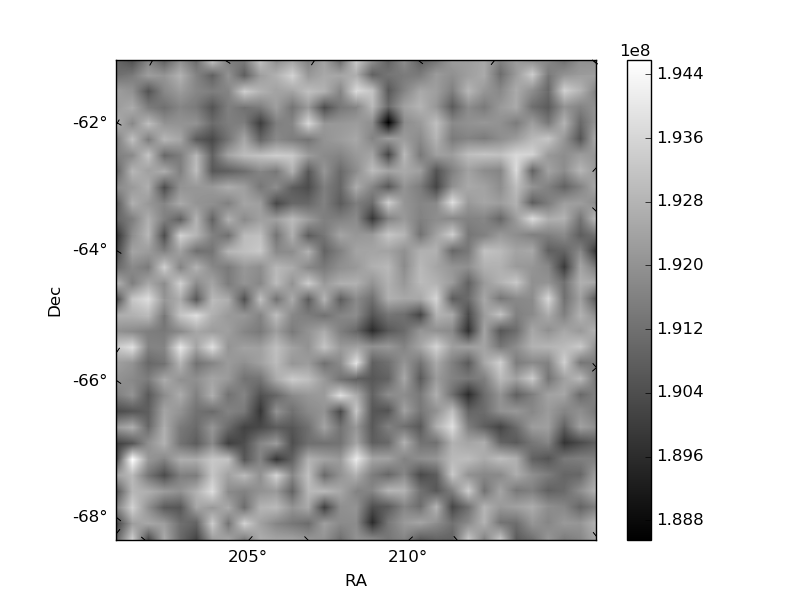
Histogram calculated using DETX and DETY for each event in the final _common_clean file
| Quadrant A | 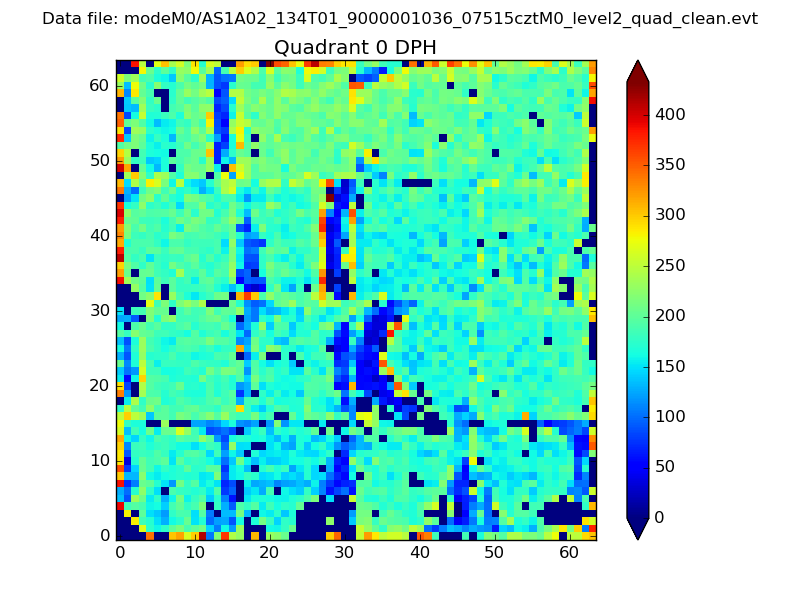 |
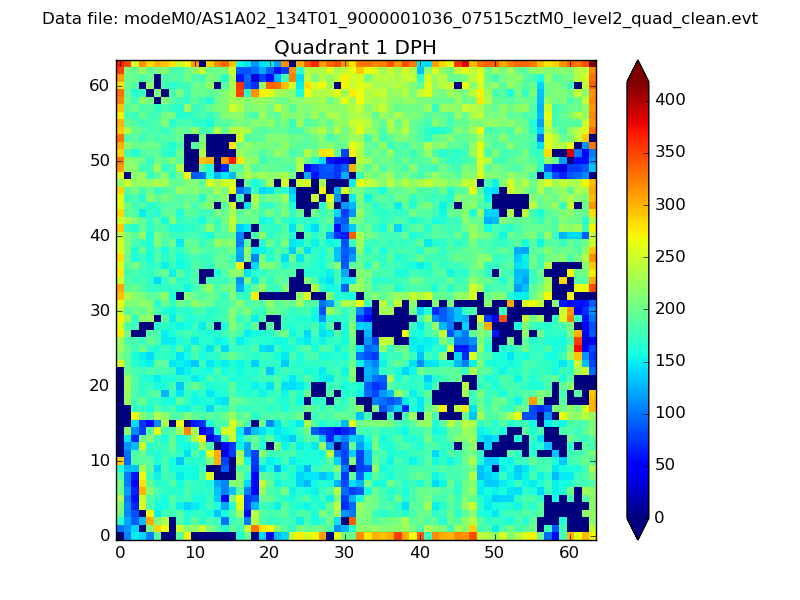 |
Quadrant B |
|---|---|---|---|
| Quadrant D | 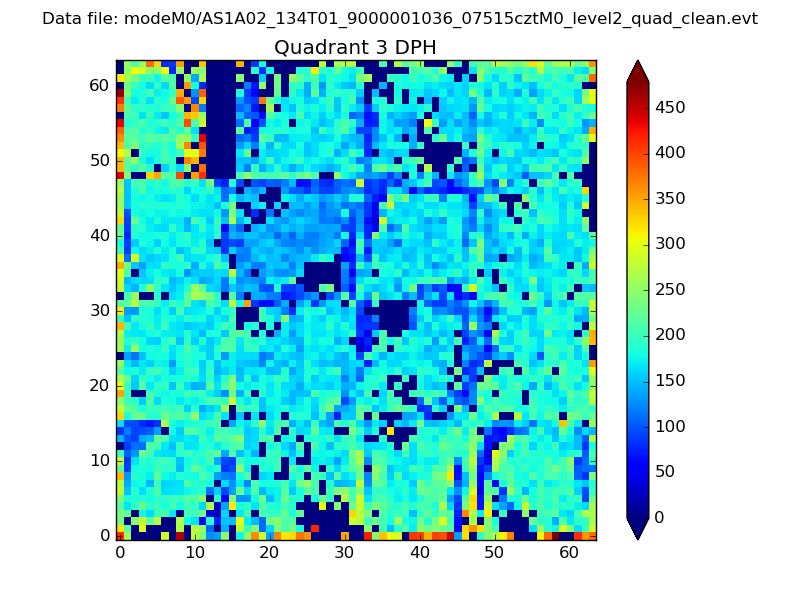 |
 |
Quadrant C |
| Plot type | Count rate plots | Images |
|---|---|---|
| Comparison with Poisson distribution Blue bars denote a histogram of data divided into 1 sec bins. Red curve is a Poisson curve with rate = median count rate of data. |
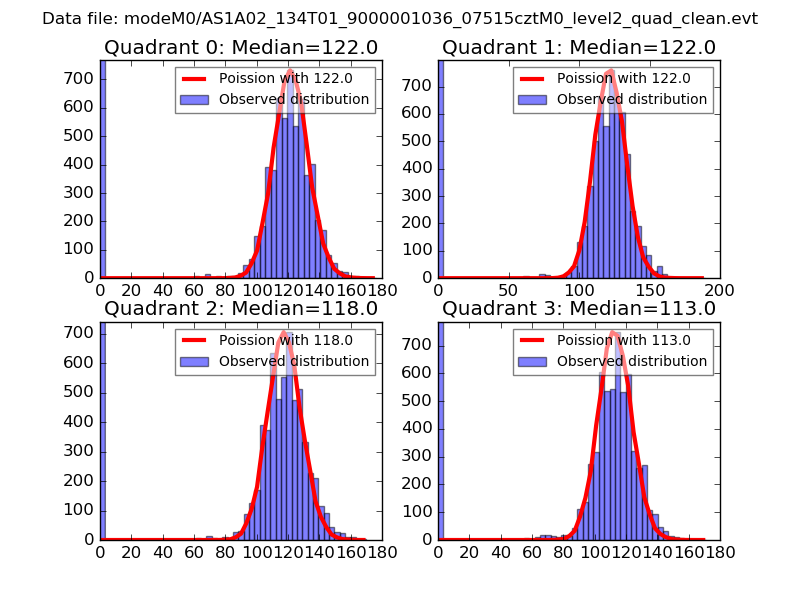 |
 |
| Quadrant-wise count rates Data is divided into 100 sec bins |
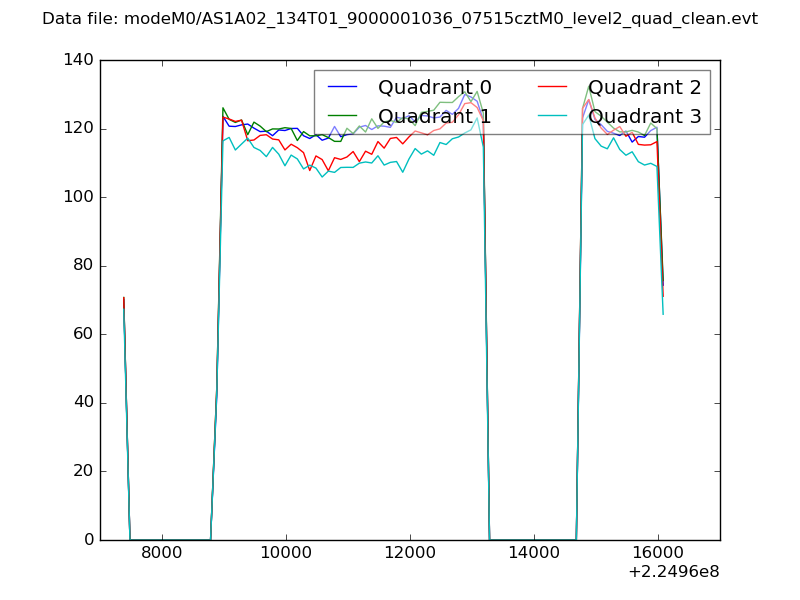 |
|
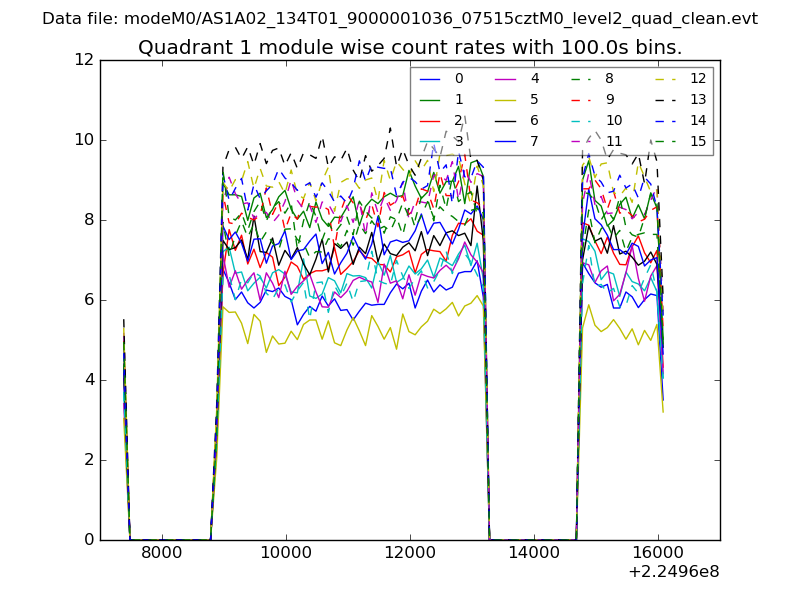
| Module-wise count rates for Quadrant A Data is divided into 100 sec bins |
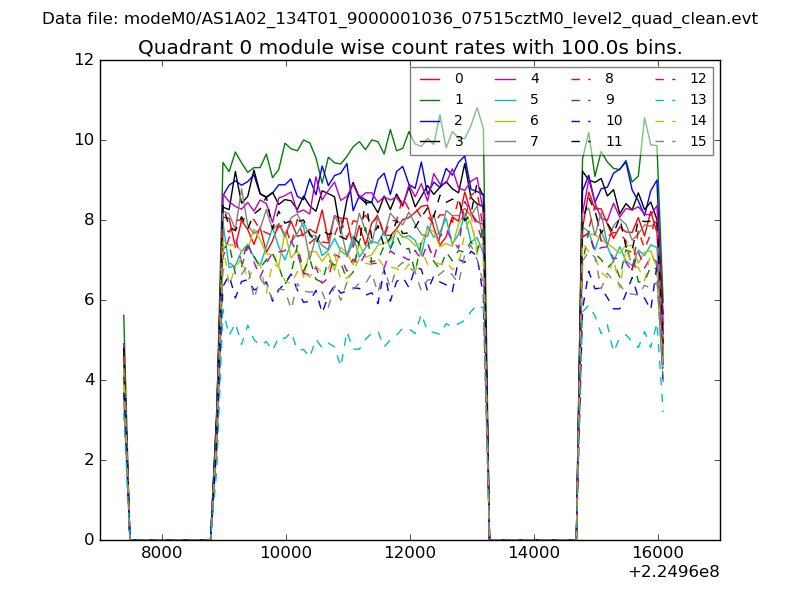 |
 |
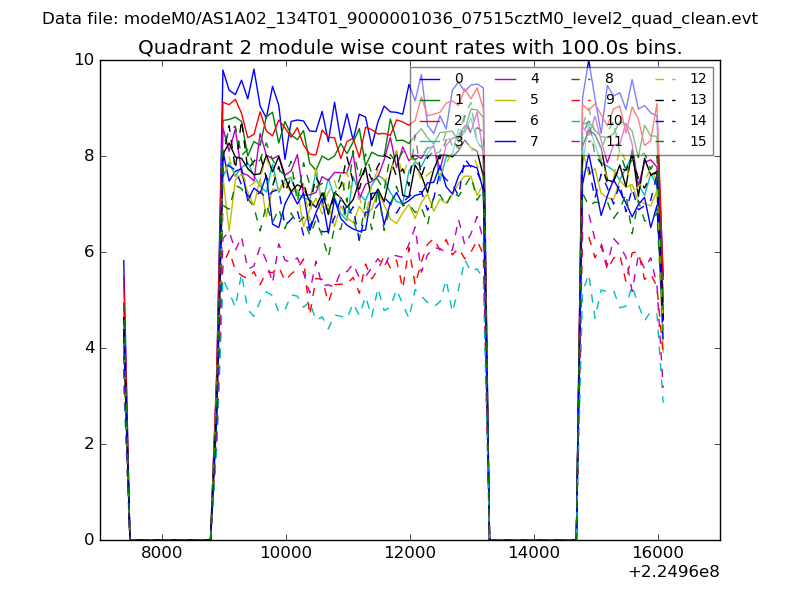
| Module-wise count rates for Quadrant B Data is divided into 100 sec bins |
 |
 |
| Module-wise count rates for Quadrant C Data is divided into 100 sec bins |
 |
 |
| Module-wise count rates for Quadrant D Data is divided into 100 sec bins |
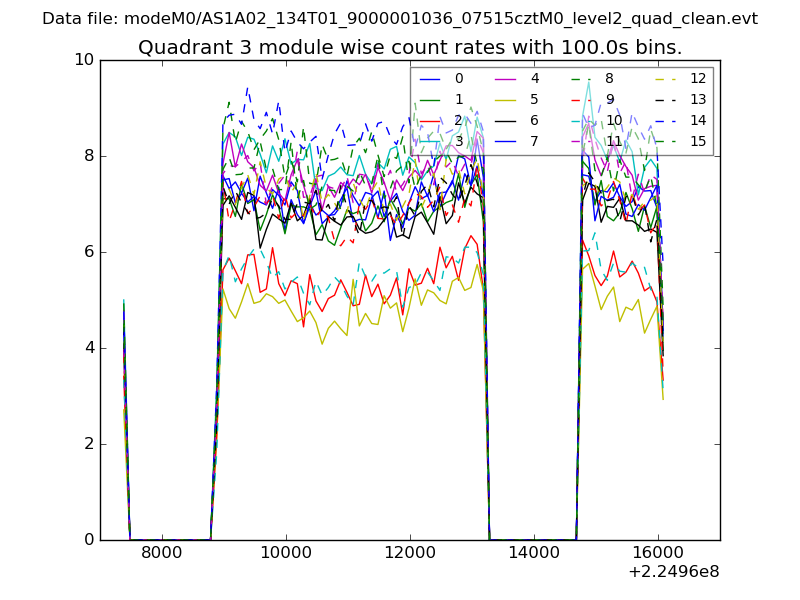 |
 |
| Parameter | Plot |
|---|---|
| CZT HV Monitor | 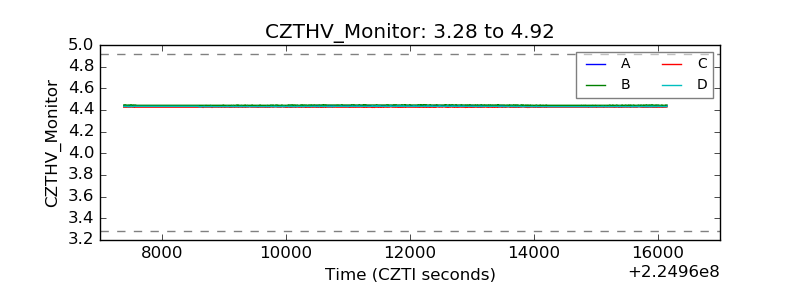 |
| D_VDD | 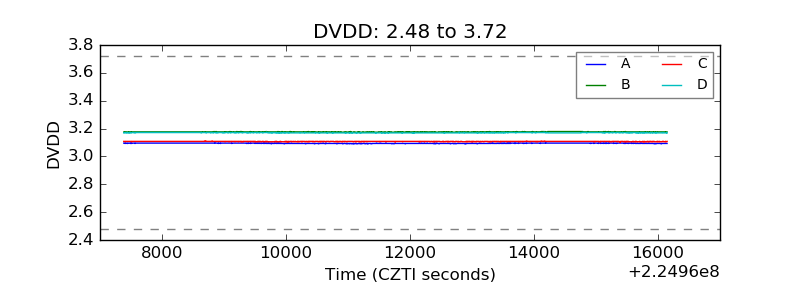 |
| Temperature 1 | 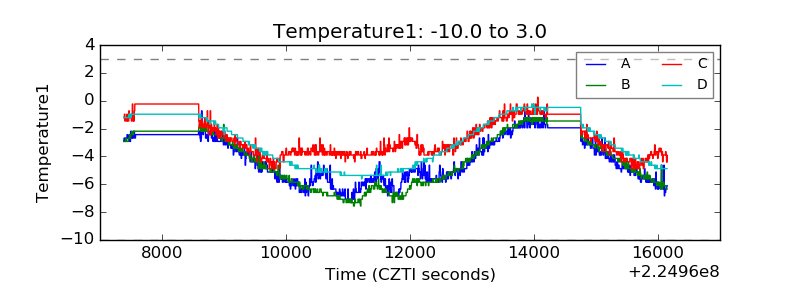 |
| Veto HV Monitor | 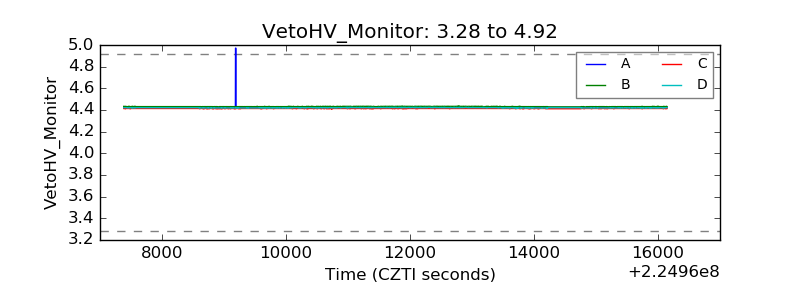 |
| Veto LLD | 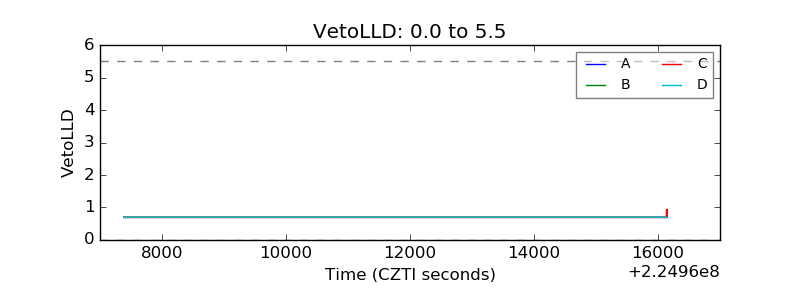 |
| Alpha Counter | 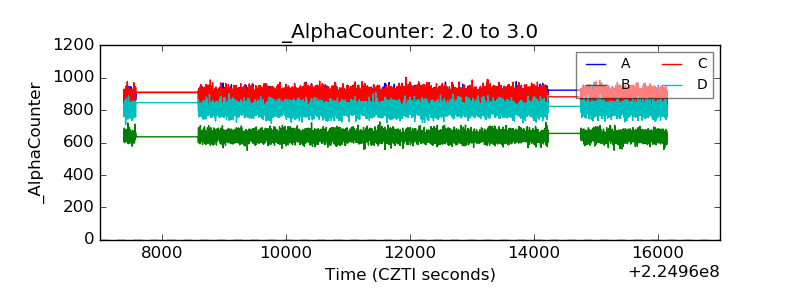 |
| _CPM_Rate | 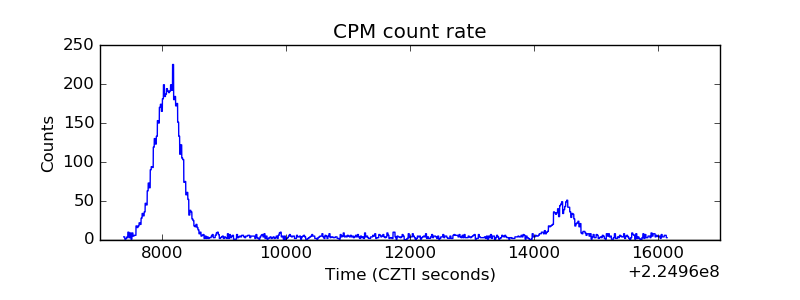 |
| CZT Counter | 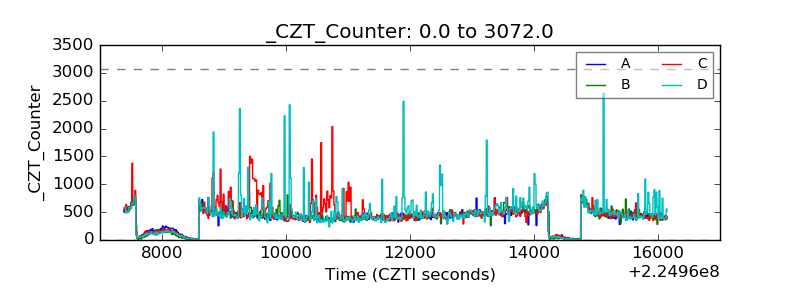 |
| +2.5 Volts monitor |  |
| +5 Volts monitor | 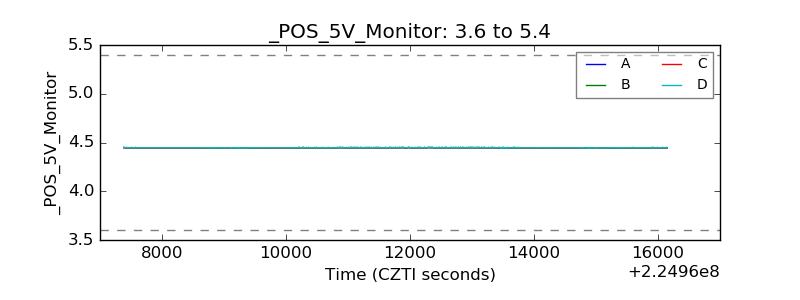 |
| _ROLL_ROT | 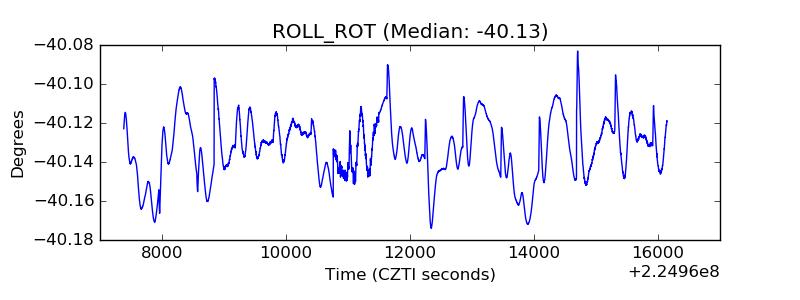 |
| _Roll_DEC | 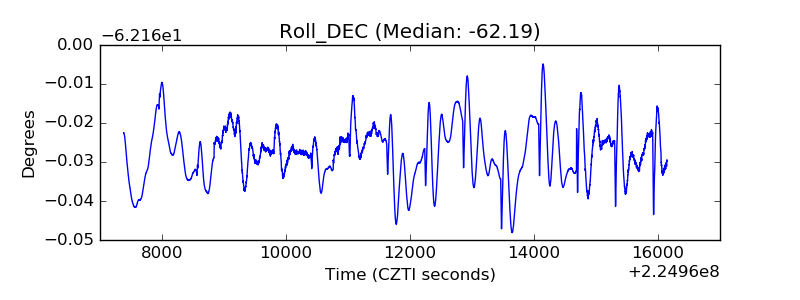 |
| _Roll_RA |  |
| Veto Counter | 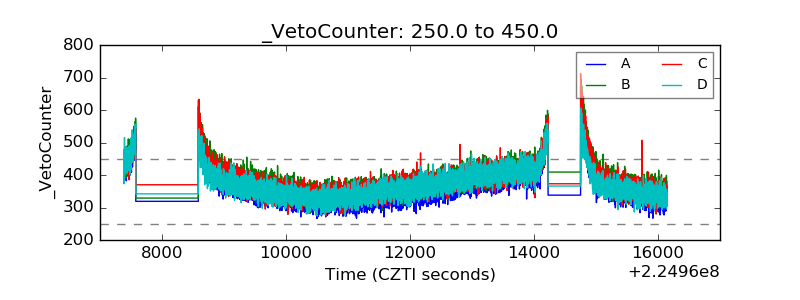 |