| Param | Original file | Final file |
|---|---|---|
| Filename | modeM0/AS1A02_134T01_9000001036_07516cztM0_level2.evt | modeM0/AS1A02_134T01_9000001036_07516cztM0_level2_quad_clean.evt |
| Size (bytes) | 536,762,880 | 110,649,600 |
| Size | 511.9 MB | 105.5 MB |
| Events in quadrant A | 3,775,771 | 708,012 |
| Events in quadrant B | 3,977,944 | 714,891 |
| Events in quadrant C | 3,760,256 | 692,503 |
| Events in quadrant D | 4,181,424 | 662,244 |
| Mode SS | |||
|---|---|---|---|
| Quadrant | BADHDUFLAG | Total packets | Discarded packets |
| A | 0 | 168 | 0 |
| B | 0 | 168 | 0 |
| C | 0 | 168 | 0 |
| D | 0 | 168 | 0 |
| Mode M0 | |||
|---|---|---|---|
| Quadrant | BADHDUFLAG | Total packets | Discarded packets |
| A | 0 | 16965 | 3 |
| B | 0 | 17454 | 2 |
| C | 0 | 17014 | 2 |
| D | 0 | 18298 | 2 |
| Mode M9 | |||
|---|---|---|---|
| Quadrant | BADHDUFLAG | Total packets | Discarded packets |
| A | 0 | 8 | 0 |
| B | 0 | 8 | 0 |
| C | 0 | 8 | 0 |
| D | 0 | 8 | 0 |
| Quadrant | Total seconds | Saturated seconds | Saturation percentage |
|---|---|---|---|
| A | 8257 | 41 | 0.496548% |
| B | 8257 | 78 | 0.944653% |
| C | 8257 | 39 | 0.472327% |
| D | 8257 | 78 | 0.944653% |
Noise dominated data is calculated using 1-second bins in cleaned event files. If a bin has >2000 counts, and if more than 50% of those come from <1% of pixels, then it is considered to be noise-dominated and hence unusable.
| Quadrant | # 1 sec bins | Bins with >0 counts | Bins with >2000 counts | High rate bins dominated by noise | Noise dominated (total time) | Noise dominated (detector-on time) | Marked lightcurve |
|---|---|---|---|---|---|---|---|
| A | 9042 | 8260 | 0 | 0 | 0.00% | 0.00% | 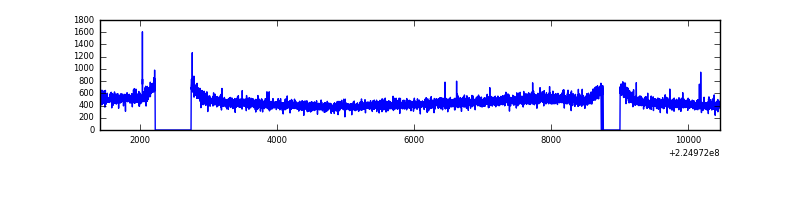 |
| B | 9042 | 8260 | 2 | 2 | 0.02% | 0.02% | 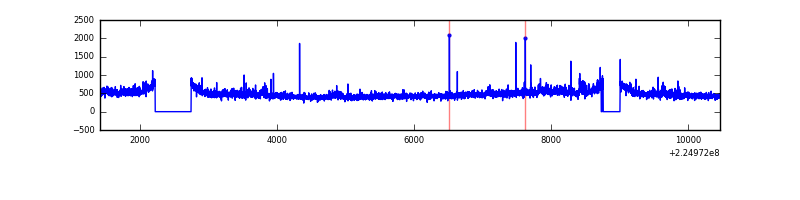 |
| C | 9042 | 8260 | 11 | 11 | 0.12% | 0.13% | 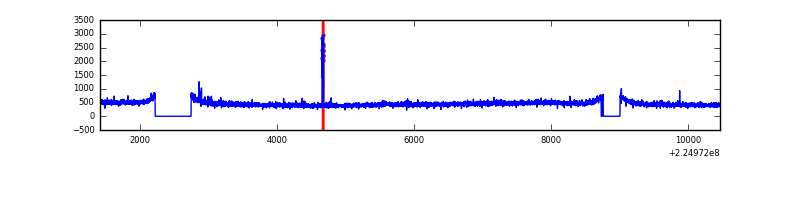 |
| D | 9042 | 8260 | 38 | 38 | 0.42% | 0.46% | 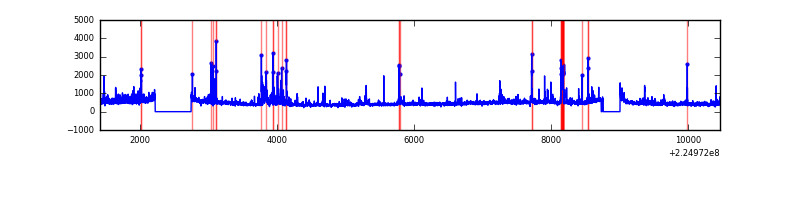 |
Top three noisy pixels from each quadrant. If the there are fewer than three noisy pixels in the level2.evt file, extra rows are filled as -1
| Pixel properties | Quadrant properties | ||||||
|---|---|---|---|---|---|---|---|
| Quadrant | DetID | PixID | Counts | Sigma | Mean | Median | Sigma |
| A | 13 | 14 | 14904 | 69.73 | 973 | 951 | 200.1 |
| A | 0 | 226 | 9402 | 42.23 | 973 | 951 | 200.1 |
| A | 12 | 194 | 8696 | 38.71 | 973 | 951 | 200.1 |
| B | 0 | 214 | 111556 | 591.62 | 981 | 954 | 186.9 |
| B | 0 | 219 | 38314 | 199.84 | 981 | 954 | 186.9 |
| B | 12 | 111 | 18075 | 91.58 | 981 | 954 | 186.9 |
| C | 9 | 68 | 52976 | 239.8 | 940 | 944 | 217.0 |
| C | 8 | 229 | 33607 | 150.53 | 940 | 944 | 217.0 |
| C | 13 | 61 | 7185 | 28.76 | 940 | 944 | 217.0 |
| D | 2 | 152 | 327535 | 1416.83 | 936 | 904 | 230.5 |
| D | 2 | 14 | 82622 | 354.47 | 936 | 904 | 230.5 |
| D | 1 | 52 | 67031 | 286.84 | 936 | 904 | 230.5 |
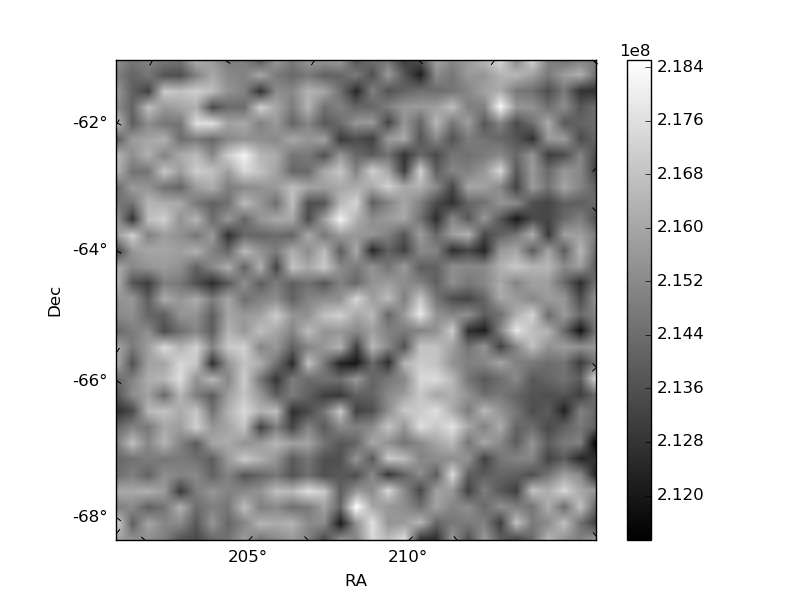
Histogram calculated using DETX and DETY for each event in the final _common_clean file
| Quadrant A | 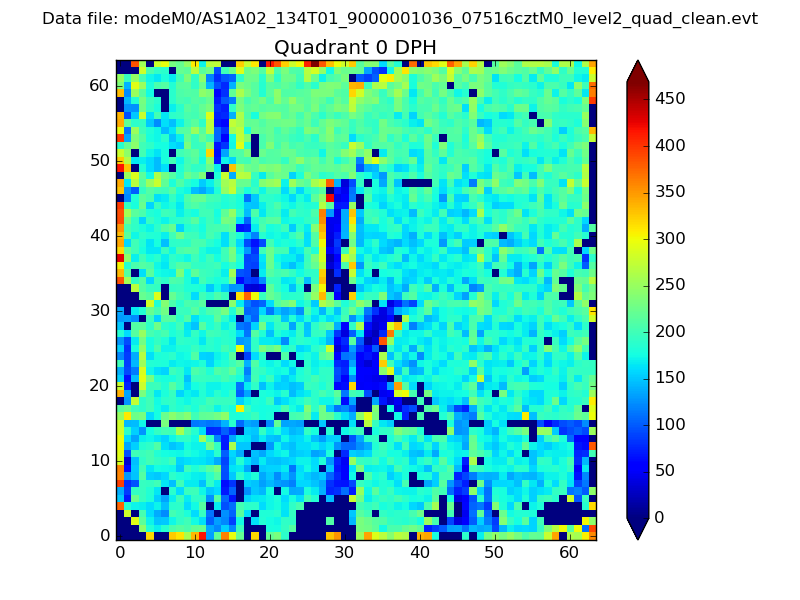 |
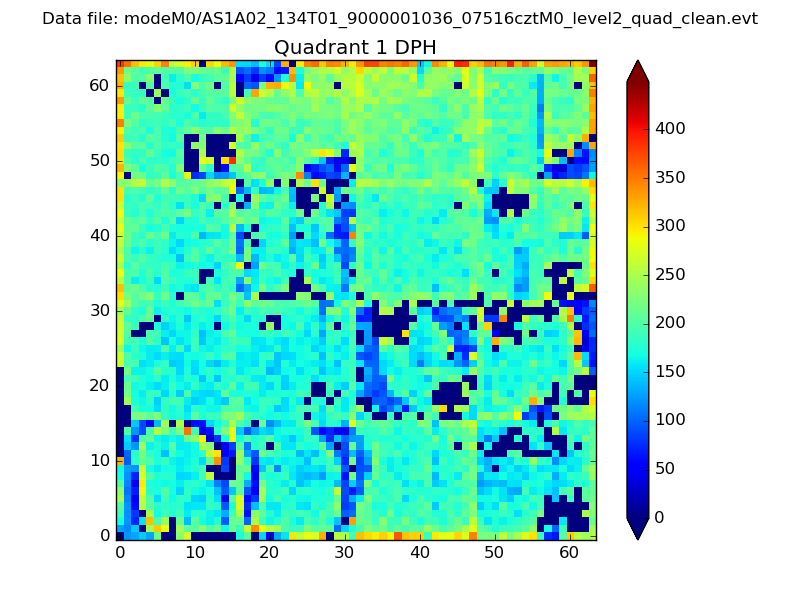 |
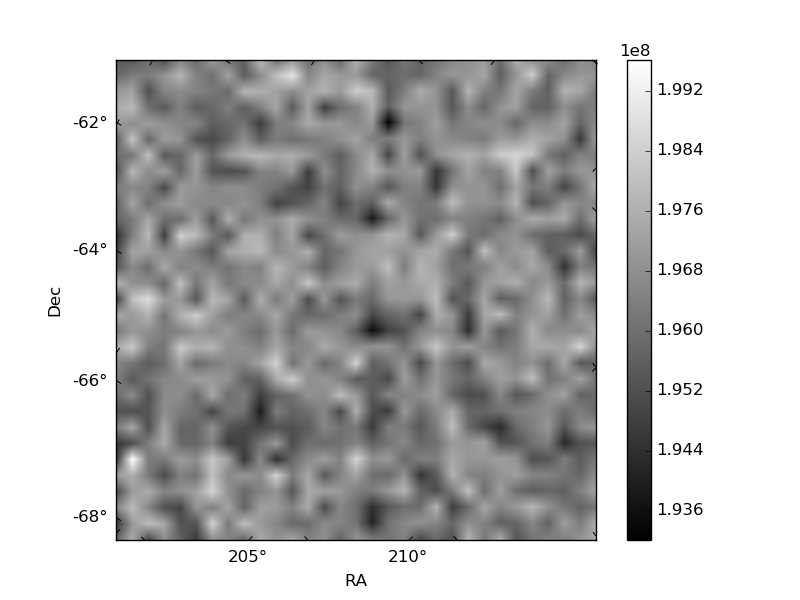
Quadrant B |
|---|---|---|---|
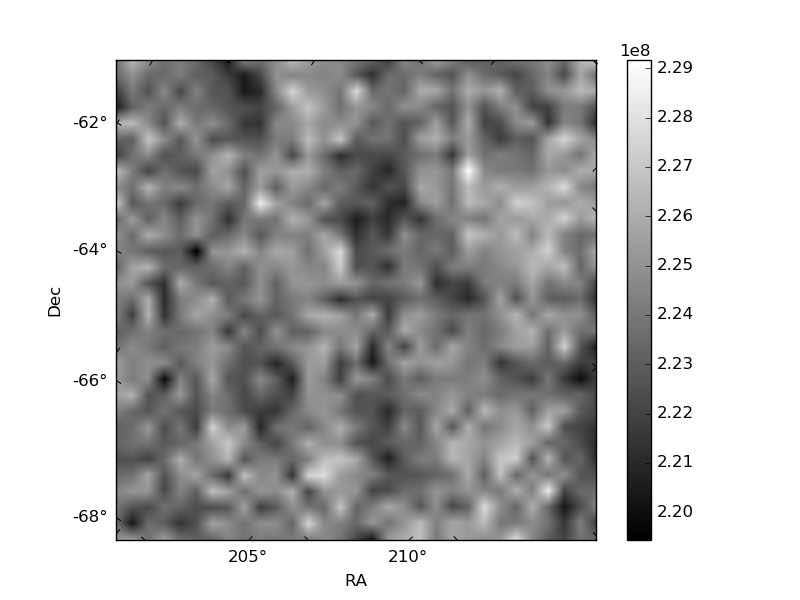
| Quadrant D | 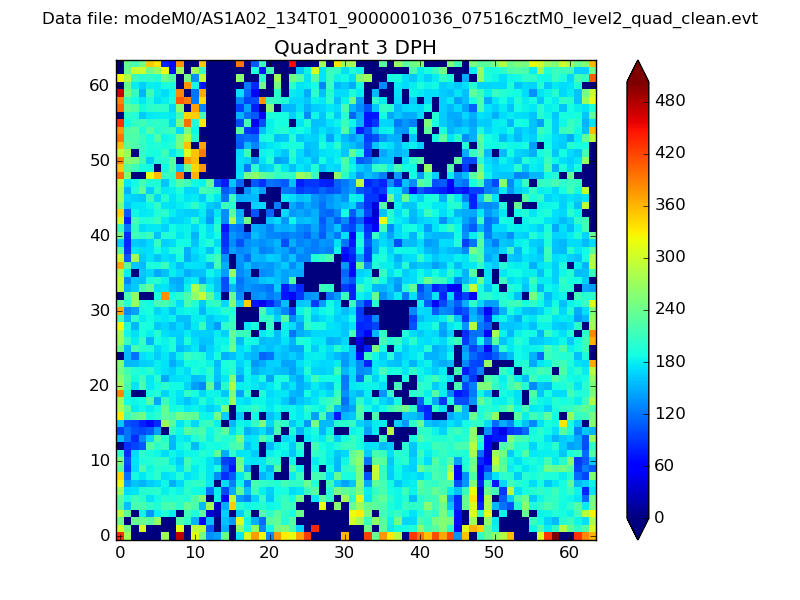 |
 |
Quadrant C |
| Plot type | Count rate plots | Images |
|---|---|---|
| Comparison with Poisson distribution Blue bars denote a histogram of data divided into 1 sec bins. Red curve is a Poisson curve with rate = median count rate of data. |
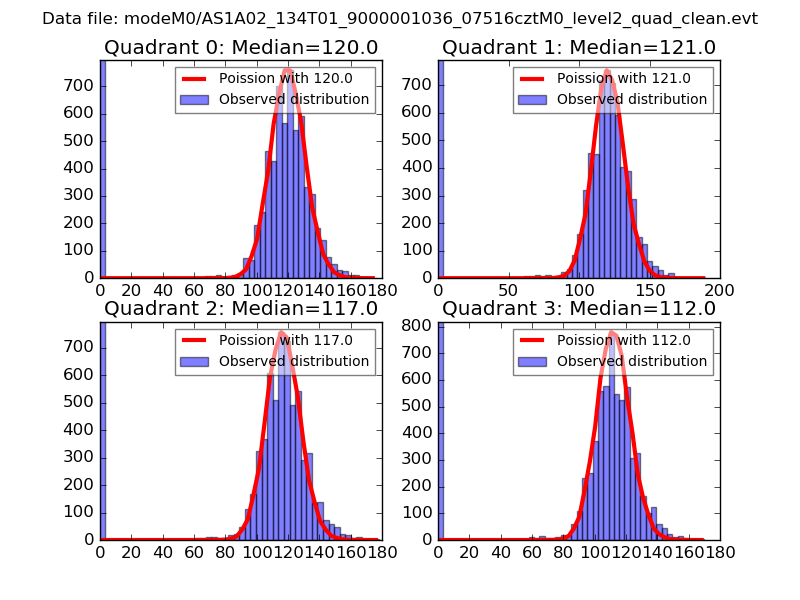 |
 |
| Quadrant-wise count rates Data is divided into 100 sec bins |
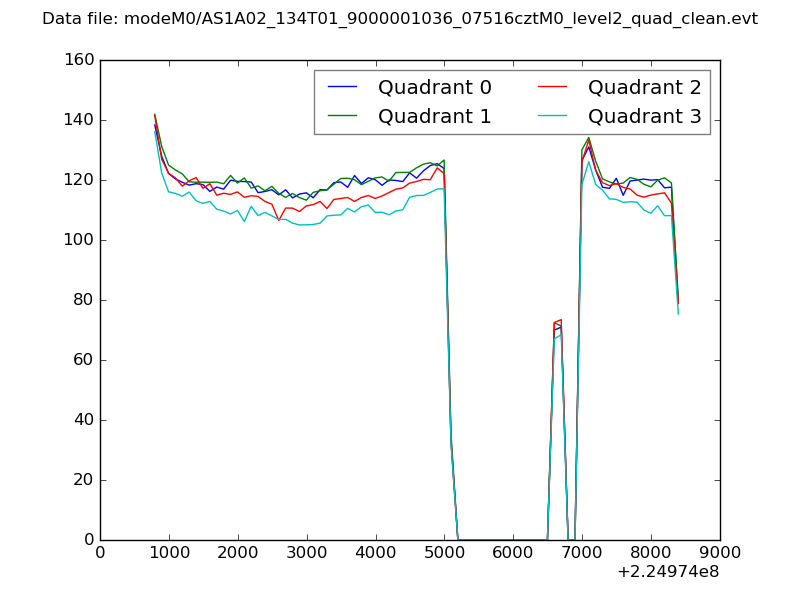 |
|
| Module-wise count rates for Quadrant A Data is divided into 100 sec bins |
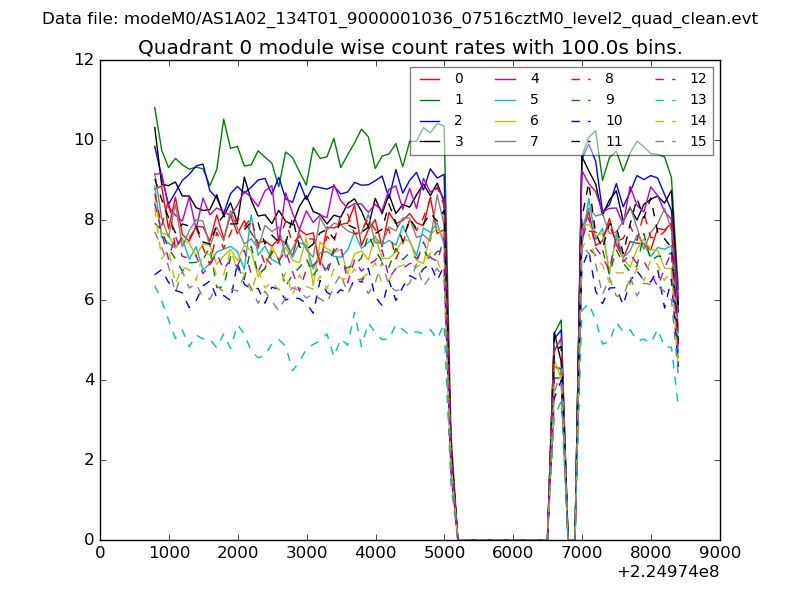 |
 |
| Module-wise count rates for Quadrant B Data is divided into 100 sec bins |
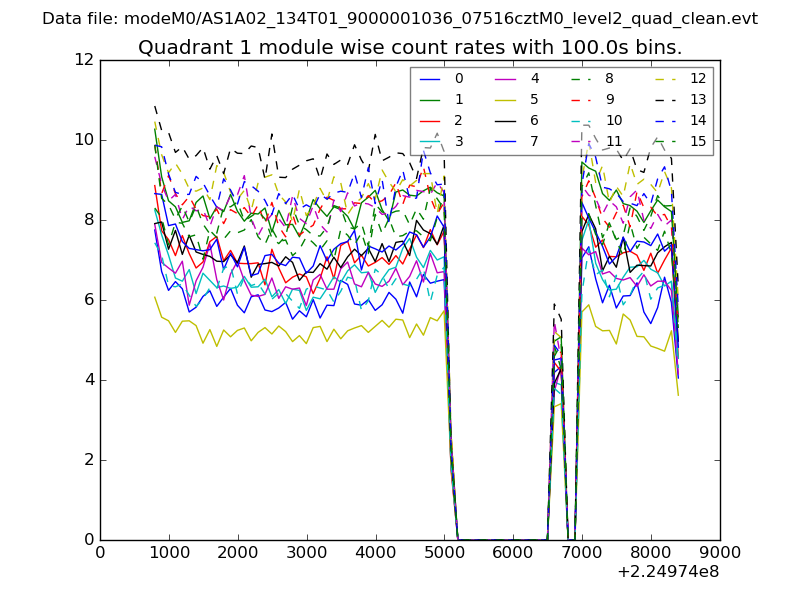 |
 |
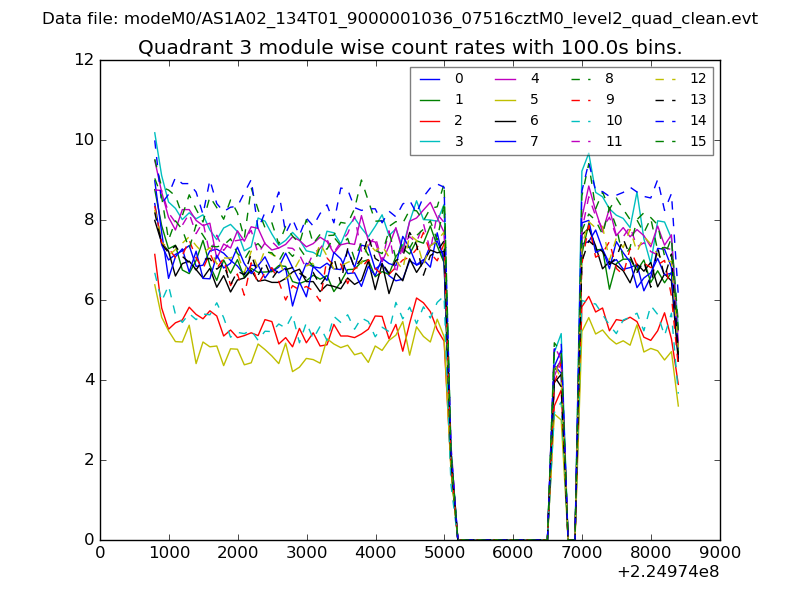
| Module-wise count rates for Quadrant C Data is divided into 100 sec bins |
 |
 |
| Module-wise count rates for Quadrant D Data is divided into 100 sec bins |
 |
 |
| Parameter | Plot |
|---|---|
| CZT HV Monitor | 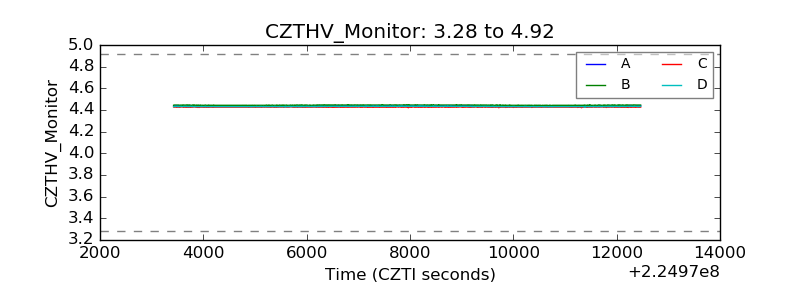 |
| D_VDD | 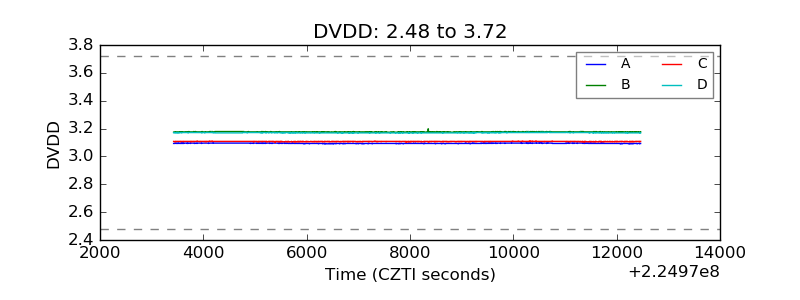 |
| Temperature 1 | 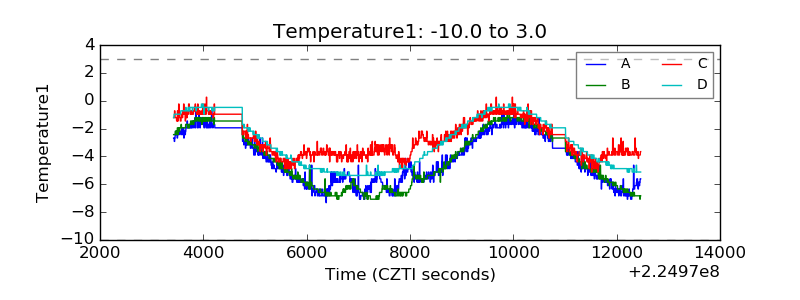 |
| Veto HV Monitor | 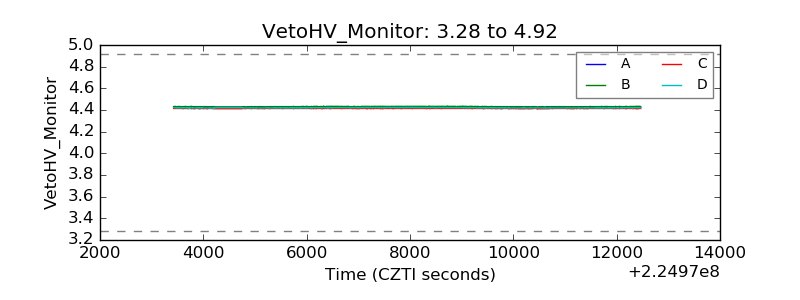 |
| Veto LLD | 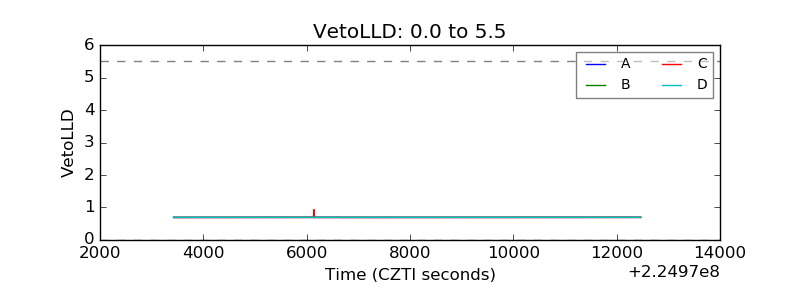 |
| Alpha Counter | 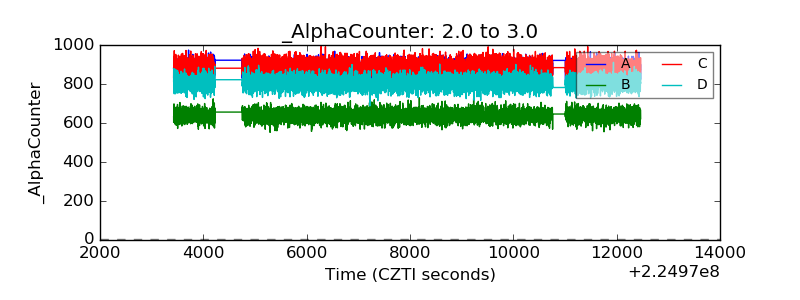 |
| _CPM_Rate | 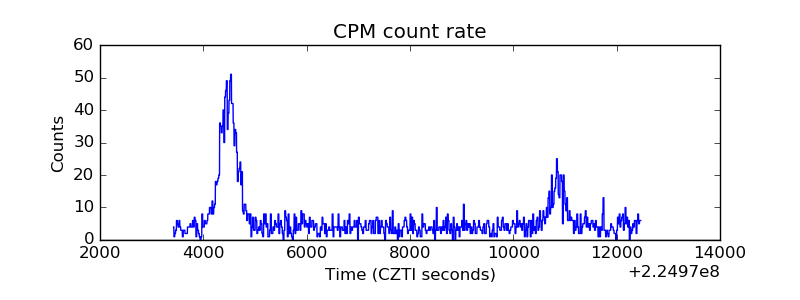 |
| CZT Counter |  |
| +2.5 Volts monitor |  |
| +5 Volts monitor | 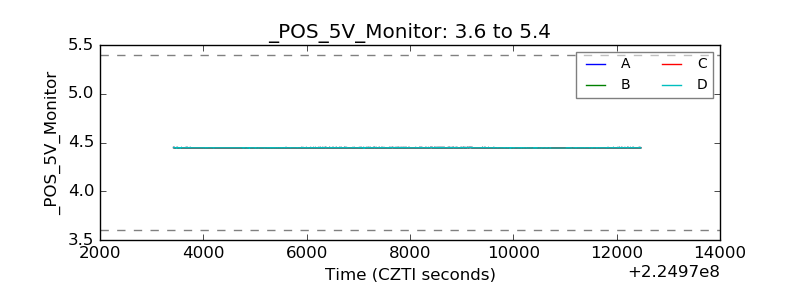 |
| _ROLL_ROT | 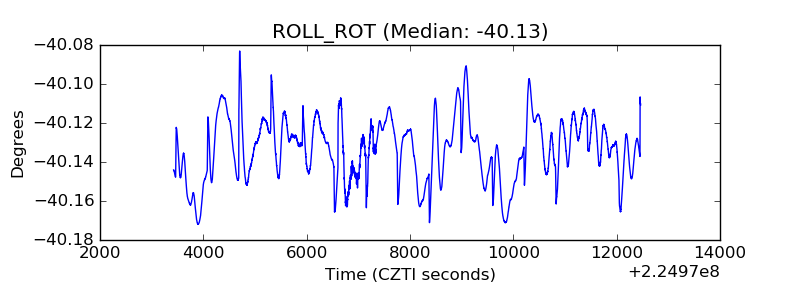 |
| _Roll_DEC | 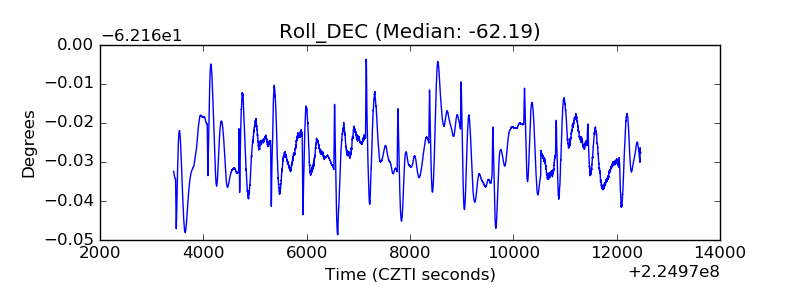 |
| _Roll_RA |  |
| Veto Counter | 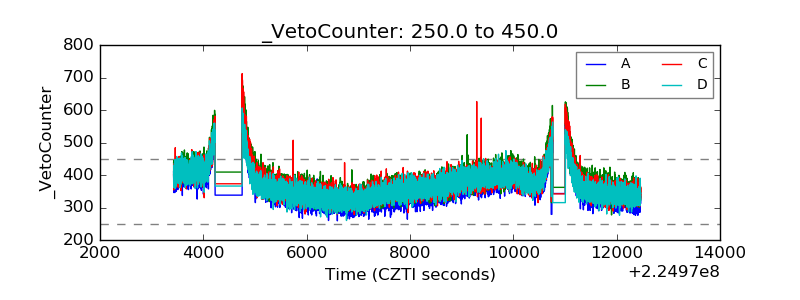 |