| Param | Original file | Final file |
|---|---|---|
| Filename | modeM0/AS1A02_134T01_9000001036_07517cztM0_level2.evt | modeM0/AS1A02_134T01_9000001036_07517cztM0_level2_quad_clean.evt |
| Size (bytes) | 257,607,360 | 54,861,120 |
| Size | 245.7 MB | 52.3 MB |
| Events in quadrant A | 1,793,463 | 351,511 |
| Events in quadrant B | 1,917,422 | 355,849 |
| Events in quadrant C | 1,805,427 | 343,907 |
| Events in quadrant D | 2,011,579 | 327,517 |
| Mode SS | |||
|---|---|---|---|
| Quadrant | BADHDUFLAG | Total packets | Discarded packets |
| A | 0 | 80 | 0 |
| B | 0 | 80 | 0 |
| C | 0 | 80 | 0 |
| D | 0 | 80 | 0 |
| Mode M0 | |||
|---|---|---|---|
| Quadrant | BADHDUFLAG | Total packets | Discarded packets |
| A | 0 | 8217 | 2 |
| B | 0 | 8547 | 1 |
| C | 0 | 8265 | 1 |
| D | 0 | 8906 | 1 |
| Mode M9 | |||
|---|---|---|---|
| Quadrant | BADHDUFLAG | Total packets | Discarded packets |
| A | 0 | 3 | 0 |
| B | 0 | 3 | 0 |
| C | 0 | 3 | 0 |
| D | 0 | 3 | 0 |
| Quadrant | Total seconds | Saturated seconds | Saturation percentage |
|---|---|---|---|
| A | 4007 | 10 | 0.249563% |
| B | 4007 | 23 | 0.573996% |
| C | 4007 | 19 | 0.474170% |
| D | 4007 | 55 | 1.372598% |
Noise dominated data is calculated using 1-second bins in cleaned event files. If a bin has >2000 counts, and if more than 50% of those come from <1% of pixels, then it is considered to be noise-dominated and hence unusable.
| Quadrant | # 1 sec bins | Bins with >0 counts | Bins with >2000 counts | High rate bins dominated by noise | Noise dominated (total time) | Noise dominated (detector-on time) | Marked lightcurve |
|---|---|---|---|---|---|---|---|
| A | 4267 | 4009 | 0 | 0 | 0.00% | 0.00% | 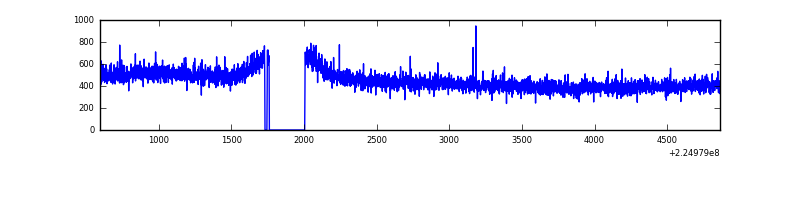 |
| B | 4267 | 4009 | 1 | 1 | 0.02% | 0.02% | 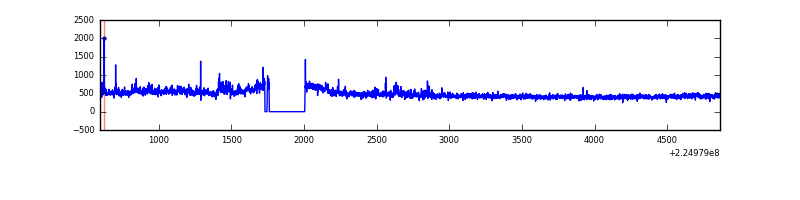 |
| C | 4267 | 4009 | 2 | 2 | 0.05% | 0.05% | 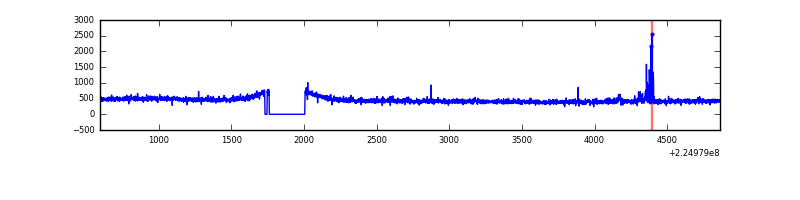 |
| D | 4267 | 4009 | 32 | 32 | 0.75% | 0.80% | 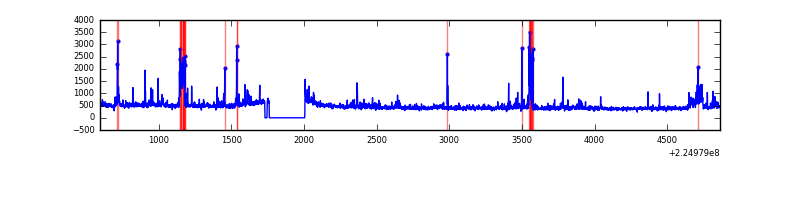 |
Top three noisy pixels from each quadrant. If the there are fewer than three noisy pixels in the level2.evt file, extra rows are filled as -1
| Pixel properties | Quadrant properties | ||||||
|---|---|---|---|---|---|---|---|
| Quadrant | DetID | PixID | Counts | Sigma | Mean | Median | Sigma |
| A | 13 | 14 | 4728 | 43.84 | 463 | 452 | 97.5 |
| A | 0 | 226 | 4461 | 41.11 | 463 | 452 | 97.5 |
| A | 12 | 194 | 4045 | 36.84 | 463 | 452 | 97.5 |
| B | 0 | 214 | 73360 | 801.7 | 470 | 458 | 90.9 |
| B | 0 | 219 | 11984 | 126.75 | 470 | 458 | 90.9 |
| B | 12 | 111 | 8540 | 88.88 | 470 | 458 | 90.9 |
| C | 9 | 68 | 35811 | 335.9 | 449 | 448 | 105.3 |
| C | 8 | 229 | 14910 | 137.37 | 449 | 448 | 105.3 |
| C | 13 | 61 | 3394 | 27.98 | 449 | 448 | 105.3 |
| D | 2 | 14 | 121725 | 1095.37 | 444 | 429 | 110.7 |
| D | 2 | 152 | 69565 | 624.34 | 444 | 429 | 110.7 |
| D | 5 | 184 | 47893 | 428.63 | 444 | 429 | 110.7 |
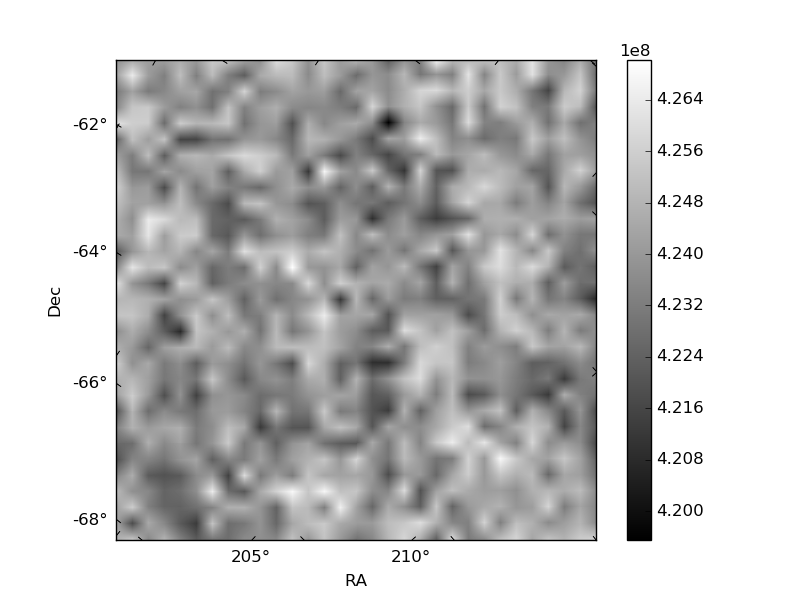
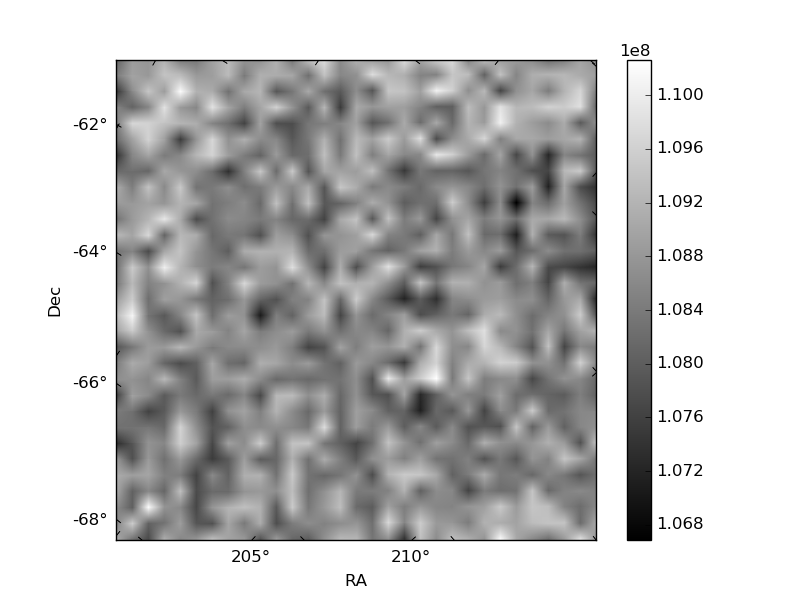
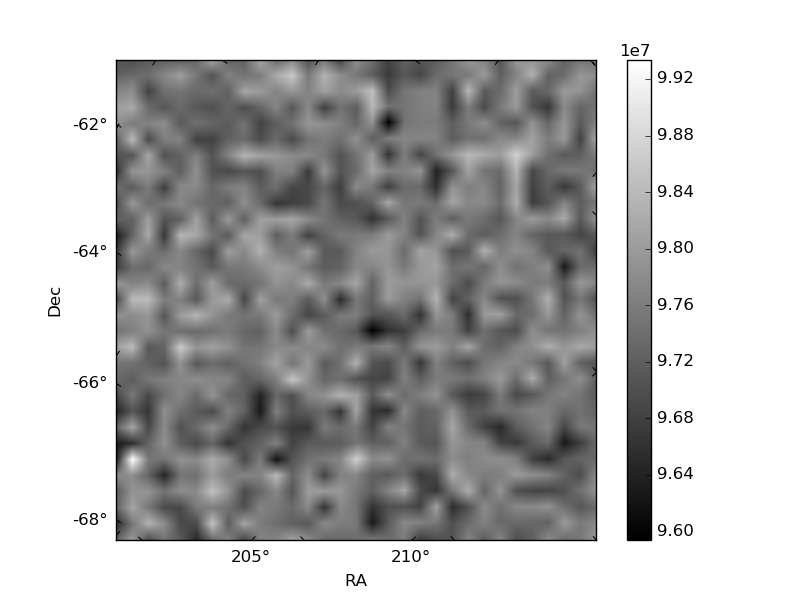
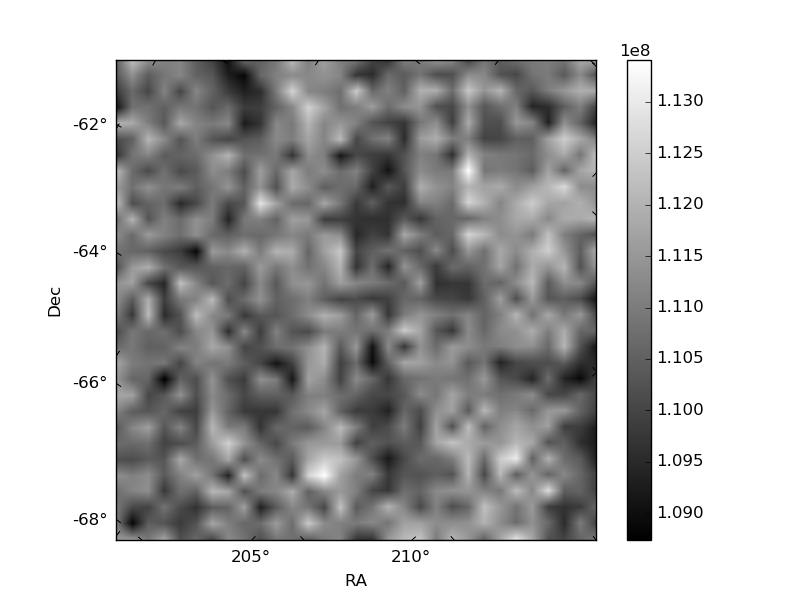
Histogram calculated using DETX and DETY for each event in the final _common_clean file
| Quadrant A | 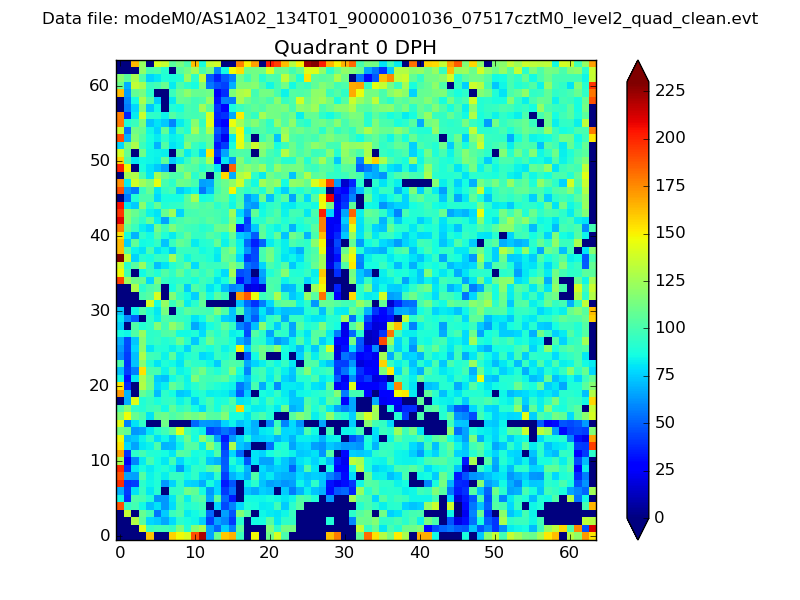 |
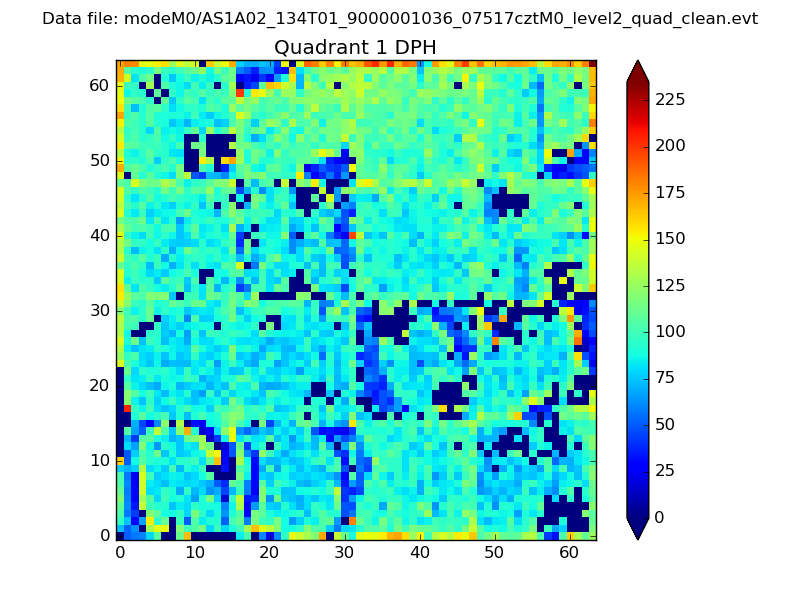 |
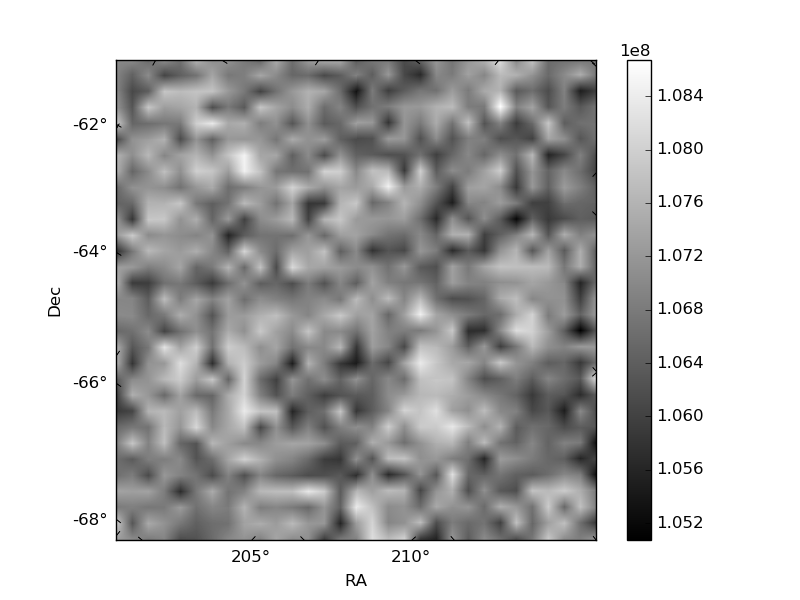
Quadrant B |
|---|---|---|---|
| Quadrant D | 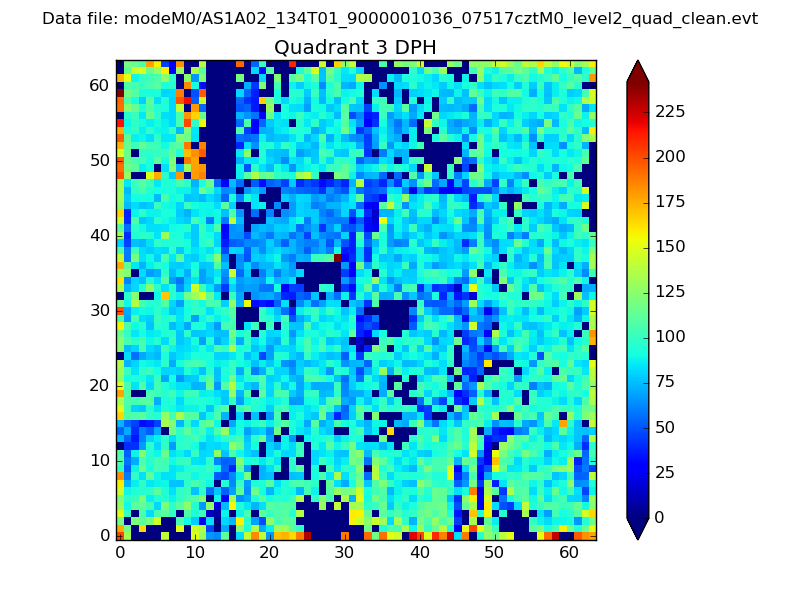 |
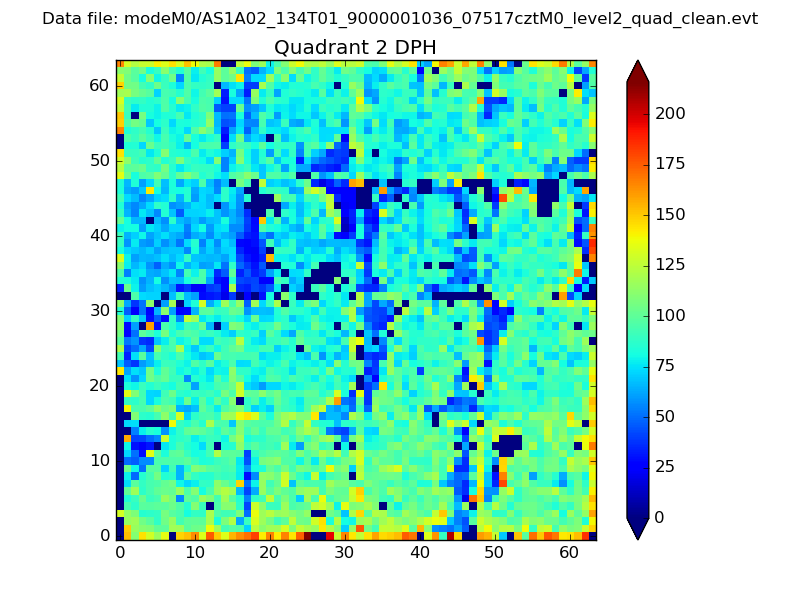 |
Quadrant C |
| Plot type | Count rate plots | Images |
|---|---|---|
| Comparison with Poisson distribution Blue bars denote a histogram of data divided into 1 sec bins. Red curve is a Poisson curve with rate = median count rate of data. |
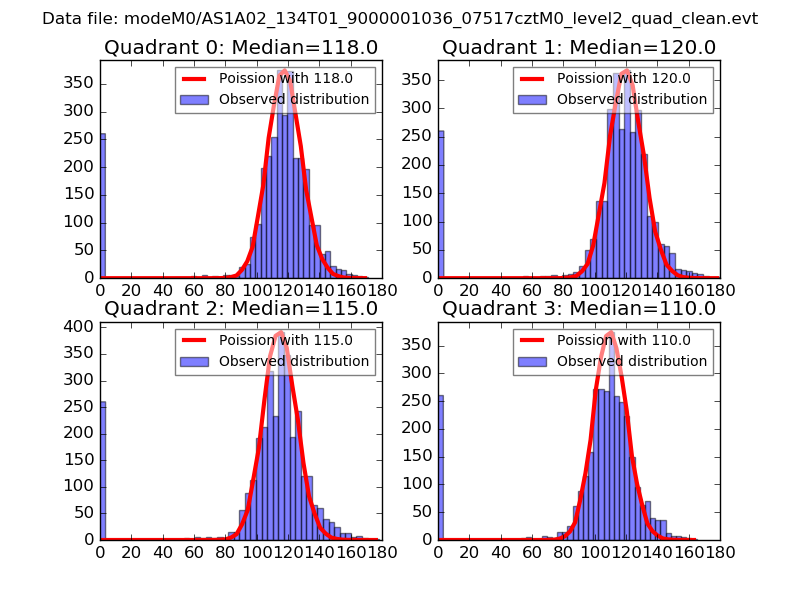 |
 |
| Quadrant-wise count rates Data is divided into 100 sec bins |
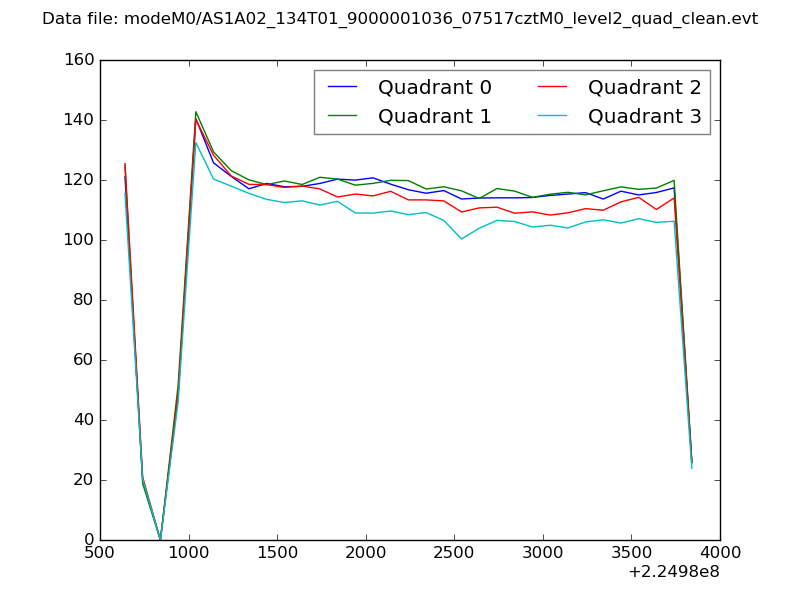 |
|
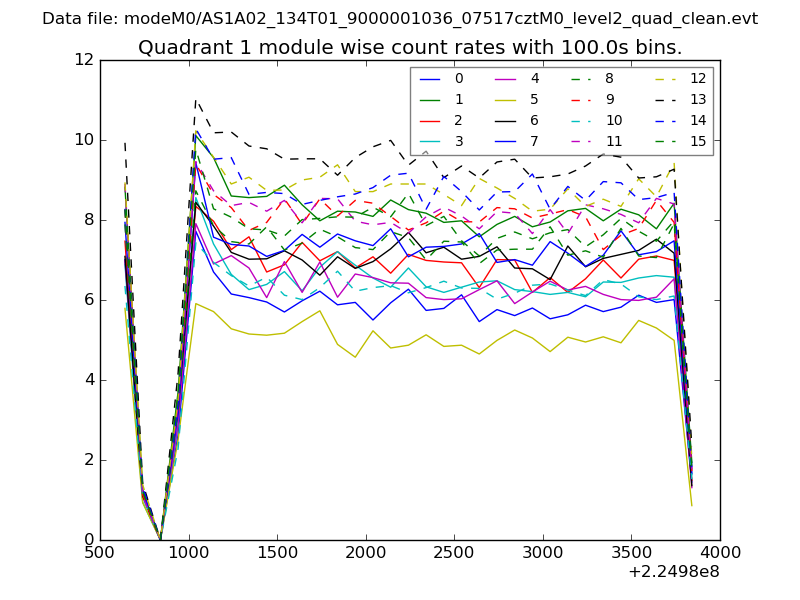
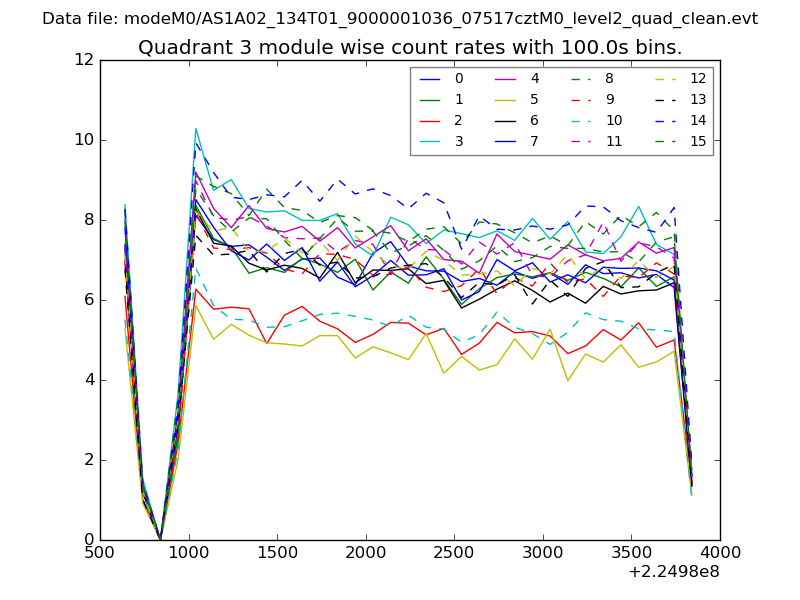
| Module-wise count rates for Quadrant A Data is divided into 100 sec bins |
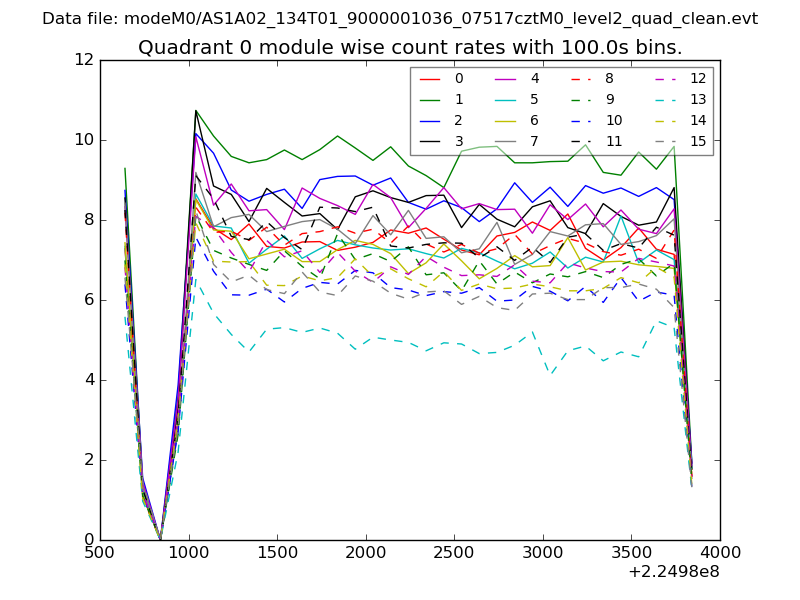 |
 |
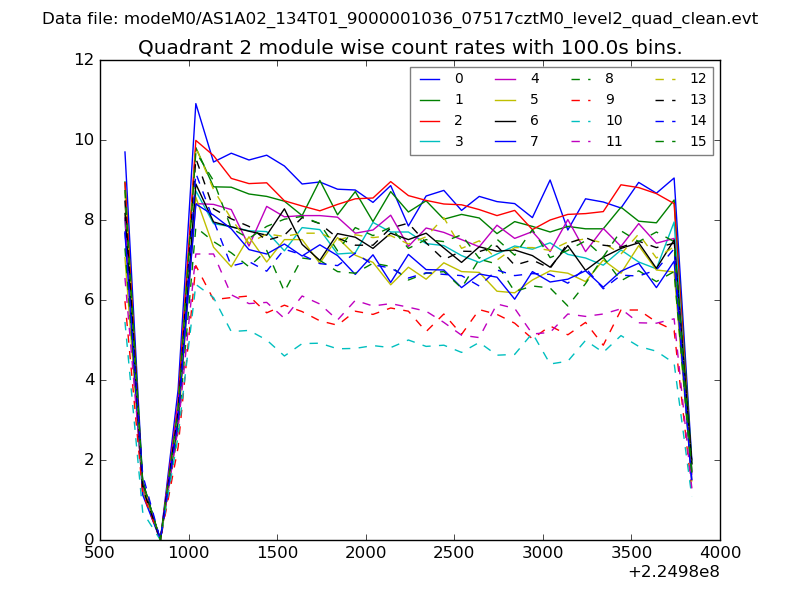
| Module-wise count rates for Quadrant B Data is divided into 100 sec bins |
 |
 |
| Module-wise count rates for Quadrant C Data is divided into 100 sec bins |
 |
 |
| Module-wise count rates for Quadrant D Data is divided into 100 sec bins |
 |
 |
| Parameter | Plot |
|---|---|
| CZT HV Monitor | 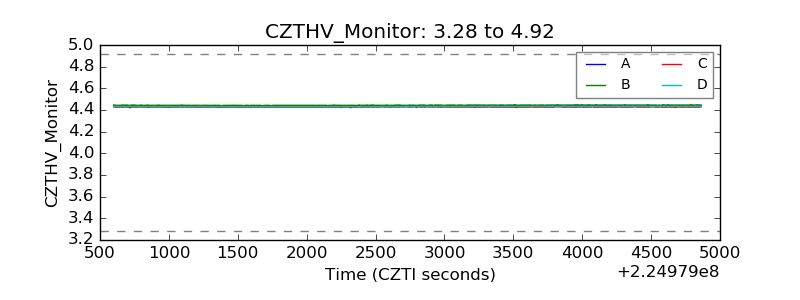 |
| D_VDD | 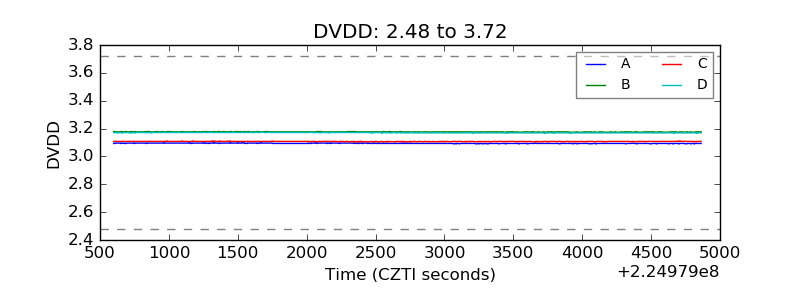 |
| Temperature 1 | 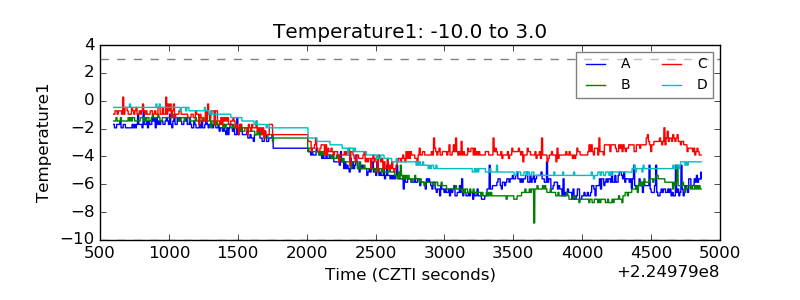 |
| Veto HV Monitor | 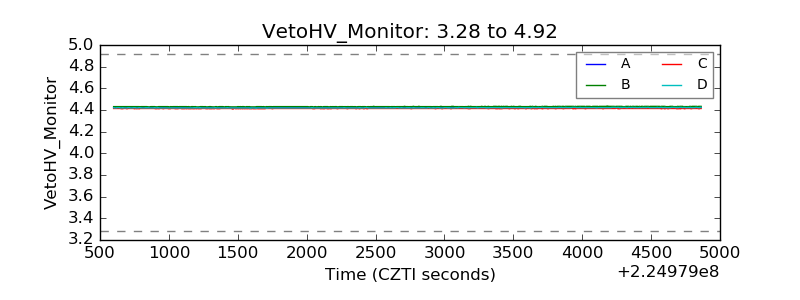 |
| Veto LLD |  |
| Alpha Counter | 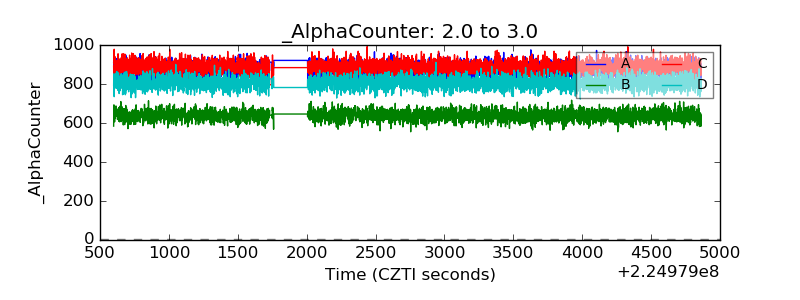 |
| _CPM_Rate | 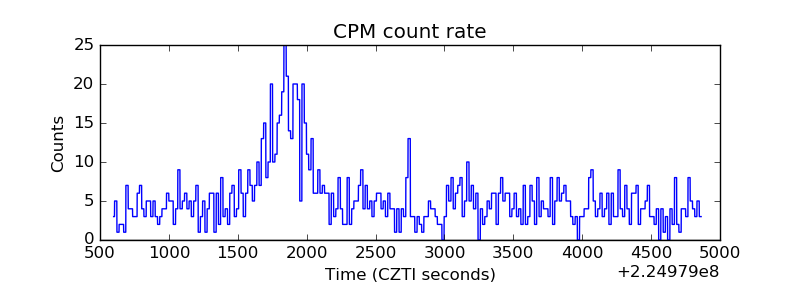 |
| CZT Counter | 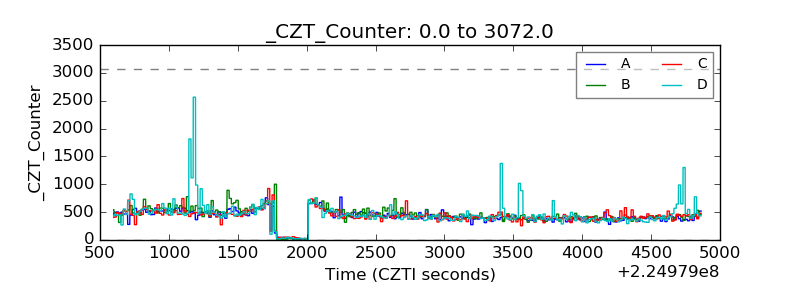 |
| +2.5 Volts monitor |  |
| +5 Volts monitor |  |
| _ROLL_ROT | 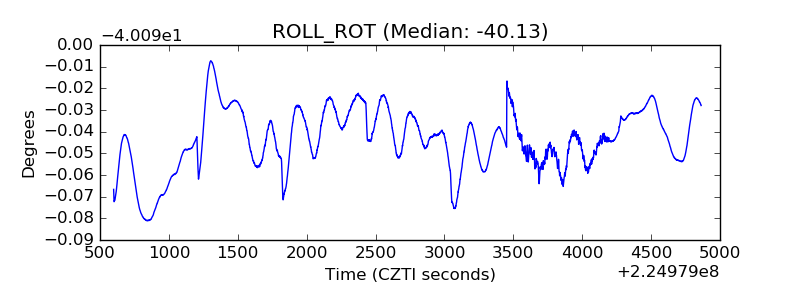 |
| _Roll_DEC | 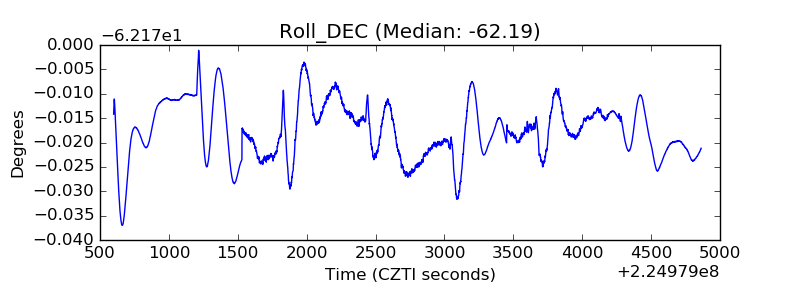 |
| _Roll_RA | 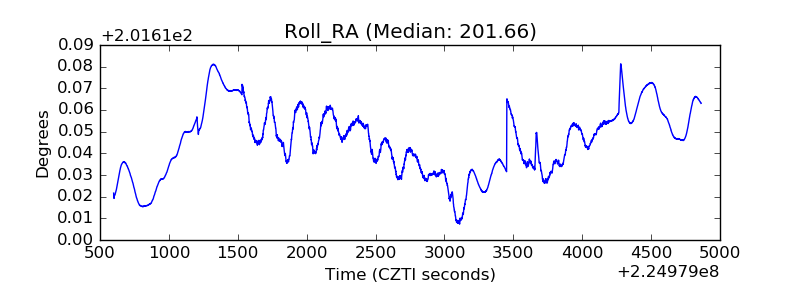 |
| Veto Counter | 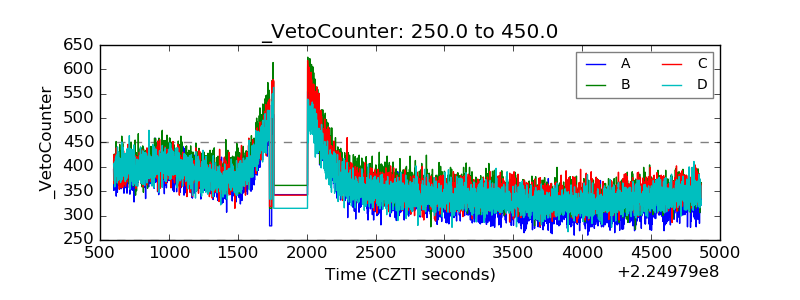 |