| Param | Original file | Final file |
|---|---|---|
| Filename | modeM0/AS1A02_134T01_9000001036_07523cztM0_level2.evt | modeM0/AS1A02_134T01_9000001036_07523cztM0_level2_quad_clean.evt |
| Size (bytes) | 1,941,307,200 | 385,920,000 |
| Size | 1.8 GB | 368.0 MB |
| Events in quadrant A | 13,378,195 | 2,456,111 |
| Events in quadrant B | 13,535,336 | 2,488,633 |
| Events in quadrant C | 13,140,244 | 2,418,983 |
| Events in quadrant D | 16,741,454 | 2,294,048 |
| Mode SS | |||
|---|---|---|---|
| Quadrant | BADHDUFLAG | Total packets | Discarded packets |
| A | 0 | 608 | 0 |
| B | 0 | 608 | 0 |
| C | 0 | 608 | 0 |
| D | 0 | 608 | 0 |
| Mode M0 | |||
|---|---|---|---|
| Quadrant | BADHDUFLAG | Total packets | Discarded packets |
| A | 0 | 60011 | 5 |
| B | 0 | 60296 | 5 |
| C | 0 | 59997 | 5 |
| D | 0 | 70726 | 5 |
| Mode M9 | |||
|---|---|---|---|
| Quadrant | BADHDUFLAG | Total packets | Discarded packets |
| A | 0 | 29 | 0 |
| B | 0 | 29 | 0 |
| C | 0 | 29 | 0 |
| D | 0 | 29 | 0 |
| Quadrant | Total seconds | Saturated seconds | Saturation percentage |
|---|---|---|---|
| A | 29531 | 96 | 0.325082% |
| B | 29531 | 121 | 0.409739% |
| C | 29531 | 109 | 0.369104% |
| D | 29531 | 493 | 1.669432% |
Noise dominated data is calculated using 1-second bins in cleaned event files. If a bin has >2000 counts, and if more than 50% of those come from <1% of pixels, then it is considered to be noise-dominated and hence unusable.
| Quadrant | # 1 sec bins | Bins with >0 counts | Bins with >2000 counts | High rate bins dominated by noise | Noise dominated (total time) | Noise dominated (detector-on time) | Marked lightcurve |
|---|---|---|---|---|---|---|---|
| A | 32751 | 29536 | 19 | 19 | 0.06% | 0.06% | 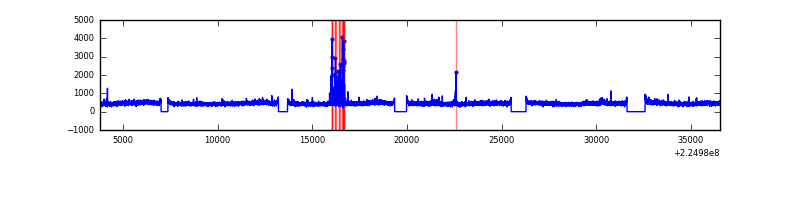 |
| B | 32751 | 29536 | 7 | 7 | 0.02% | 0.02% | 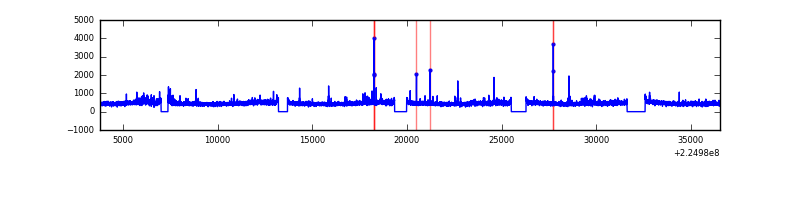 |
| C | 32751 | 29536 | 10 | 10 | 0.03% | 0.03% | 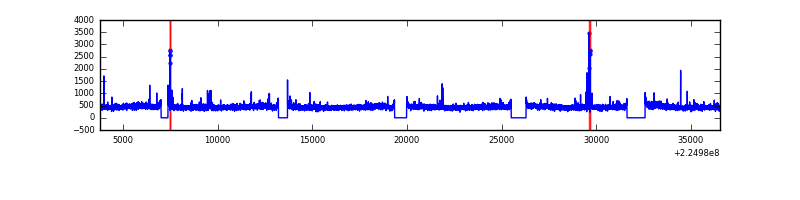 |
| D | 32751 | 29536 | 338 | 338 | 1.03% | 1.14% | 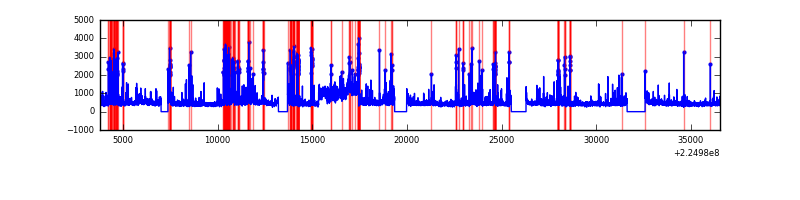 |
Top three noisy pixels from each quadrant. If the there are fewer than three noisy pixels in the level2.evt file, extra rows are filled as -1
| Pixel properties | Quadrant properties | ||||||
|---|---|---|---|---|---|---|---|
| Quadrant | DetID | PixID | Counts | Sigma | Mean | Median | Sigma |
| A | 13 | 248 | 169320 | 241.82 | 3394 | 3318 | 686.5 |
| A | 13 | 14 | 80035 | 111.76 | 3394 | 3318 | 686.5 |
| A | 8 | 15 | 69417 | 96.29 | 3394 | 3318 | 686.5 |
| B | 0 | 214 | 179043 | 273.84 | 3412 | 3326 | 641.7 |
| B | 12 | 111 | 64147 | 94.78 | 3412 | 3326 | 641.7 |
| B | 0 | 219 | 52757 | 77.03 | 3412 | 3326 | 641.7 |
| C | 8 | 229 | 126863 | 163.15 | 3300 | 3307 | 757.3 |
| C | 9 | 68 | 80868 | 102.42 | 3300 | 3307 | 757.3 |
| C | 10 | 22 | 26666 | 30.84 | 3300 | 3307 | 757.3 |
| D | 5 | 233 | 1572229 | 1979.03 | 3279 | 3182 | 792.8 |
| D | 14 | 34 | 1287799 | 1620.28 | 3279 | 3182 | 792.8 |
| D | 5 | 184 | 389437 | 487.18 | 3279 | 3182 | 792.8 |
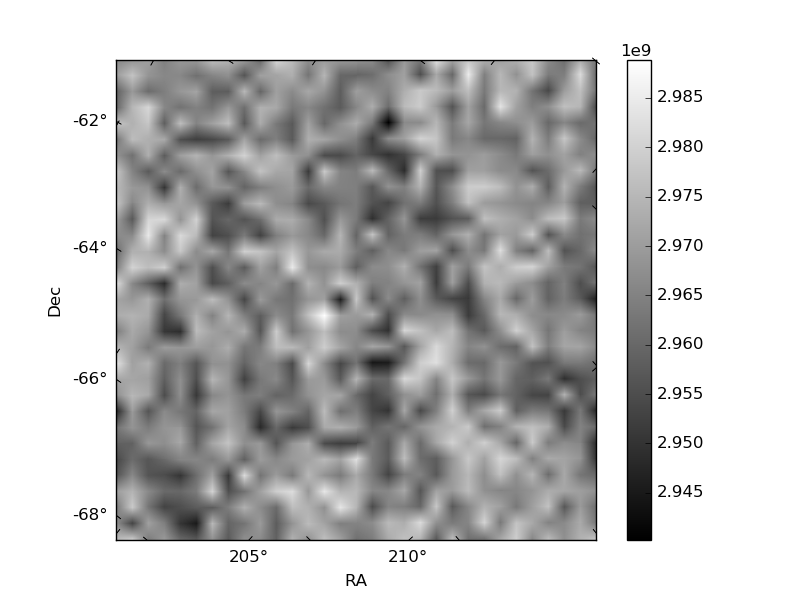
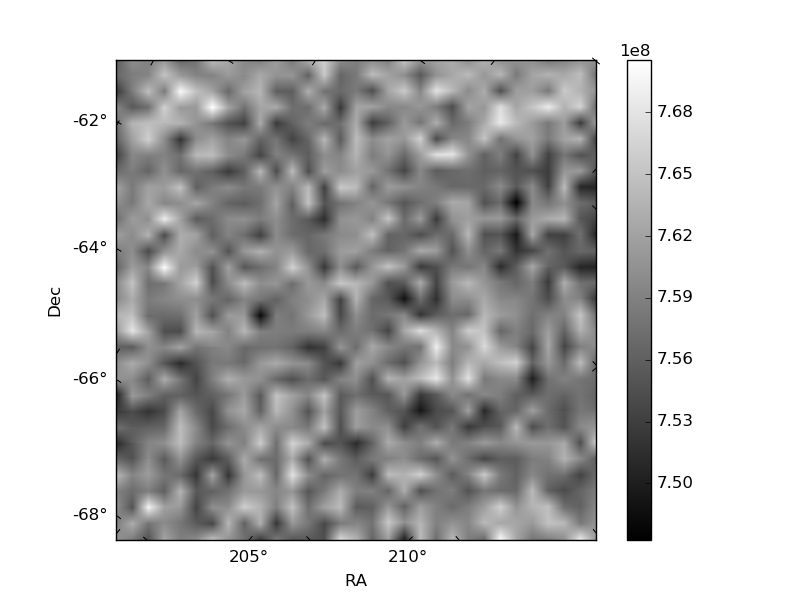
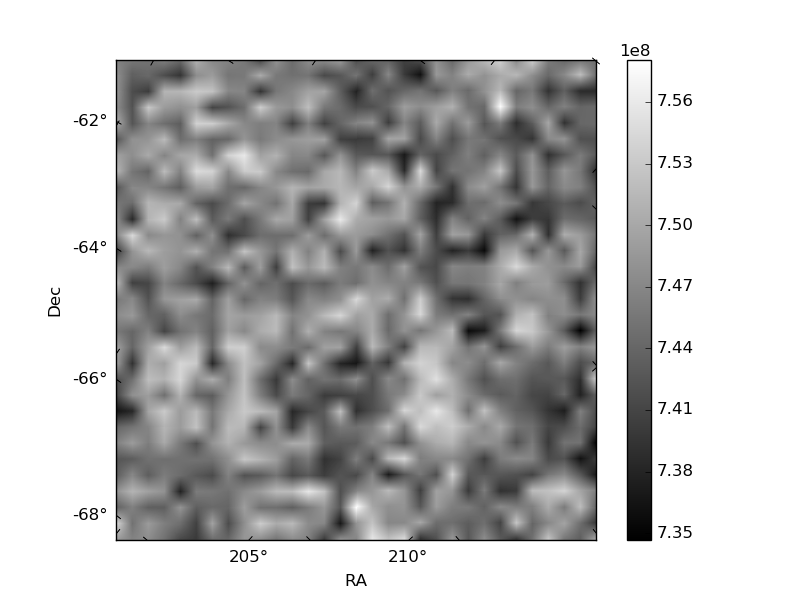
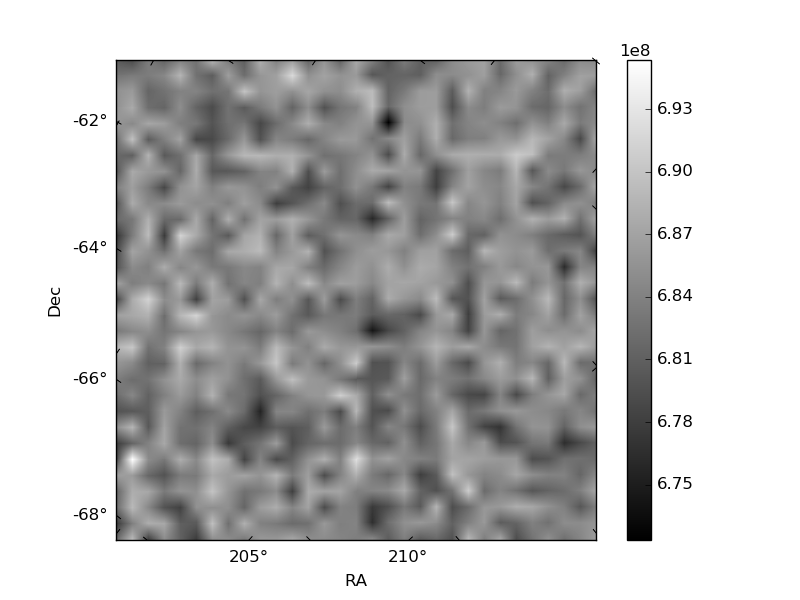
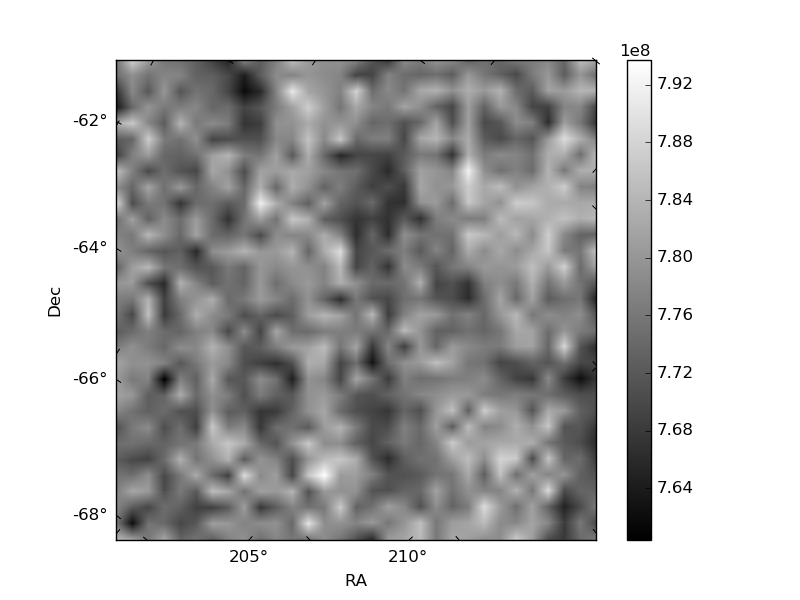
Histogram calculated using DETX and DETY for each event in the final _common_clean file
| Quadrant A | 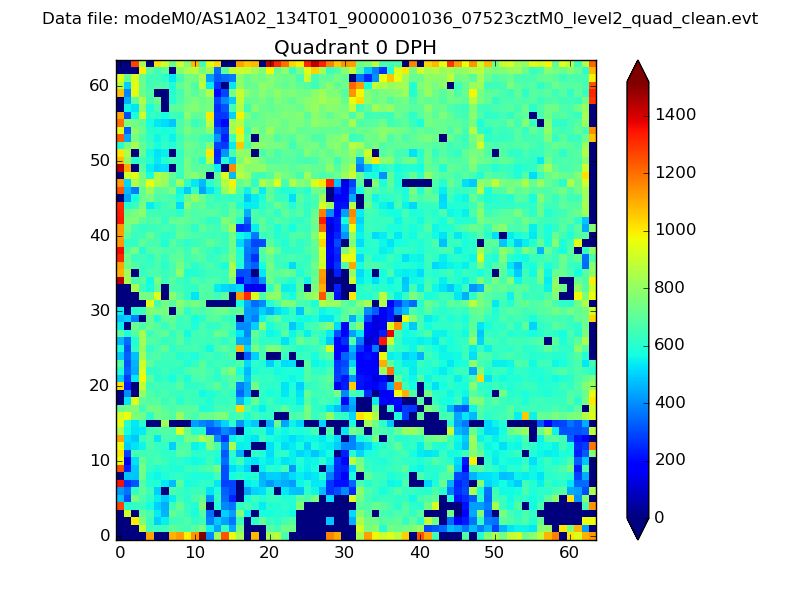 |
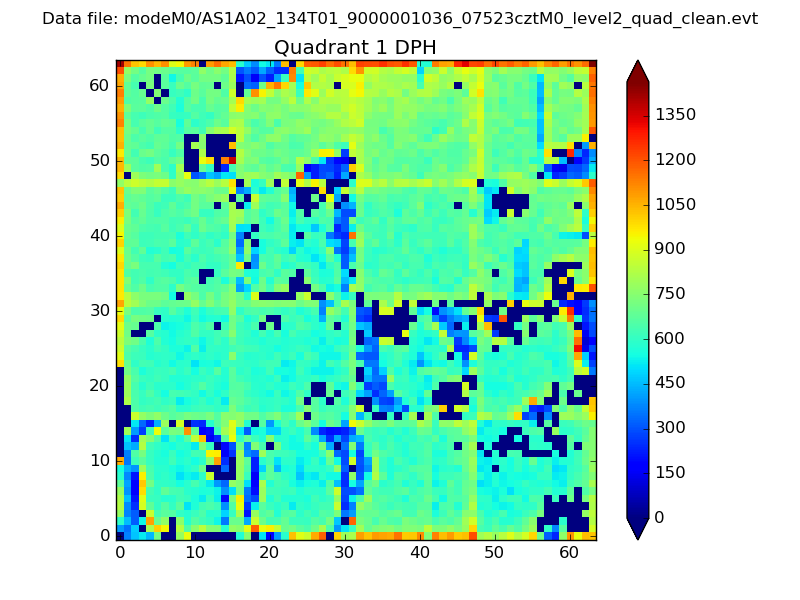 |
Quadrant B |
|---|---|---|---|
| Quadrant D | 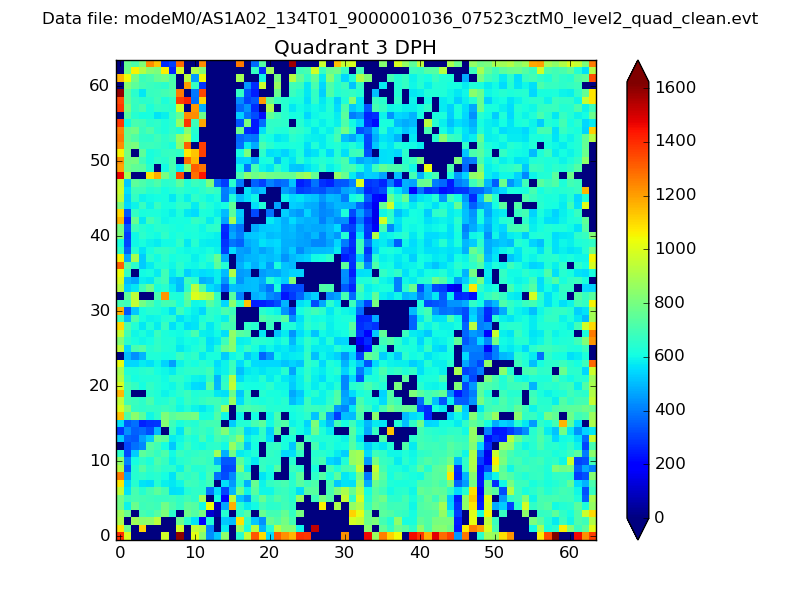 |
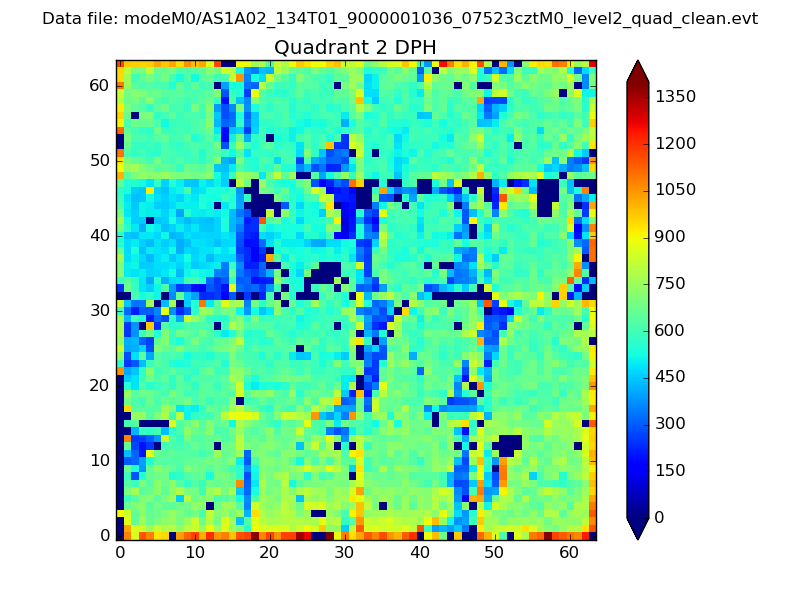 |
Quadrant C |
| Plot type | Count rate plots | Images |
|---|---|---|
| Comparison with Poisson distribution Blue bars denote a histogram of data divided into 1 sec bins. Red curve is a Poisson curve with rate = median count rate of data. |
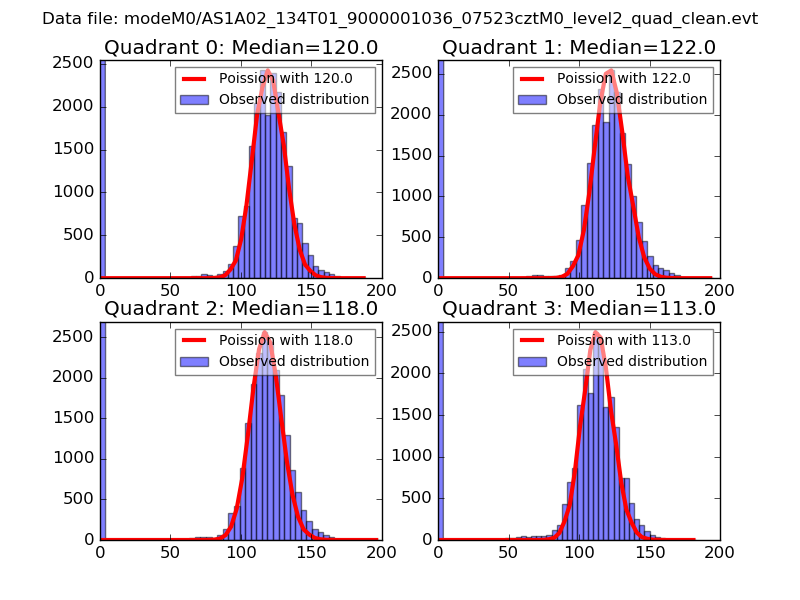 |
 |
| Quadrant-wise count rates Data is divided into 100 sec bins |
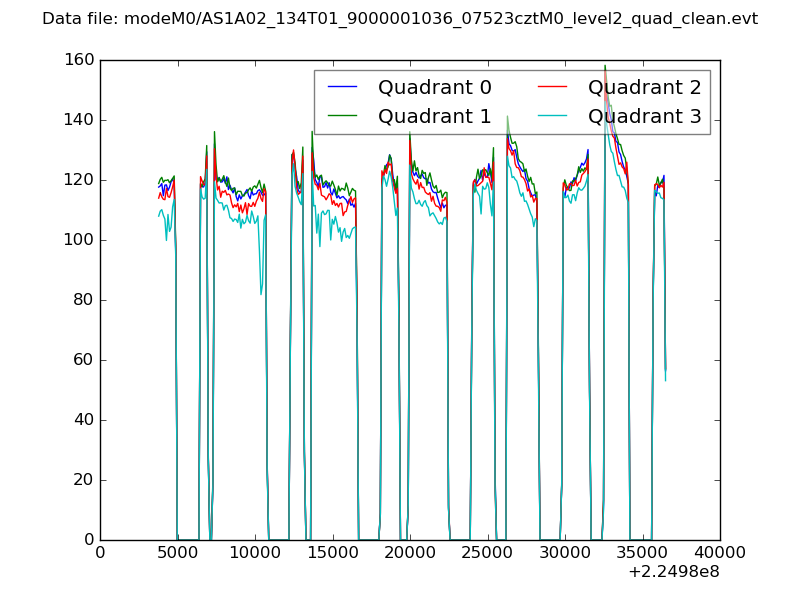 |
|
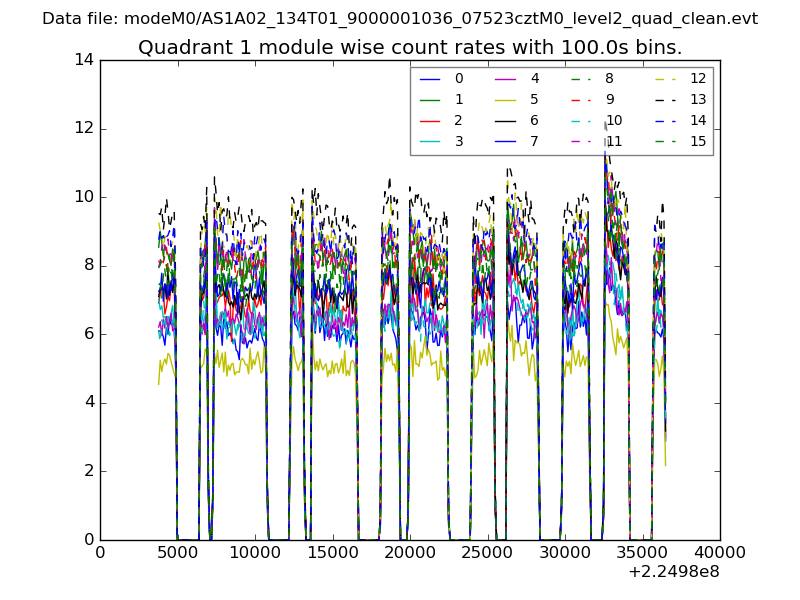
| Module-wise count rates for Quadrant A Data is divided into 100 sec bins |
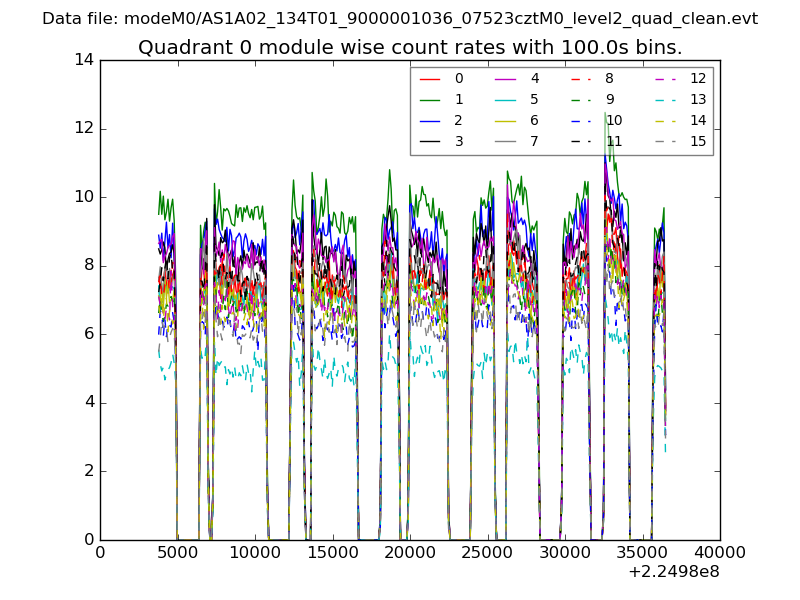 |
 |
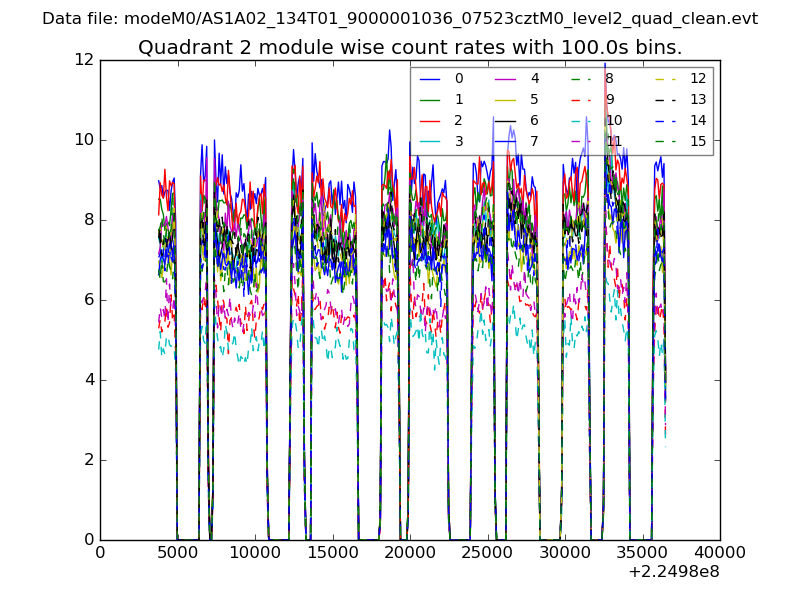
| Module-wise count rates for Quadrant B Data is divided into 100 sec bins |
 |
 |
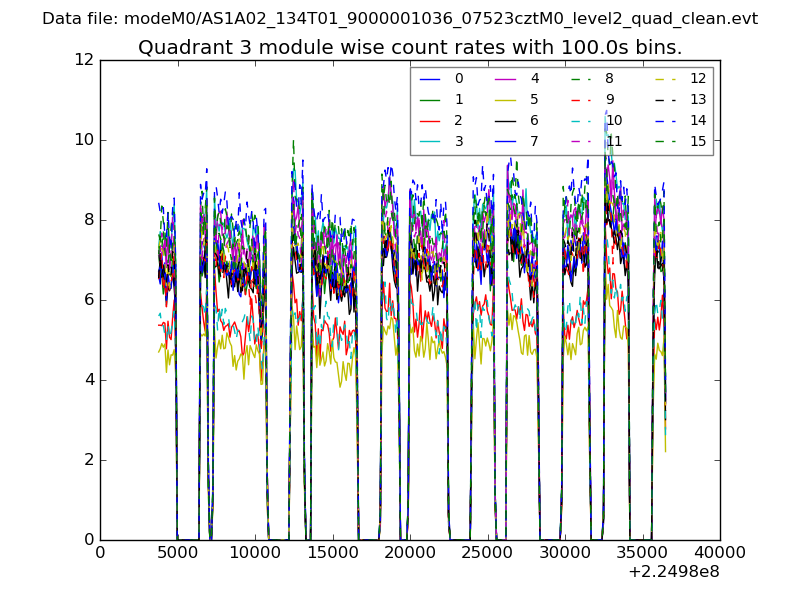
| Module-wise count rates for Quadrant C Data is divided into 100 sec bins |
 |
 |
| Module-wise count rates for Quadrant D Data is divided into 100 sec bins |
 |
 |
| Parameter | Plot |
|---|---|
| CZT HV Monitor | 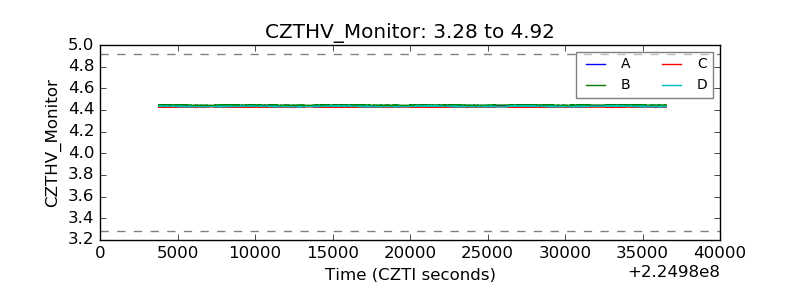 |
| D_VDD | 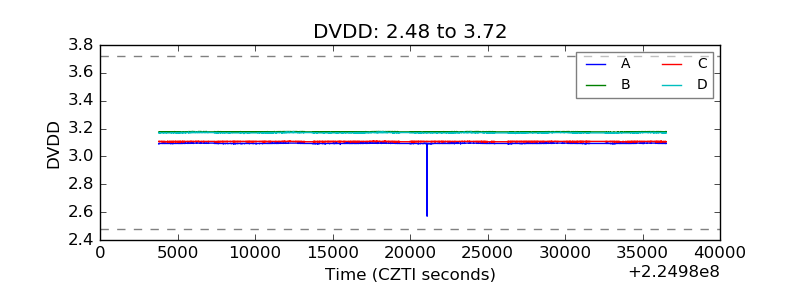 |
| Temperature 1 |  |
| Veto HV Monitor | 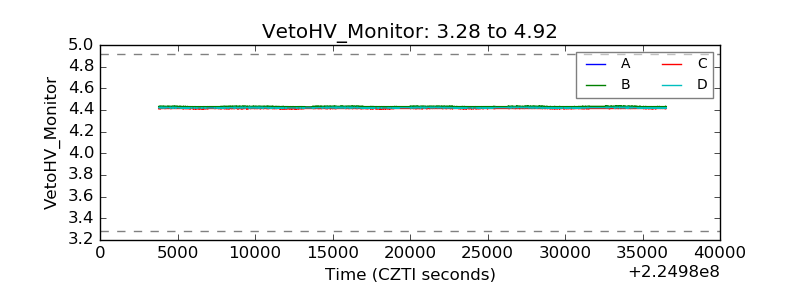 |
| Veto LLD | 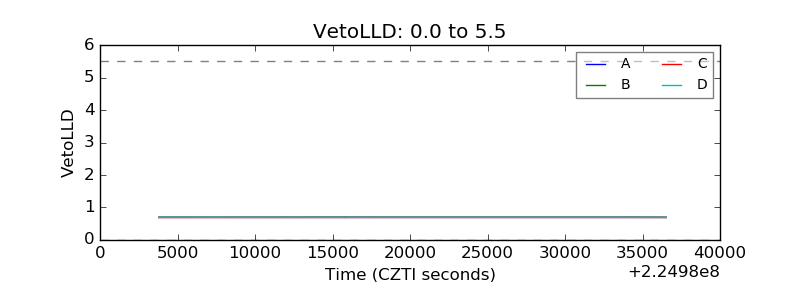 |
| Alpha Counter | 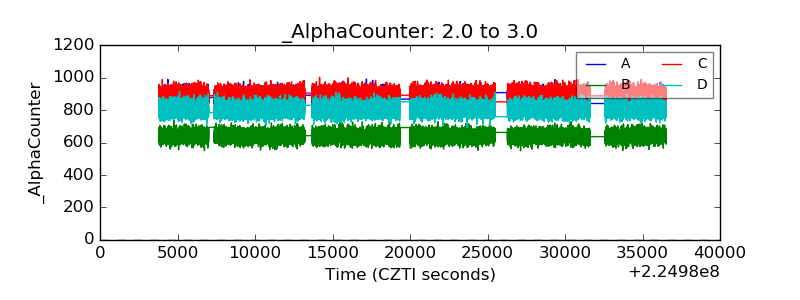 |
| _CPM_Rate | 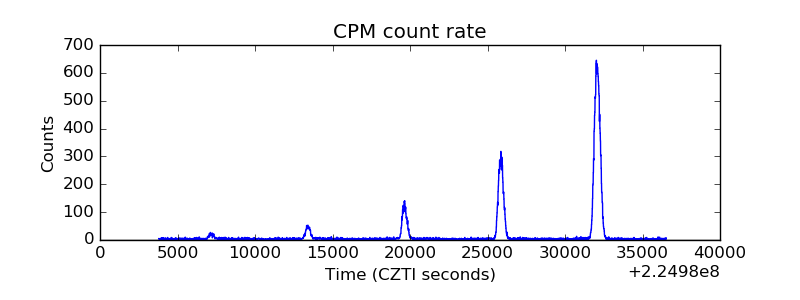 |
| CZT Counter |  |
| +2.5 Volts monitor |  |
| +5 Volts monitor | 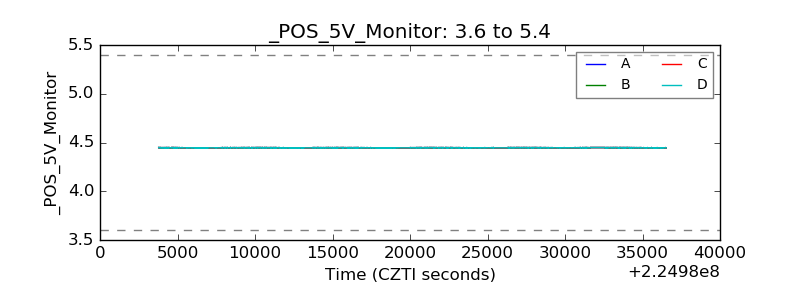 |
| _ROLL_ROT | 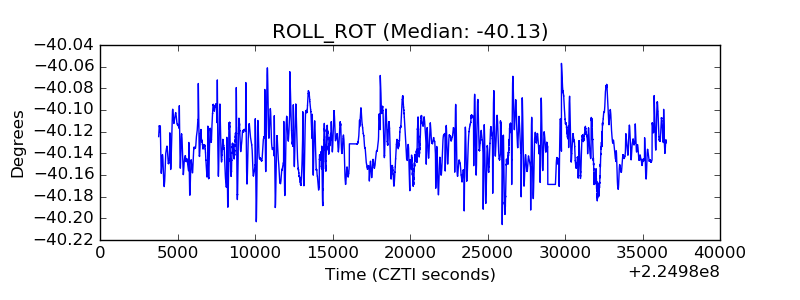 |
| _Roll_DEC | 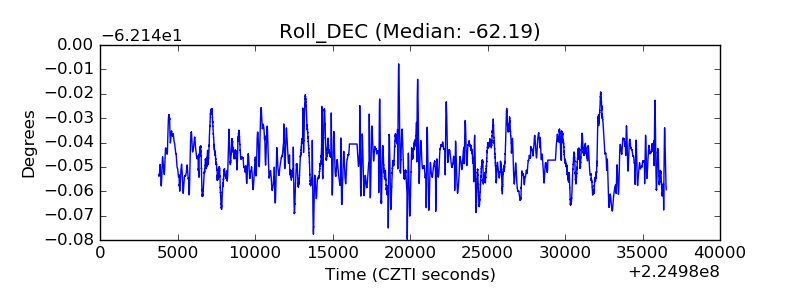 |
| _Roll_RA | 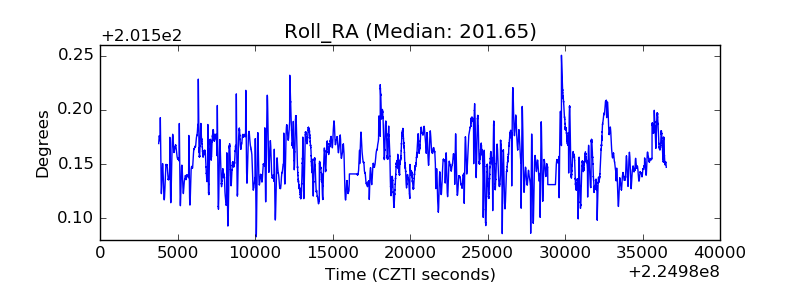 |
| Veto Counter | 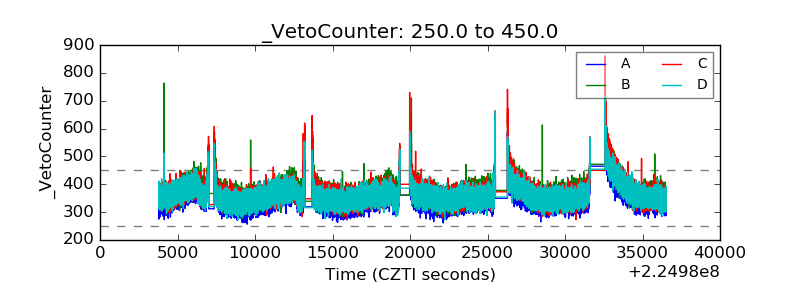 |