| Param | Original file | Final file |
|---|---|---|
| Filename | modeM0/AS1G06_076T01_9000001038cztM0_level2.fits | modeM0/AS1G06_076T01_9000001038cztM0_level2_quad_clean.evt |
| Size (bytes) | 1,146,674,880 | 1,195,557,120 |
| Size | 1.1 GB | 1.1 GB |
| Events in quadrant A | 6,977,584 | 7,327,050 |
| Events in quadrant B | 6,768,566 | 7,385,795 |
| Events in quadrant C | 6,790,500 | 6,837,880 |
| Events in quadrant D | 5,850,302 | 6,320,354 |
| Mode M9 | |||
|---|---|---|---|
| Quadrant | BADHDUFLAG | Total packets | Discarded packets |
| A | 0 | 202 | 0 |
| B | 0 | 202 | 0 |
| C | 0 | 202 | 0 |
| D | 0 | 202 | 0 |
| Mode M0 | |||
|---|---|---|---|
| Quadrant | BADHDUFLAG | Total packets | Discarded packets |
| A | 0 | 251604 | 0 |
| B | 0 | 252998 | 0 |
| C | 0 | 257257 | 0 |
| D | 0 | 282983 | 0 |
| Mode SS | |||
|---|---|---|---|
| Quadrant | BADHDUFLAG | Total packets | Discarded packets |
| A | 0 | 2478 | 0 |
| B | 0 | 2478 | 0 |
| C | 0 | 2478 | 0 |
| D | 0 | 2478 | 0 |
| Quadrant | Total seconds | Saturated seconds | Saturation percentage |
|---|---|---|---|
| A | 121713 | 1417 | 1.164214% |
| B | 121712 | 1479 | 1.215164% |
| C | 121712 | 1826 | 1.500263% |
| D | 121714 | 2943 | 2.417963% |
Noise dominated data is calculated using 1-second bins in cleaned event files. If a bin has >2000 counts, and if more than 50% of those come from <1% of pixels, then it is considered to be noise-dominated and hence unusable.
| Quadrant | # 1 sec bins | Bins with >0 counts | Bins with >2000 counts | High rate bins dominated by noise | Noise dominated (total time) | Noise dominated (detector-on time) | Marked lightcurve |
|---|---|---|---|---|---|---|---|
| A | 141641 | 121704 | 0 | 0 | 0.00% | 0.00% |  |
| B | 141641 | 121704 | 0 | 0 | 0.00% | 0.00% |  |
| C | 141641 | 121704 | 0 | 0 | 0.00% | 0.00% |  |
| D | 141641 | 121681 | 0 | 0 | 0.00% | 0.00% |  |
Top three noisy pixels from each quadrant. If the there are fewer than three noisy pixels in the level2.evt file, extra rows are filled as -1
| Pixel properties | Quadrant properties | ||||||
|---|---|---|---|---|---|---|---|
| Quadrant | DetID | PixID | Counts | Sigma | Mean | Median | Sigma |
| A | 0 | 29 | 6897 | 11.48 | 1815 | 1702 | 452.6 |
| A | 7 | 110 | 5852 | 9.17 | 1815 | 1702 | 452.6 |
| A | 0 | 30 | 5321 | 8.0 | 1815 | 1702 | 452.6 |
| B | 2 | 9 | 5662 | 11.19 | 1788 | 1704 | 353.7 |
| B | 14 | 254 | 4600 | 8.19 | 1788 | 1704 | 353.7 |
| B | 3 | 17 | 4596 | 8.18 | 1788 | 1704 | 353.7 |
| C | 1 | 80 | 4967 | 7.02 | 1796 | 1669 | 470.0 |
| C | 1 | 81 | 4911 | 6.9 | 1796 | 1669 | 470.0 |
| C | 12 | 241 | 4729 | 6.51 | 1796 | 1669 | 470.0 |
| D | 6 | 231 | 4319 | 6.31 | 1671 | 1520 | 443.2 |
| D | 11 | 82 | 4250 | 6.16 | 1671 | 1520 | 443.2 |
| D | 7 | 3 | 4146 | 5.92 | 1671 | 1520 | 443.2 |
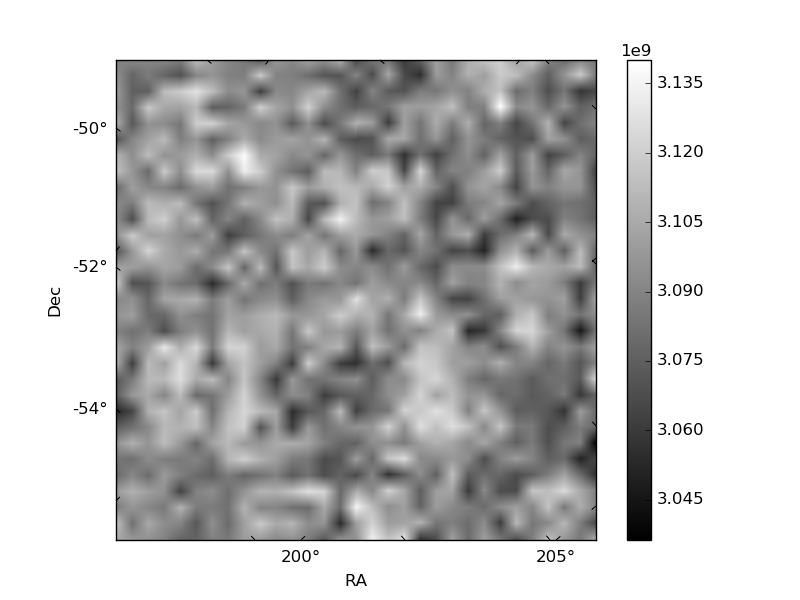
Histogram calculated using DETX and DETY for each event in the final _common_clean file
| Quadrant A | 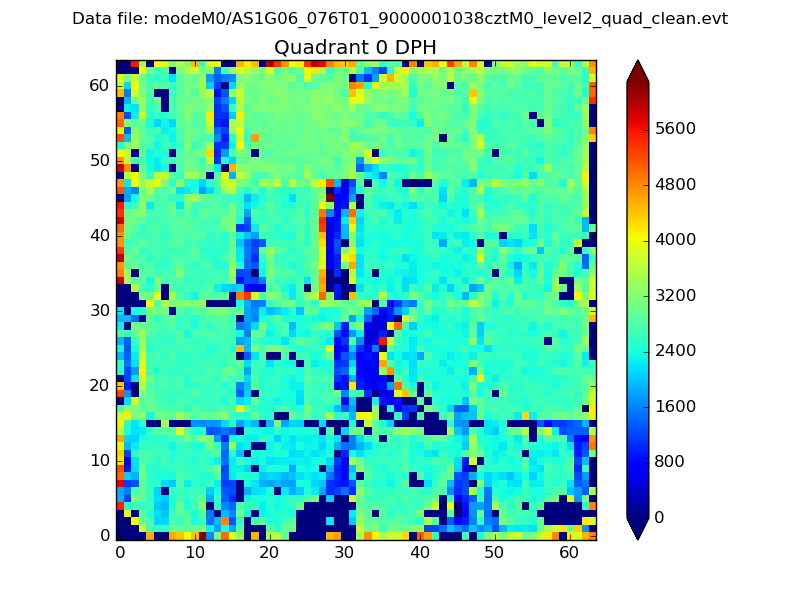 |
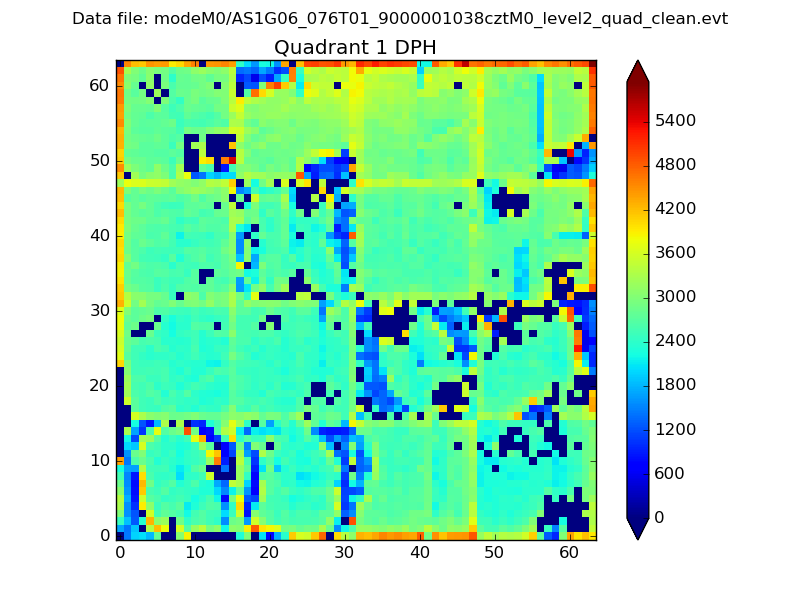 |
Quadrant B |
|---|---|---|---|
| Quadrant D | 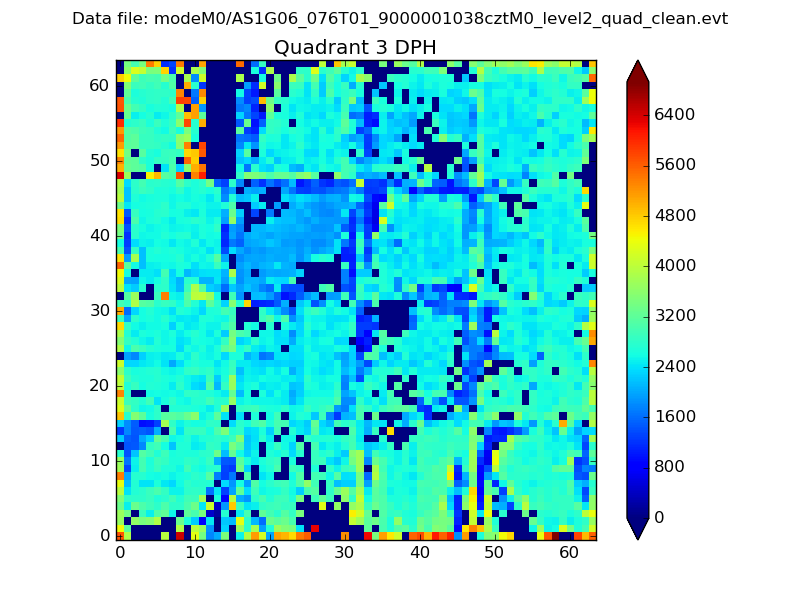 |
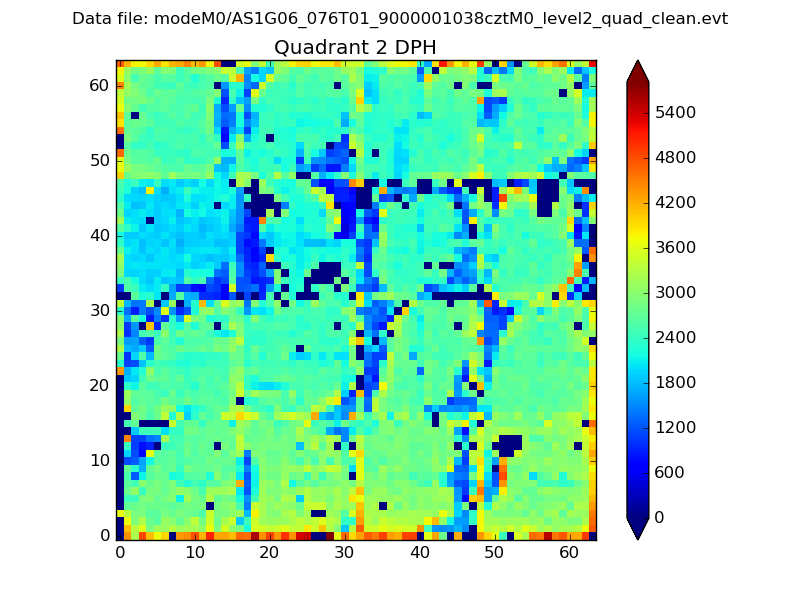 |
Quadrant C |
| Plot type | Count rate plots | Images |
|---|---|---|
| Comparison with Poisson distribution Blue bars denote a histogram of data divided into 1 sec bins. Red curve is a Poisson curve with rate = median count rate of data. |
 |
 |
| Quadrant-wise count rates Data is divided into 100 sec bins |
 |
|
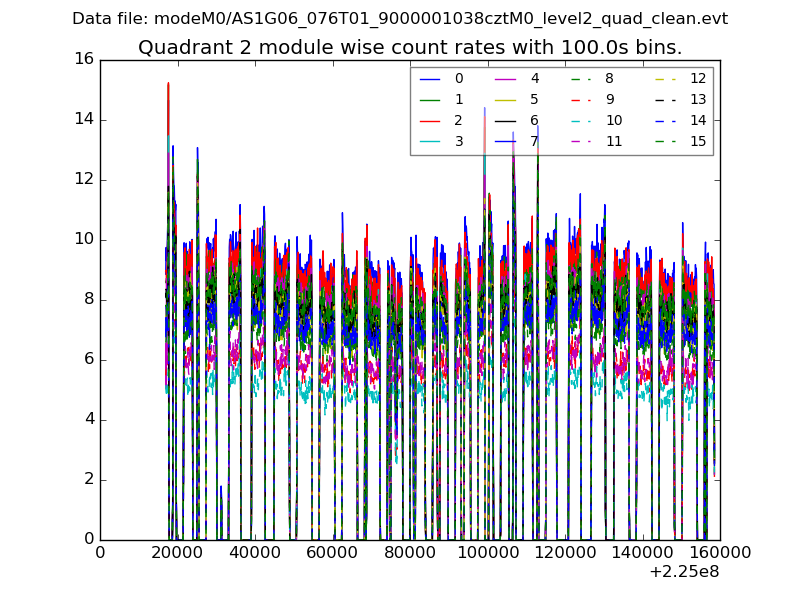
| Module-wise count rates for Quadrant A Data is divided into 100 sec bins |
 |
 |
| Module-wise count rates for Quadrant B Data is divided into 100 sec bins |
 |
 |
| Module-wise count rates for Quadrant C Data is divided into 100 sec bins |
 |
 |
| Module-wise count rates for Quadrant D Data is divided into 100 sec bins |
 |
 |
| Parameter | Plot |
|---|---|
| CZT HV Monitor |  |
| D_VDD | 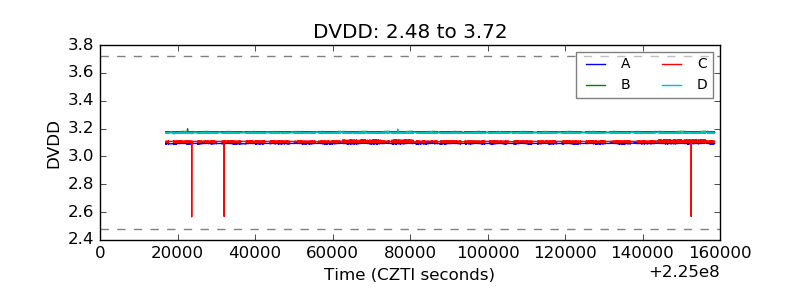 |
| Temperature 1 |  |
| Veto HV Monitor |  |
| Veto LLD |  |
| Alpha Counter |  |
| _CPM_Rate |  |
| CZT Counter |  |
| +2.5 Volts monitor |  |
| +5 Volts monitor |  |
| _ROLL_ROT | 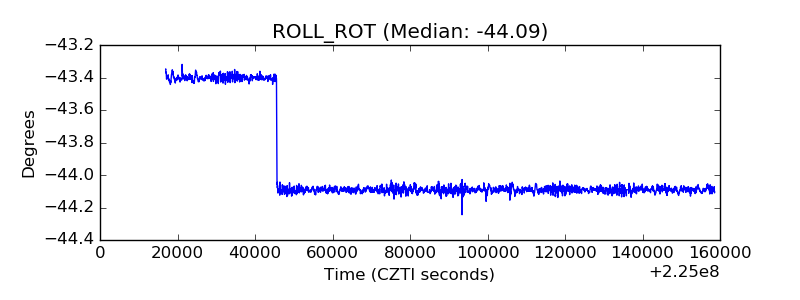 |
| _Roll_DEC |  |
| _Roll_RA | 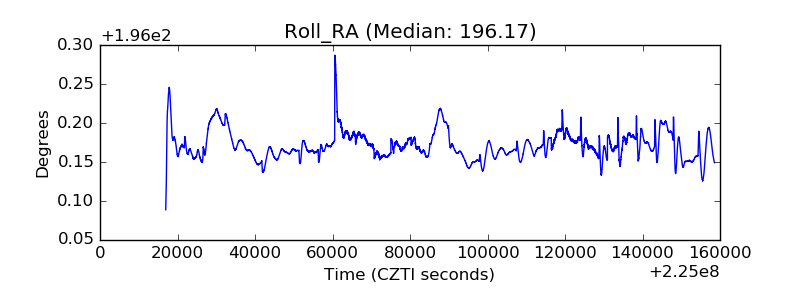 |
| Veto Counter |  |